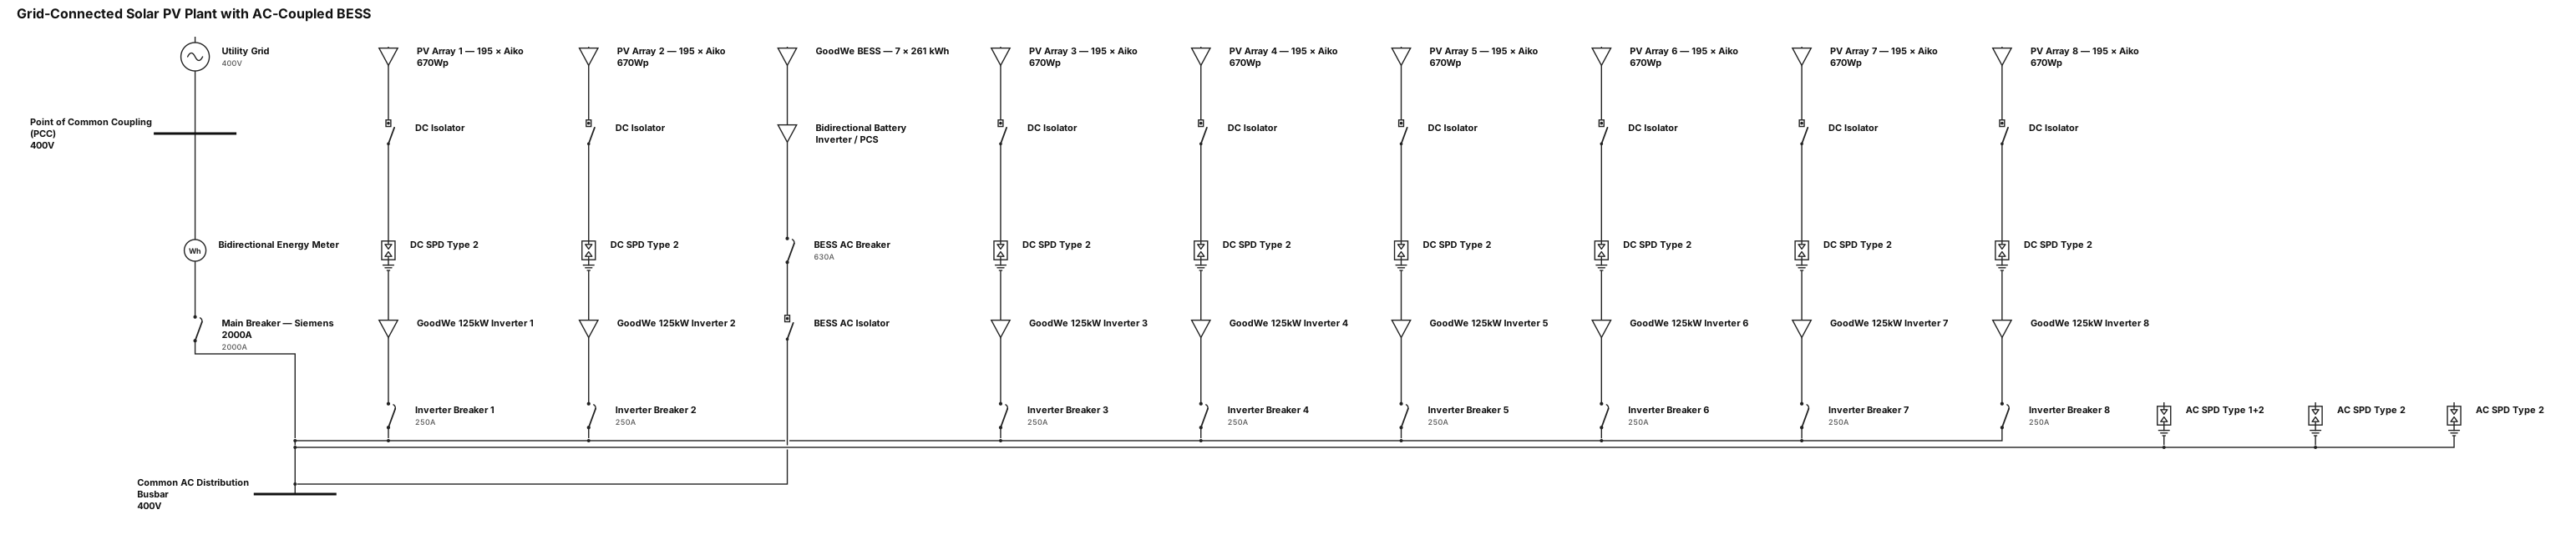
Create a professional electrical Single Line Diagram (SLD) for a grid-connected solar PV power plant with AC-coupled battery energy storage. Use standard IEC electrical symbols and a clear, engineering-grade layout. 1. Solar PV Array * Total number of PV modules: 1,560 modules. * Module manufacturer: aiko. * Module rated power: 670 Wp each. * Total installed DC capacity: 1,045.2 kWp. * Distribute the PV array across 8 GoodWe 125 kW inverters. * Show the PV strings connected to the respective inverters, with appropriate DC isolators and DC surge protection devices (SPDs) where applicable. 2. PV Inverters * Quantity: 8 units. * Manufacturer: GoodWe. * Rated AC power: 125 kW per inverter. * Total inverter AC capacity: 1,000 kW. * Provide a dedicated 250 A circuit breaker for each inverter. * Connect all eight inverter feeders to a common AC distribution busbar. 3. Main AC Protection * Main circuit breaker: 2,000 A. * Manufacturer: Siemens. * Connect the main breaker between the common AC busbar and the main point of connection. * Show appropriate AC surge protection, grounding, and protection devices as required by the final electrical design. 4. Battery Energy Storage System (BESS) * Manufacturer: GoodWe. * Battery energy capacity: 7*261 kWh per battery system. * Configuration: AC-coupled battery storage system. * Show the battery system connected on the AC side through its dedicated bidirectional battery inverter / PCS, with the required AC circuit breaker, isolation, and protection. * Clearly distinguish the battery system from the PV inverters. 5. Metering and Grid Connection * Include a bidirectional energy meter at the main point of connection to the utility grid. * Show the utility grid, point of common coupling (PCC), and the main metering arrangement. * Clearly indicate the direction of power flow for both grid export and battery charging.
Diagram Examples from Real Visitor Prompts
Browse eligible diagrams shared by FreeDiagram visitors, inspect the exact prompts, and build your own version.
Browse 3269 real creationsAll visitor creations
Showing 385–408 of 3269. No stock examples or system defaults. Choose a tool, study a real result, then reopen its prompt as your starting point.

I have a Mitsubishi FX5U 32M PLC, an MGS1600GY magnetic sensor, 2 BLVD KRD Type R motor drivers, a motor, and 2 BLHM5100KC GFS motors. I’m going to assemble them as an AGV. With your intelligence, make the ladder diagram in detail and make sure the motor PID works well.

Create a clean, easy-to-read Amazon Rainforest Food Web for a school project. IMPORTANT DESIGN RULES: Use ONLY words, labels, and arrows. NO pictures, drawings, icons, or decorations. Use a plain white background with black text. Make the diagram neat, organized, and easy to understand. Show arrows pointing from the food to the organism that eats it, showing the direction energy travels. Arrange organisms by energy level, with producers near the bottom, consumers above them, and decomposers off to the side. Create a real food WEB with multiple connections, not just one straight food chain. INCLUDE THESE EXACT 15 ORGANISMS: ANIMALS (5): Jaguar Toucan Three-toed sloth Poison dart frog Giant river otter PLANTS (5): Brazil nut tree Rubber tree Kapok tree Cacao tree Giant water lily FUNGI (5): Bracket fungi Wood-decay mushrooms Cup fungi Mycorrhizal fungi Decomposer molds FOOD WEB CONNECTIONS: Sun → plants (show energy entering the food web). Cacao tree and Brazil nut tree → toucan, where the fruits or seeds are eaten. Suitable leaves → three-toed sloth. Insects → poison dart frog. Fish → giant river otter. Appropriate prey → jaguar. Dead plant material → wood-decay fungi, bracket fungi, cup fungi, and decomposer molds. Mycorrhizal fungi ↔ plant roots to show their mutually beneficial relationship. You may include “insects,” “fish,” “plant roots,” and “dead plant material” as small supporting labels, but do not count them as part of the 15 organisms. Do not invent feeding relationships just to connect everything. Make sure every arrow is biologically reasonable. If a connection is uncertain, leave it out. At the bottom, add a small legend: “Arrows show the direction energy moves from food to eater.”
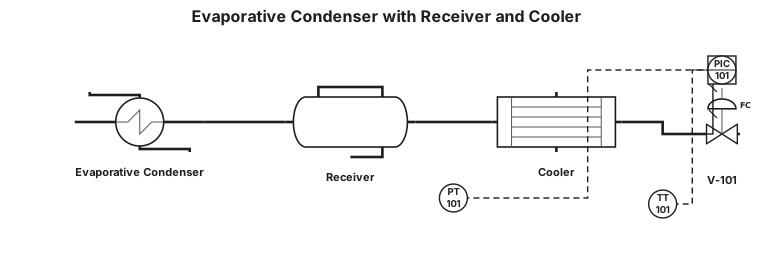
a evapourative condensor and it outlet is a receiver and it outlet is cooler put valve and PT and TT
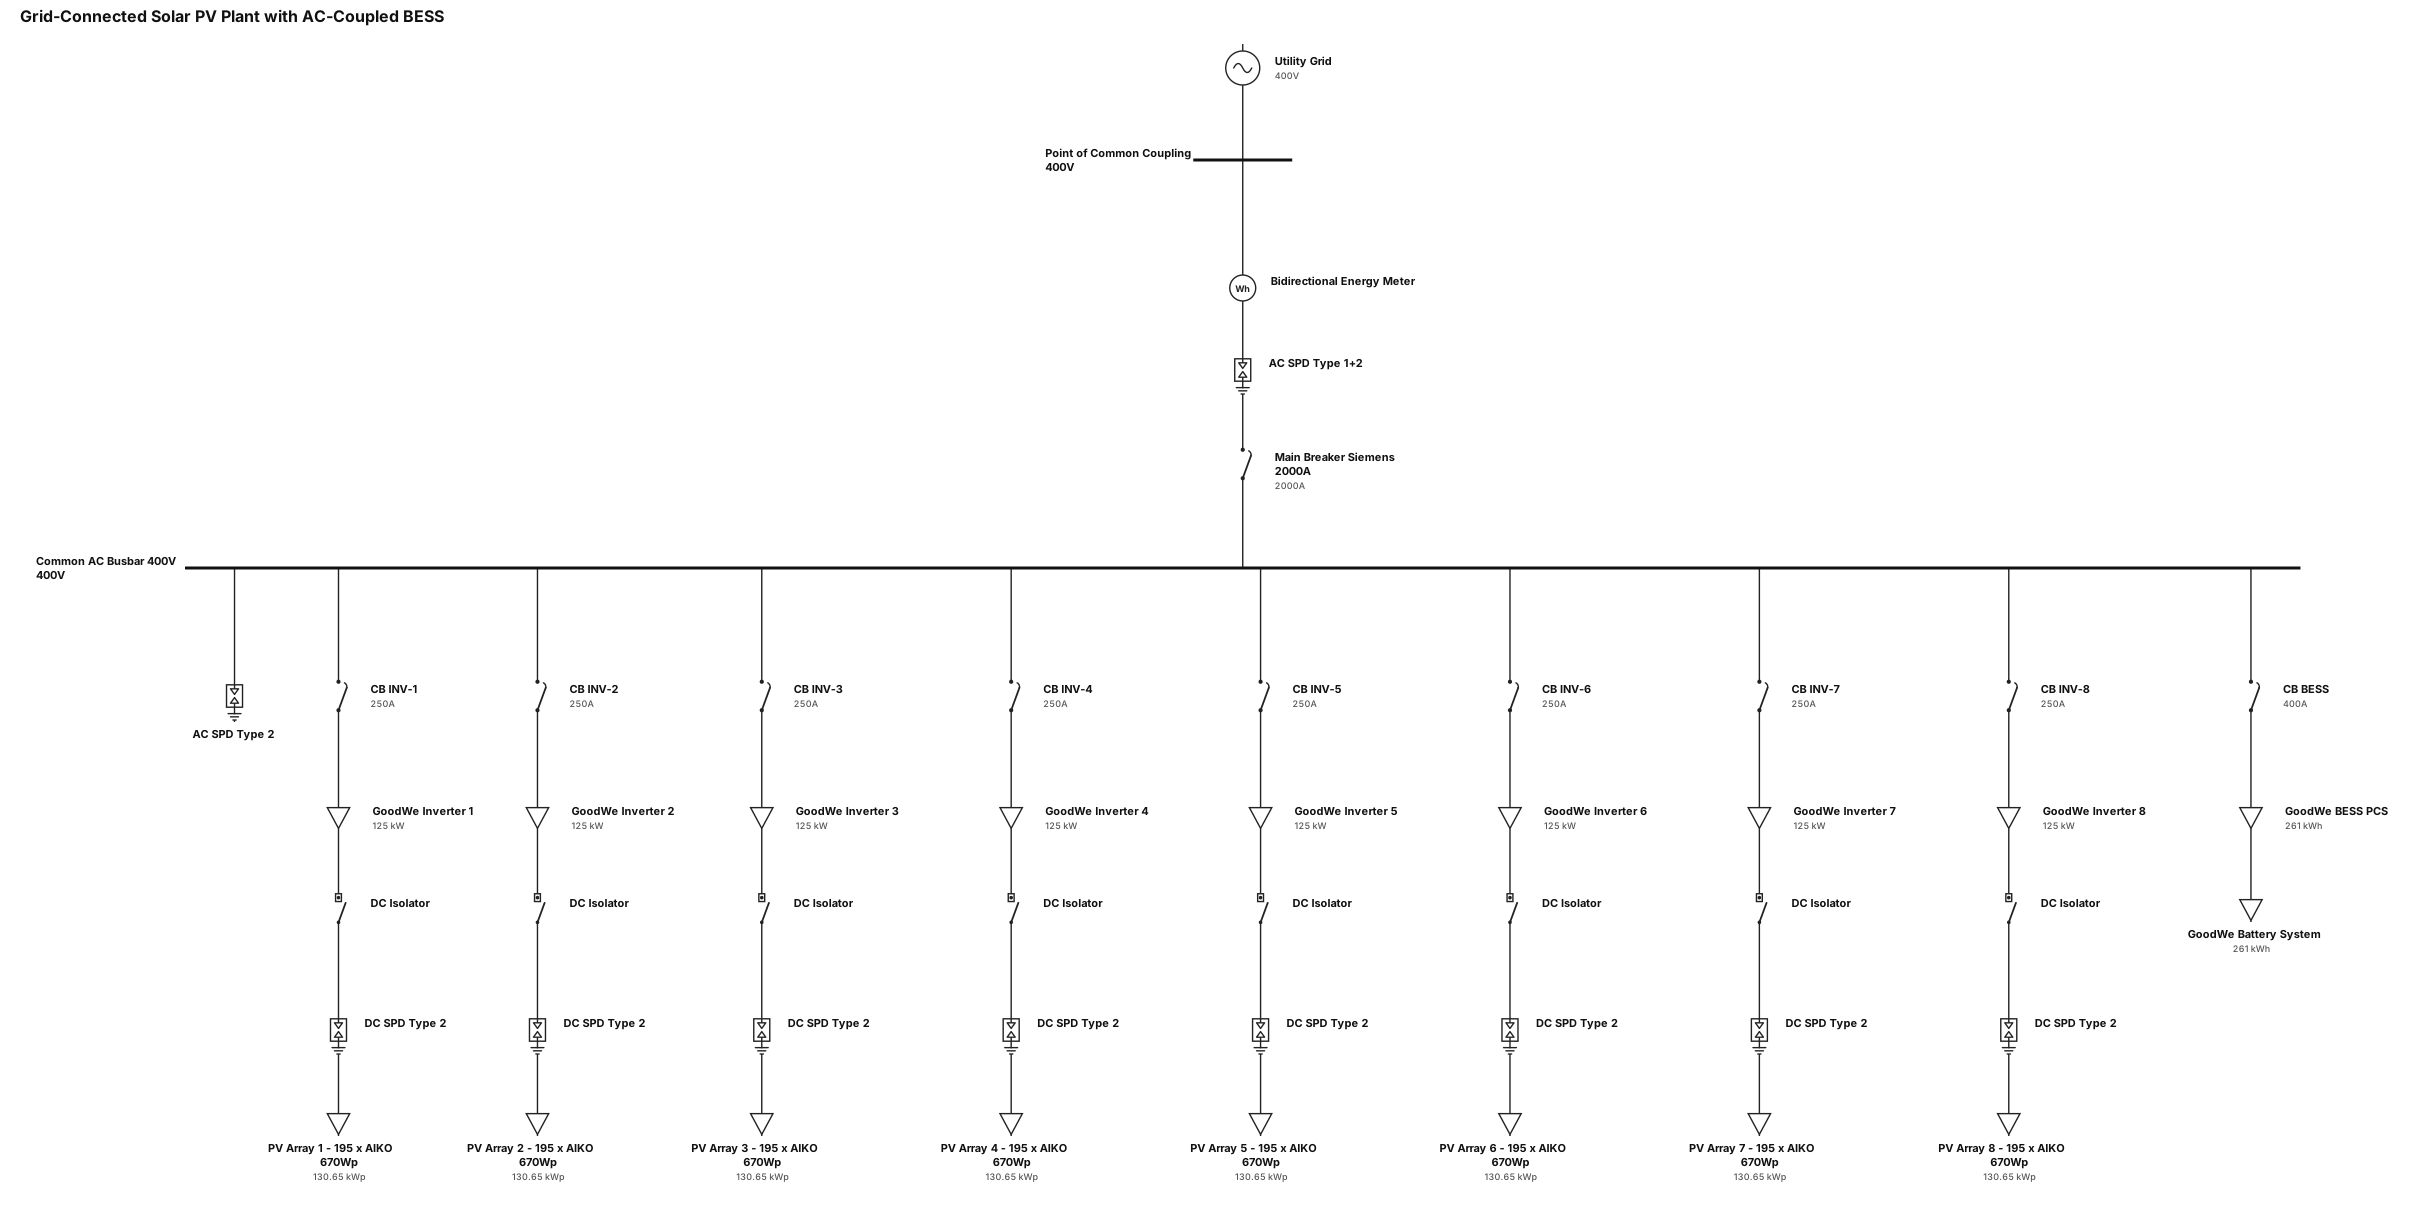
Create a professional electrical Single Line Diagram (SLD) for a grid-connected solar PV power plant with AC-coupled battery energy storage. Use standard IEC electrical symbols and a clear, engineering-grade layout. 1. Solar PV Array * Total number of PV modules: 1,560 modules. * Module manufacturer: aiko. * Module rated power: 670 Wp each. * Total installed DC capacity: 1,045.2 kWp. * Distribute the PV array across 8 GoodWe 125 kW inverters. * Show the PV strings connected to the respective inverters, with appropriate DC isolators and DC surge protection devices (SPDs) where applicable. 2. PV Inverters * Quantity: 8 units. * Manufacturer: GoodWe. * Rated AC power: 125 kW per inverter. * Total inverter AC capacity: 1,000 kW. * Provide a dedicated 250 A circuit breaker for each inverter. * Connect all eight inverter feeders to a common AC distribution busbar. 3. Main AC Protection * Main circuit breaker: 2,000 A. * Manufacturer: Siemens. * Connect the main breaker between the common AC busbar and the main point of connection. * Show appropriate AC surge protection, grounding, and protection devices as required by the final electrical design. 4. Battery Energy Storage System (BESS) * Manufacturer: GoodWe. * Battery energy capacity: 261 kWh per battery system. * Configuration: AC-coupled battery storage system. * Show the battery system connected on the AC side through its dedicated bidirectional battery inverter / PCS, with the required AC circuit breaker, isolation, and protection. * Clearly distinguish the battery system from the PV inverters. 5. Metering and Grid Connection * Include a bidirectional energy meter at the main point of connection to the utility grid. * Show the utility grid, point of common coupling (PCC), and the main metering arrangement. * Clearly indicate the direction of power flow for both grid export and battery charging.
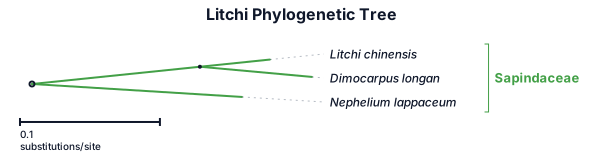
A phylogenetic tree of litchi
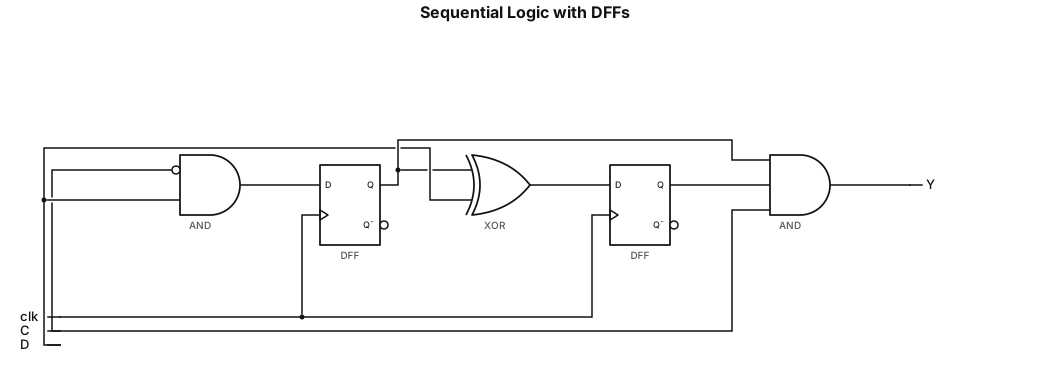
1. This circuit contains two D Flip-Flops (Q0 and Q1) triggered by the negative edge of the clock (negedge clk). 2. The D input for Q0 is the result of an AND operation between (~C) and D. 3. The D input for Q1 is the result of an XOR operation between Q0 and D. 4. The final output Y is the result of an AND operation (Q0 & Q1 & C).
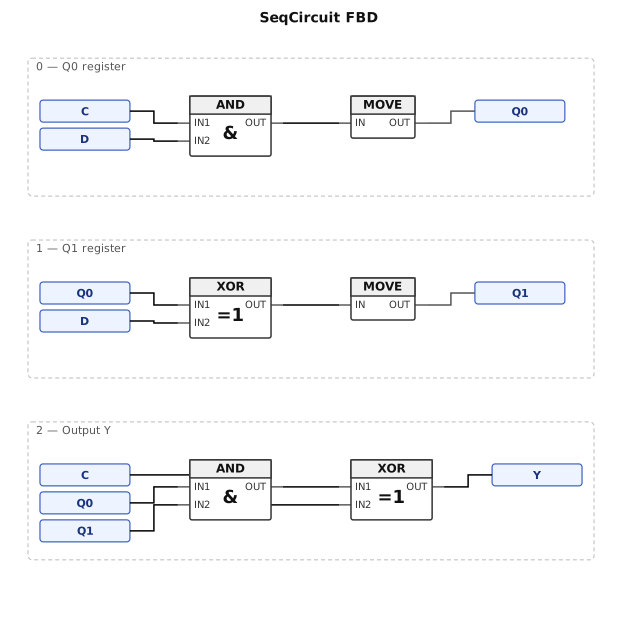
Draw the functional block diagram (fbd) of the circuit resulting from the synthesis of the following Verilog code. module SeqCircuit (clk, C, D, Y); input clk, C, D; output Y; reg 20, Q1; always @ (negedge clk) begin QO<= C & D; Q1<= (Q0D); end assign Y = (Q0 & Q1) A C; endmodule
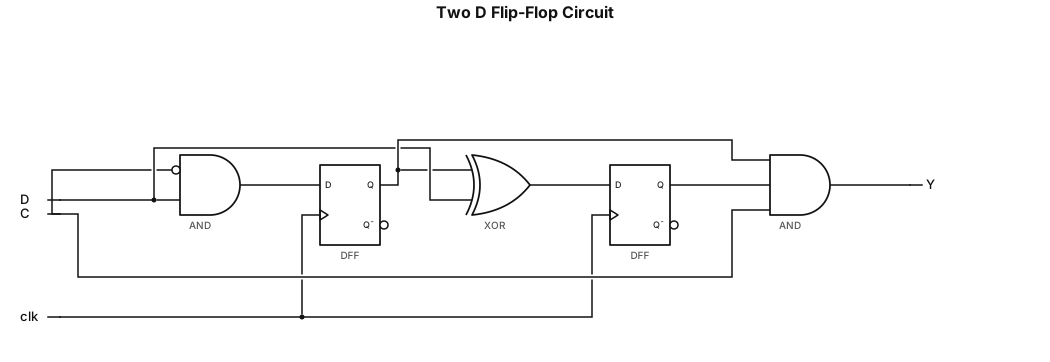
1. This circuit has two D Flip-Flops (Q0 and Q1) triggered by the negative edge of the clock (negedge clk). 2. Input D for Q0 is the result of an AND gate between (~C) and D. 3. Input D for Q1 is the result of an XOR gate between QO and D.. 4. The final output Y is the result of the AND gate (Q0 & Q1 & C).
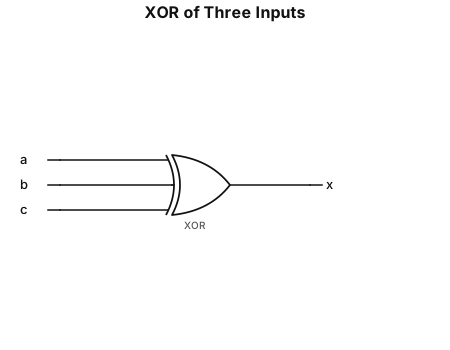
\[ \boxed{x=a\oplus b\oplus c} \]
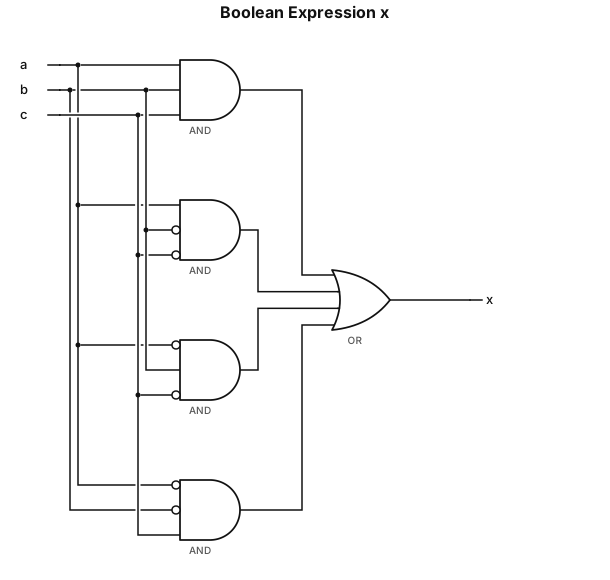
\[ x=abc+a\bar b\bar c+\bar ab\bar c+\bar a\bar bc \]
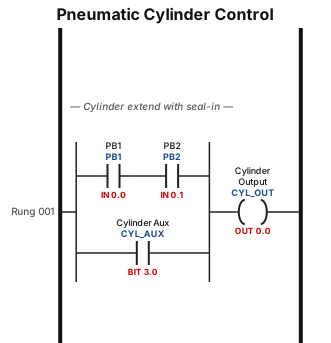
A ladder logic program for a pneumatic cylinder: when PB1 input 0 , output is 0, if pb2 is 0 ,output is 0,when pb1 is 1,output is 0,when pb2 is 1,output is 0,use AND gate with seal in
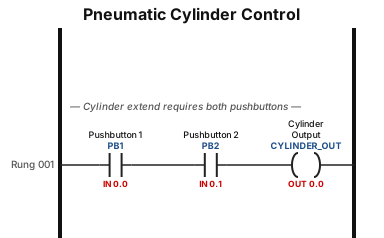
A ladder logic program for a pneumatic cylinder: when PB1 input 0 , output is 0, if pb2 is 0 ,output is 0,when pb1 is 1,output is 0,when pb2 is 1,output is 0,use AND gate
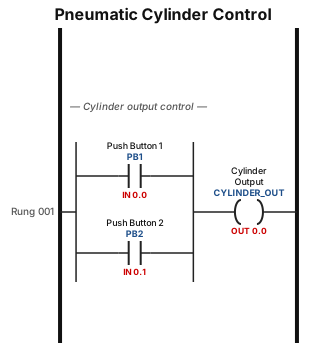
A ladder logic program for a pneumatic cylinder: when PB1 input 0 , output is 0, if pb2 is 0 ,output is 0,when pb1 is 1,output is 0,when pb2 is 1,output is 0,use OR gate
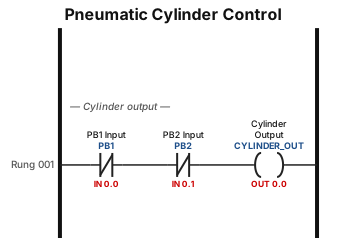
A ladder logic program for a pneumatic cylinder: when PB1 input 0 , output is 0, if pb2 is 0 ,output is 0,when pb1 is 1,output is 0,when pb2 is 1,output is 0
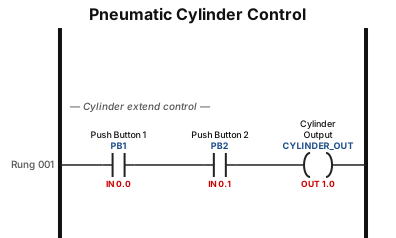
A ladder logic program for a pneumatic cylinder: when 2 PB input 1 , output is 1,if pb1 is 0,out is 0
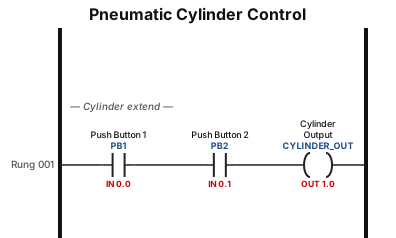
A ladder logic program for a pneumatic cylinder: when 2 PB input 1 , output is 1
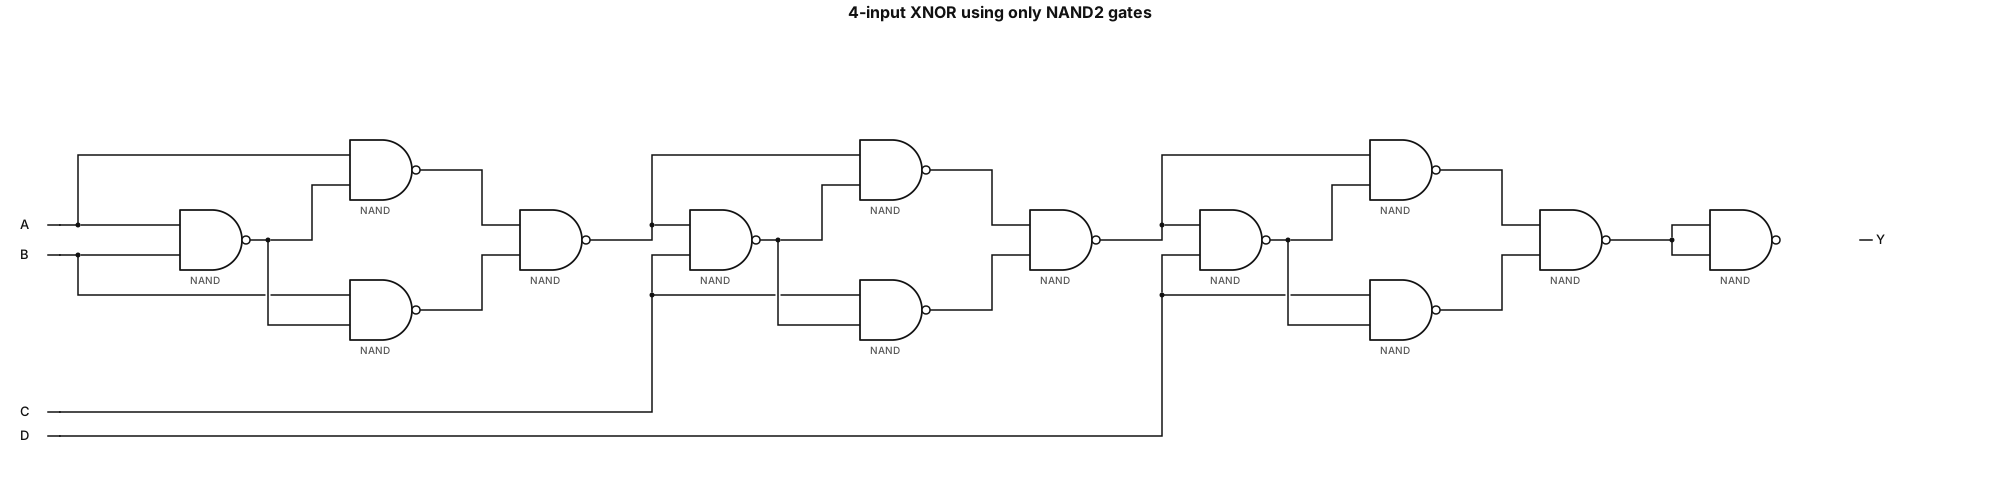
Draw a complete 4-input XNOR gate-level schematic using ONLY 2-input NAND gates. Final Boolean function: Y = NOT(A XOR B XOR C XOR D) Exactly four primary inputs: A, B, C, D. Use exactly 13 NAND2 gates. Follow this exact netlist: N1 = NAND(A, B) N2 = NAND(A, N1) N3 = NAND(B, N1) N4 = NAND(N2, N3) N5 = NAND(N4, C) N6 = NAND(N4, N5) N7 = NAND(C, N5) N8 = NAND(N6, N7) N9 = NAND(N8, D) N10 = NAND(N8, N9) N11 = NAND(D, N9) N12 = NAND(N10, N11) N13 = NAND(N12, N12) Y = N13 Drawing requirements: - Use only NAND2 symbols (AND-shaped gate with an output inversion bubble). - Do not use XOR, XNOR, NOR, OR, AND or separate inverter symbols. - Show all 13 gates individually. - Label gates N1 through N13. - Arrange the circuit in three stages followed by the final NAND2 inverter. - Connect every wire exactly according to the netlist. - Explicitly connect N13 output to Y. - Avoid overlapping wires and ambiguous connections. - Use a clean black-and-white textbook-style gate-level schematic. - Verify all 16 input combinations. - Do not change the gate count or Boolean functions.
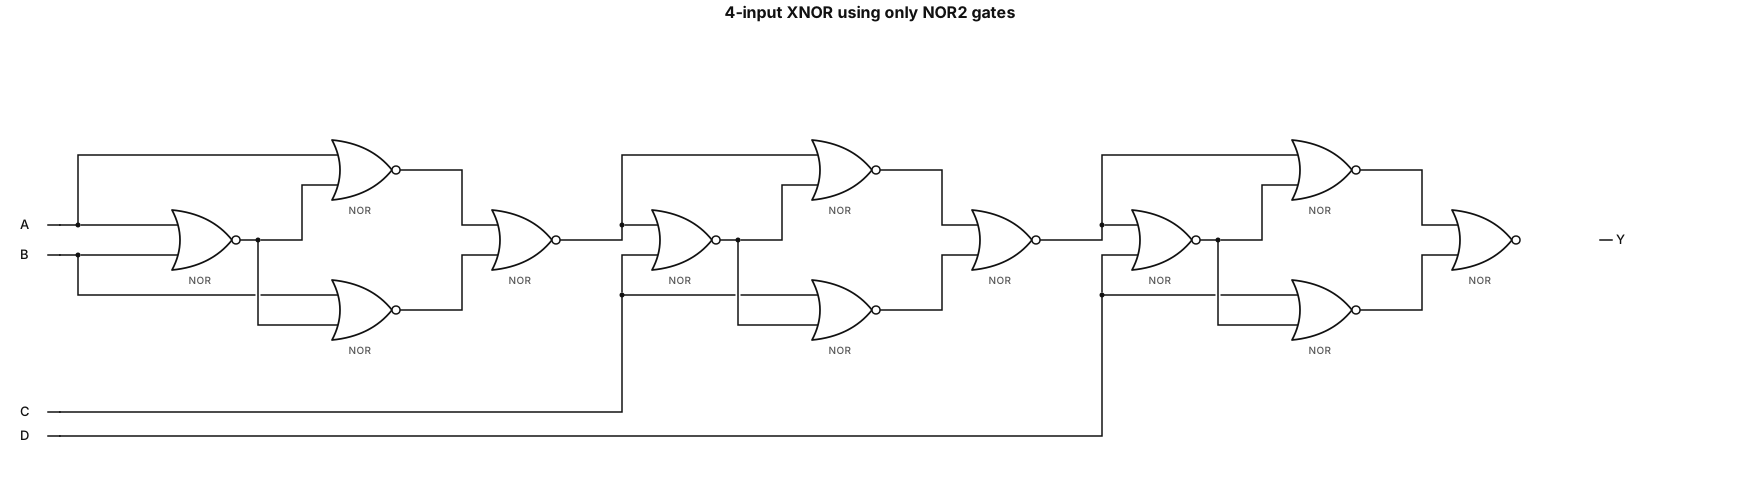
Draw a complete gate-level logic circuit for a 4-input XNOR (XNOR4) using ONLY 2-input NOR gates. Boolean function: Y = NOT(A XOR B XOR C XOR D) Requirements: - Exactly four primary inputs: A, B, C, D. - Use ONLY NOR2 gates. - Do NOT use XOR, XNOR, AND, OR, NAND, or NOT gate symbols. - No complemented primary inputs are available. - Draw exactly 12 NOR2 gates. - Show every intermediate signal and connection. - Arrange the circuit from left to right in three stages. - Do not simplify or replace any NOR2 network with XOR/XNOR symbols. Implement the following exact gate-level netlist: STAGE 1: 4 NOR2 gates N1 = NOR(A, B) N2 = NOR(A, N1) N3 = NOR(B, N1) N4 = NOR(N2, N3) STAGE 2: 4 NOR2 gates N5 = NOR(N4, C) N6 = NOR(N4, N5) N7 = NOR(C, N5) N8 = NOR(N6, N7) STAGE 3: 4 NOR2 gates N9 = NOR(N8, D) N10 = NOR(N8, N9) N11 = NOR(D, N9) N12 = NOR(N10, N11) FINAL OUTPUT: Y = N12 Show exactly 12 individual NOR2 symbols labeled N1 through N12. All wires must follow the exact netlist above. Use a clean black-and-white engineering textbook schematic with clearly labeled inputs, intermediate nodes, and output Y. Verify that Y=1 when the number of HIGH inputs among A, B, C, D is even. Do not optimize or change the specified gate connections.

Crea un mapa conceptual en español titulado “Historia de Santo Domingo”. Organízalo con seis temas principales: La llegada de los esclavizados, Los tratados, La Era Francesa, La España Boba, La Independencia Efímera y La sociedad taína. Para cada tema, incluye fechas importantes, causas, características, personajes y consecuencias cuando correspondan. Utiliza cuadros, flechas, colores diferentes y palabras clave. Organiza la información de forma clara, con ideas principales y secundarias, sin párrafos largos. El mapa debe ser fácil de leer, estudiar y presentar en la escuela. Usa un diseño horizontal y permite descargarlo como imagen o PDF.
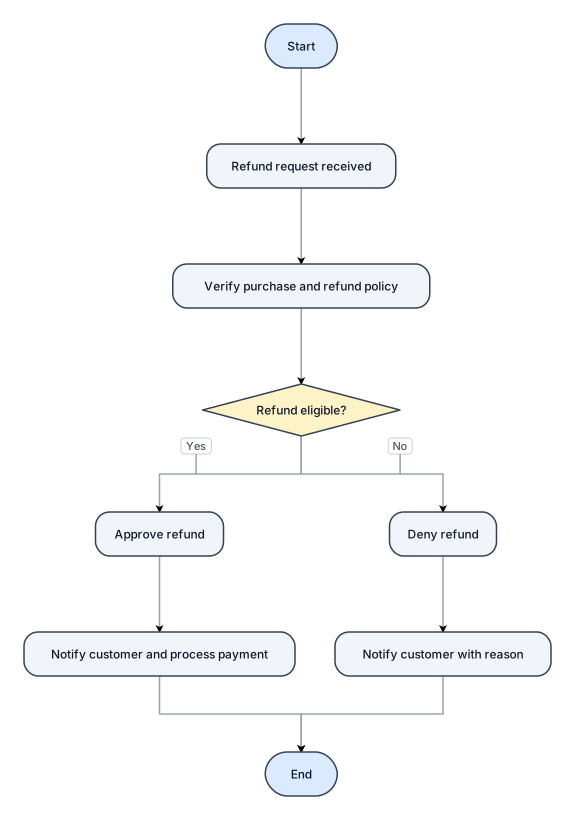
A flowchart for handling a customer refund request, with approve and deny paths
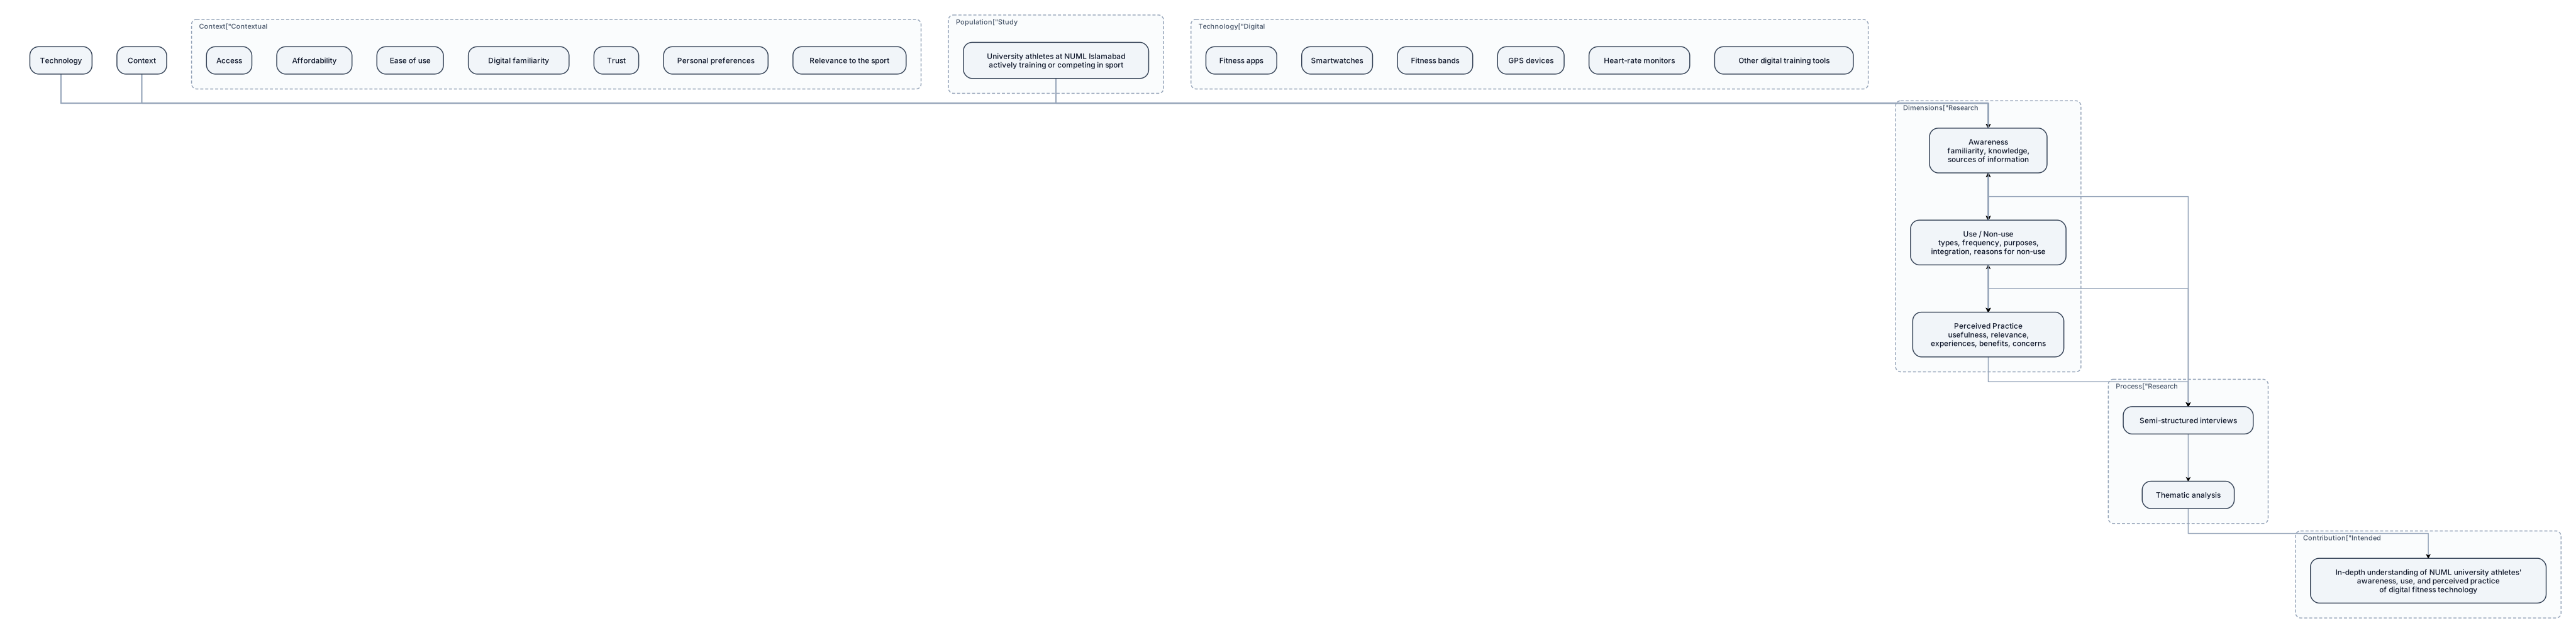
Create a professional academic conceptual framework diagram for the research titled “Awareness, Use, and Perceived Practice of Digital Fitness Technology for Training Among University Athletes”. Study population: enrolled NUML Islamabad students who actively train or compete in a sport. Show the following structure: 1. **Study Population:** University athletes at NUML Islamabad. 2. **Digital Fitness Technology:** Fitness apps, smartwatches, fitness bands, GPS devices, heart-rate monitors, and other digital training tools. 3. **Three interconnected research dimensions:** - Awareness: familiarity, knowledge, and sources of information. - Use / Non-use: types of technology, frequency, purposes, integration into training, and reasons for non-use. - Perceived Practice: perceived usefulness, relevance to training, experiences, benefits, and concerns. 4. **Contextual factors:** Access, affordability, ease of use, digital familiarity, trust, personal preferences, and relevance to the sport. 5. **Research process:** Semi-structured interviews followed by thematic analysis. 6. **Intended contribution:** An in-depth understanding of NUML university athletes’ awareness, use, and perceived practice of digital fitness technology. Use labelled boxes, clean arrows, a balanced layout, restrained academic colours, and readable typography. Show that the three research dimensions are interconnected, not independent and dependent variables in a causal model. Do not imply that technology necessarily improves athletic performance. Make the diagram suitable for insertion into a university research proposal.
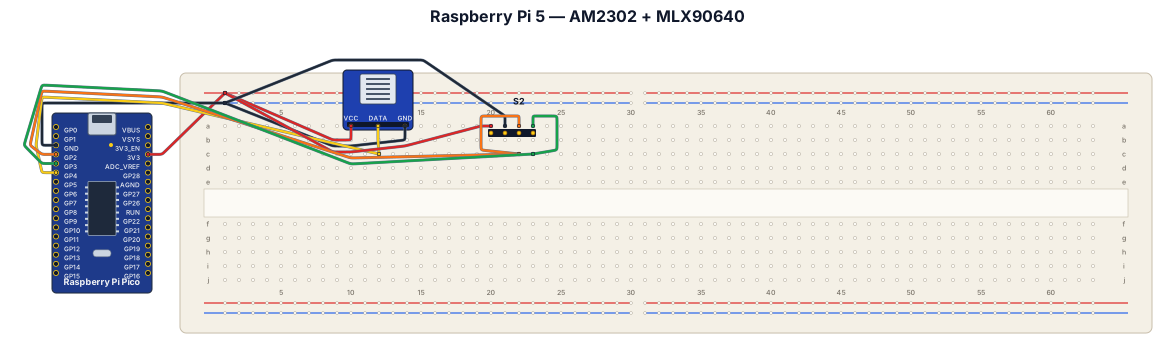
A breadboard wiring diagram for a raspberry pi 5, using an asair am2302 and adafruit mlx90640
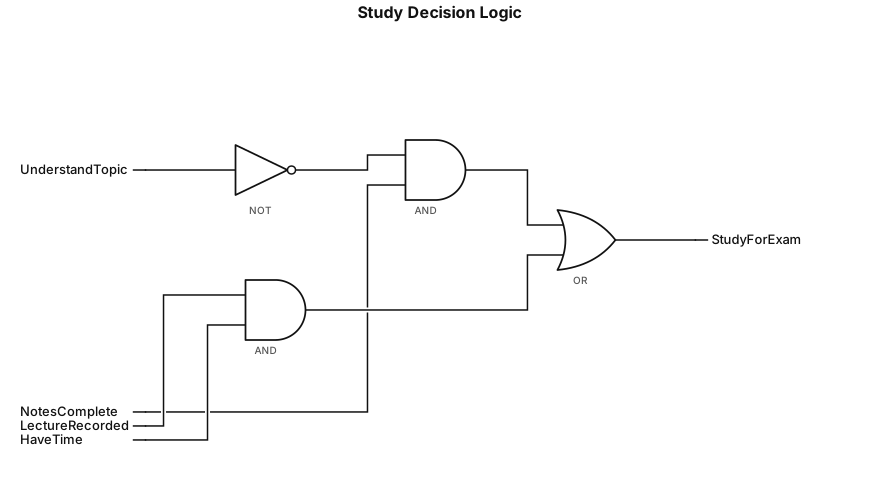
If I do not understand the topic and the notes are complete, or if the lecture is recorded and I have time, then I will study for the exam.