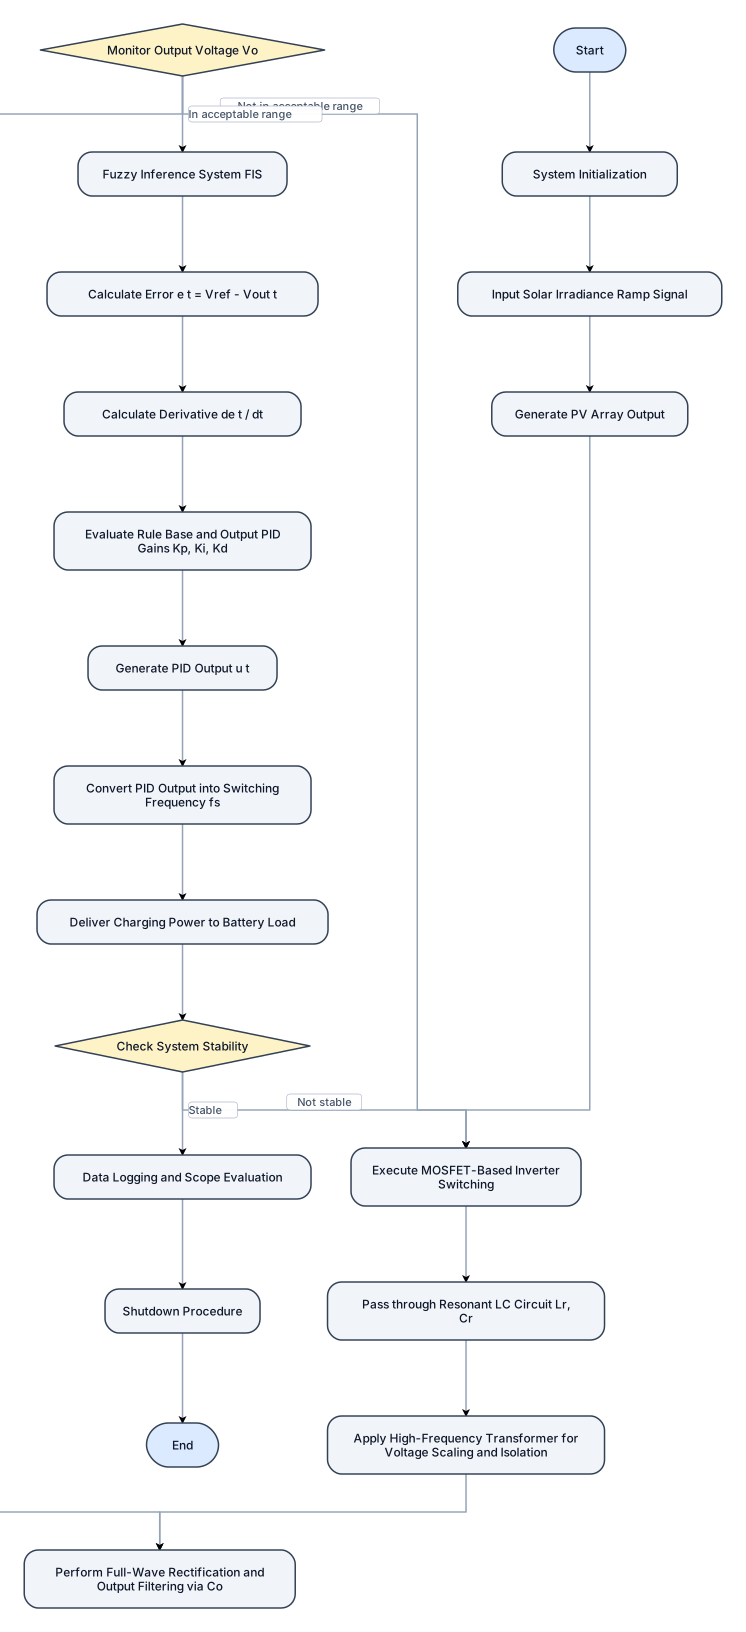
Input: PV Array Output, Reference Voltage Vref Output: Regulated Charging Voltage Vout, Stable Battery Charging Power Begin Control Algorithm: Start System Initialization Input Solar Irradiance (Ramp Signal) Generate PV Array Output Begin Power Conversion: Execute MOSFET-Based Inverter Switching Pass through Resonant LC Circuit: Lr,Cr Apply High-Frequency Transformer for Voltage Scaling and Isolation Perform Full-Wave Rectification and Output Filtering via Co Monitor Output Voltage Vo: If Vo is not within the acceptable range: Return to Inverter Switching and repeat Else Continue to Controller Phase Fuzzy Inference System (FIS): Calculate Error: e(t) = Vref − Vout(t) Calculate Derivative: ∆e(t) = de(t) dt Evaluate Rule Base and Output PID Gains: Kp,Ki,Kd Generate PID Output: Use PID Equation: u(t) = Kpe(t)+Ki t 0 e(τ)dτ+Kd de(t) Convert PID Output into Switching Frequency fs Deliver Charging Power to Battery Load Check System Stability: If System is Stable: Proceed to Data Logging Else Loop back to Step 4 for Adjustment Data Logging and Scope Evaluation Shutdown Procedure End
Diagram Examples from Real Visitor Prompts
Browse eligible diagrams shared by FreeDiagram visitors, inspect the exact prompts, and build your own version.
Browse 1008 real creationsFlowchart
Showing 1–12 of 12. No stock examples or system defaults. Choose a tool, study a real result, then reopen its prompt as your starting point.
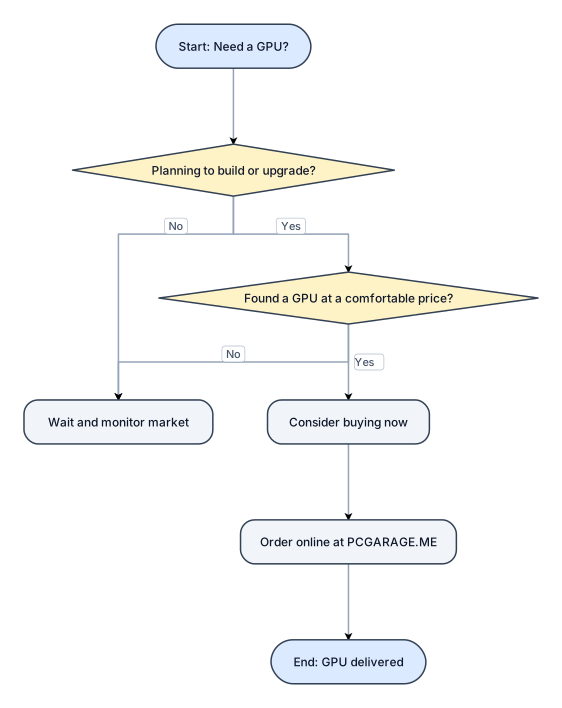
**HOOK:** **When should you actually buy a GPU? 👀** If you’ve been waiting for prices to come down, it might be worth taking a closer look at what’s happening with memory prices. **BODY:** Memory prices have been increasing, and that can have an impact on the overall cost of graphics cards, since memory is a key component of a GPU. At the same time, strong AI demand, supply conditions, and changing component costs are all affecting the GPU market. So, will GPU prices keep rising? Honestly, **we don’t know.** Prices could change in either direction, and no guarantee waiting will necessarily mean getting a better deal. So if you’re already planning to build a PC, upgrade your GPU, or you’ve found a graphics card at a price you’re comfortable with, **it may make sense to consider buying now rather than waiting for an uncertain price drop.** Because next month, the price could even be higher. 💀 The key is to keep an eye on the market and buy when the price and the GPU you want make sense for you. **ENDING / CTA:** So, what do you think? 👀 **Are you buying a GPU now, or waiting for prices to drop?** And if you’re ready to upgrade, check out **PCGARAGE.ME**, order online, and have your GPU delivered.
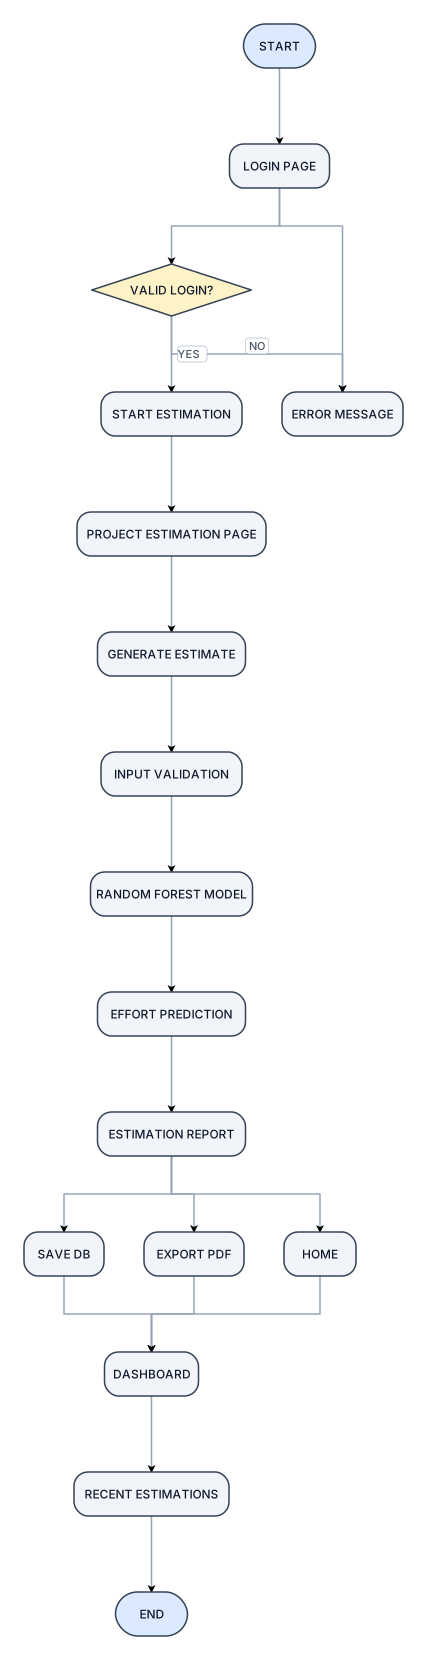
Create a clean and professional SYSTEM FLOW DIAGRAM for an MCA mini project titled: “AI-BASED SOFTWARE PROJECT EFFORT ESTIMATION SYSTEM” The diagram must look like a student manually created it using Microsoft Word for a formal project report. STYLE REQUIREMENTS: - Black and white only - Pure white background - No colours - No icons - No pictures - No 3D effects - No decorative graphics - No gradients - No unnecessary content - Use simple rectangular boxes with clean black borders - Use one simple diamond shape only for the login decision - Use straight, clear arrows - Use a formal readable font similar to Times New Roman - Text should be sharp, clear and moderately bold - Keep proper spacing between boxes - Make the diagram compact and fit on one report page - Make it impressive through clean alignment and professional spacing, not through decoration - Do not make the diagram too large or overcrowded FLOW: START ↓ LOGIN PAGE ↓ VALID LOGIN? ↙ ↘ NO YES ↓ ↓ ERROR MESSAGE START ESTIMATION ↑ ↓ └────── LOGIN PROJECT ESTIMATION PAGE ↓ GENERATE ESTIMATE ↓ INPUT VALIDATION ↓ RANDOM FOREST MODEL ↓ EFFORT PREDICTION ↓ ESTIMATION REPORT ↙ ↓ ↘ SAVE DB EXPORT PDF HOME ↓ DASHBOARD ↓ RECENT ESTIMATIONS ↓ END IMPORTANT: Keep the flow exactly as given. Do not add extra modules, technologies, explanations, database details, or additional steps. The final diagram must be short, simple, sharp, professional, black-and-white, and suitable for direct placement in an MCA mini project report.
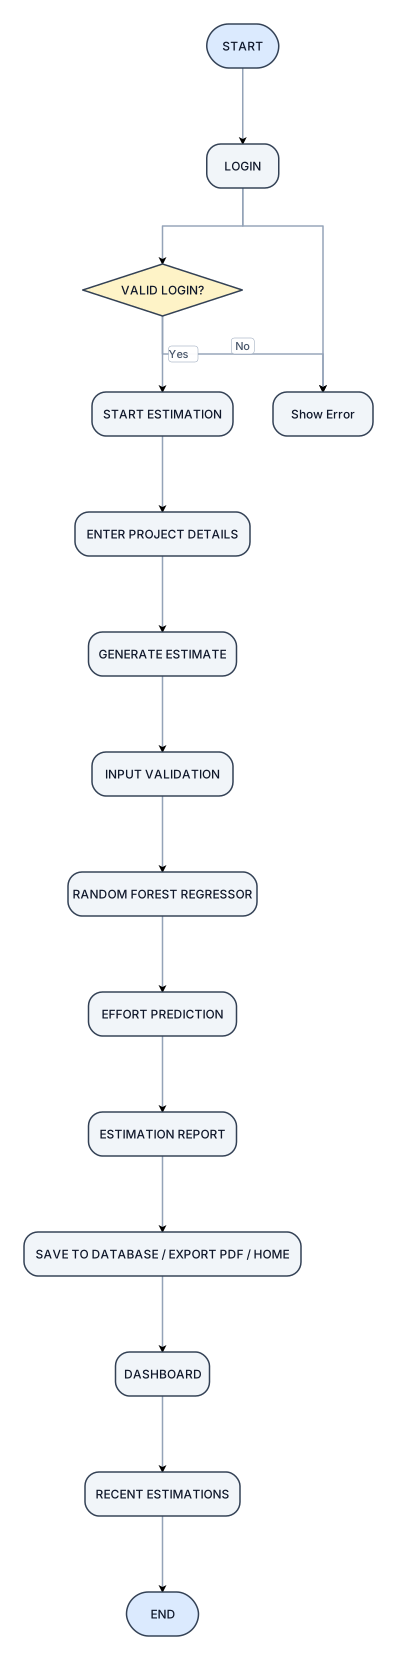
Create a simple system flow diagram for an AI-Based Software Project Effort Estimation System. Use a black and white theme only. Use simple rectangular boxes, one decision diamond, straight arrows, white background and clear bold text. Make it short and suitable for an MCA mini project report, as if it was manually drawn in Microsoft Word. Do not use icons, colors, 3D effects, decorations or unnecessary details. Flow: START ↓ LOGIN ↓ VALID LOGIN? No → Show Error → Login Yes ↓ START ESTIMATION ↓ ENTER PROJECT DETAILS (Project Title, Type, Complexity, Development Environment, Project Size, Team Experience, Reliability) ↓ GENERATE ESTIMATE ↓ INPUT VALIDATION ↓ RANDOM FOREST REGRESSOR ↓ EFFORT PREDICTION ↓ ESTIMATION REPORT ↓ SAVE TO DATABASE / EXPORT PDF / HOME ↓ DASHBOARD ↓ RECENT ESTIMATIONS ↓ END Keep the diagram compact, clean, readable and suitable for direct insertion into a black-and-white project report.

5. "What do you know about the proposal process?" You don't need to pretend you're a Shipley expert. Show that you understand the lifecycle. Answer At a high level, I understand the proposal process as starting with understanding the solicitation and identifying every requirement that needs a response. From there, the team builds a compliance matrix, assigns responsibilities, establishes a schedule and coordinates the technical, management and pricing inputs. As the proposal develops, the team goes through reviews and revisions to make sure the response is compliant, accurate and consistent. On the pricing side, you need to develop the underlying cost elements and BOEs, validate the assumptions, build the pricing model and make sure the pricing artifacts align with the technical and contractual requirements. The final stage is really about compliance, quality control and making sure everything is submitted correctly and on time. I haven't owned every part of that lifecycle myself, but I've spent years supporting the pricing portion and working with the teams responsible for it, so I'm very familiar with the environment.
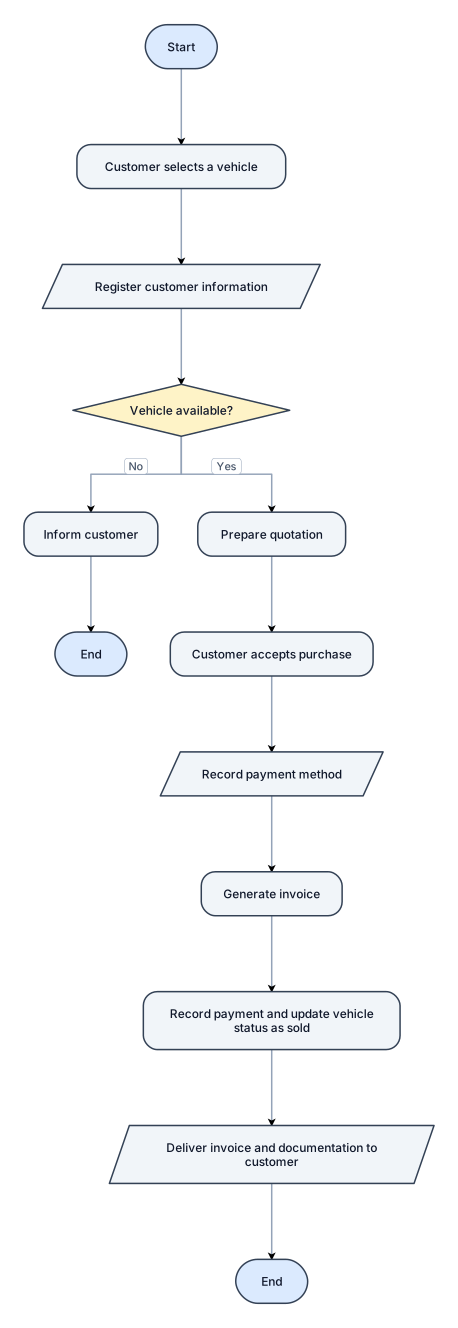
Generate a simple flowchart that represents the billing process of a small company dedicated to vehicle sales. The process should include the following stages: 1. Start. 2. The customer selects a vehicle. 3. Register the customer's information. 4. Check vehicle availability. 5. If the vehicle is not available, inform the customer and end the process. 6. If it is available, prepare the quotation. 7. The customer accepts the purchase. 8. Record the payment method. 9. Generate the invoice. 10. Record the payment and update the vehicle status as sold. 11. Deliver the invoice and corresponding documentation to the customer. 12. End. Use standard flowchart symbols: * Oval for Start and End. * Rectangle for processes. * Diamond for decisions. * Parallelogram for data input or output. The flowchart should be clear, organized, and easy to understand, suitable for a small vehicle sales company.
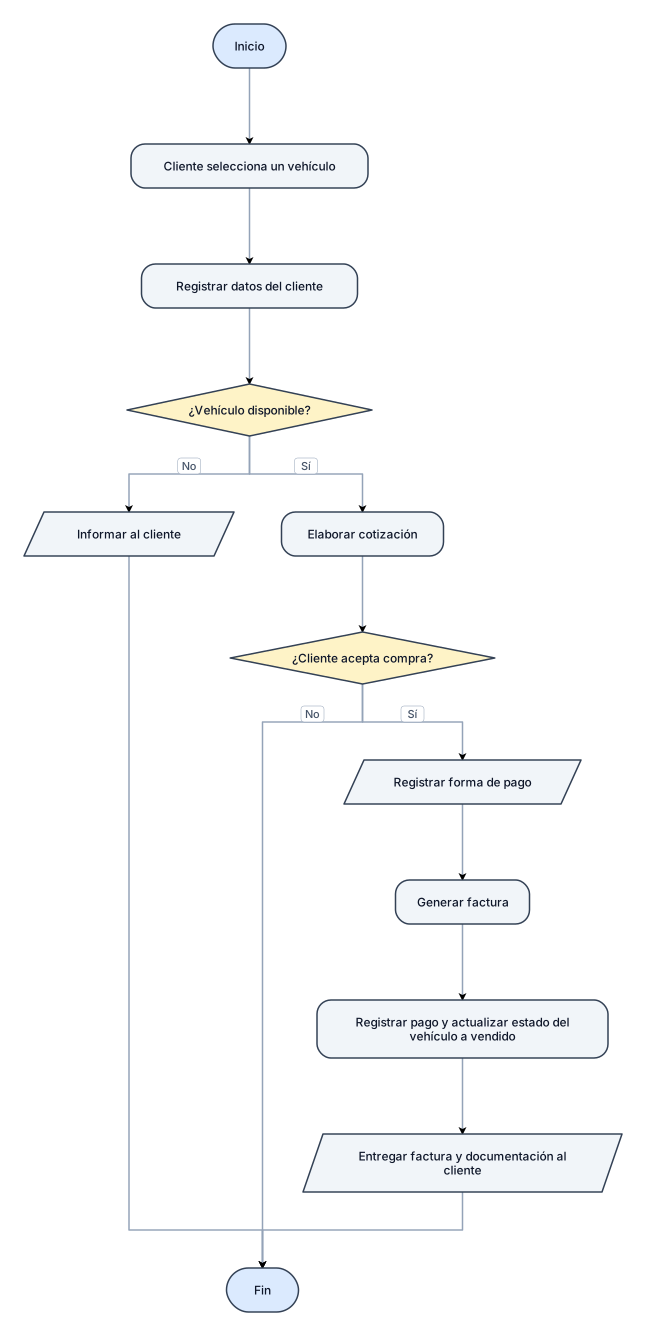
Genera un diagrama de flujo sencillo que represente el proceso de facturación de una pequeña empresa dedicada a la venta de vehículos. El proceso debe incluir las siguientes etapas: 1. Inicio. 2. El cliente selecciona un vehículo. 3. Se registran los datos del cliente. 4. Se verifica la disponibilidad del vehículo. 5. Si el vehículo no está disponible, informar al cliente y finalizar el proceso. 6. Si está disponible, elaborar la cotización. 7. El cliente acepta la compra. 8. Registrar la forma de pago. 9. Generar la factura. 10. Registrar el pago y actualizar el estado del vehículo como vendido. 11. Entregar la factura y documentación correspondiente al cliente. 12. Fin. Utiliza símbolos estándar de diagramas de flujo: * Óvalo para Inicio y Fin. * Rectángulo para procesos. * Rombo para decisiones. * Paralelogramo para entrada o salida de información. El diagrama debe ser claro, ordenado y fácil de entender, apropiado para una empresa pequeña de venta de vehículos.
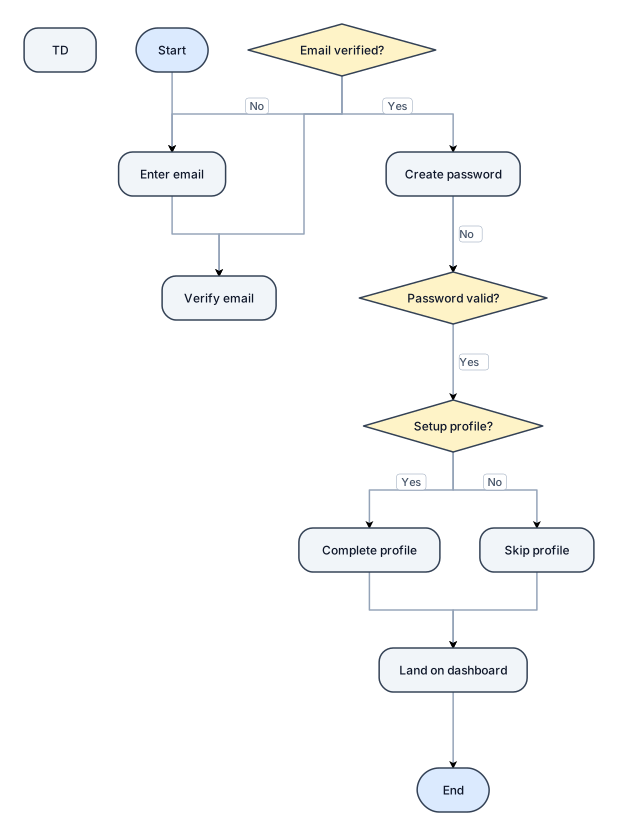
A flowchart for a user sign-up process: enter email, verify email, create password, optional profile setup, then land on the dashboard

compressed air>pressure regulator>venture meter>volve(bypass regulator>bypass pressure line)>pressure controller>venture meter>input pipe

compressed air>pressure regulator>venture meter
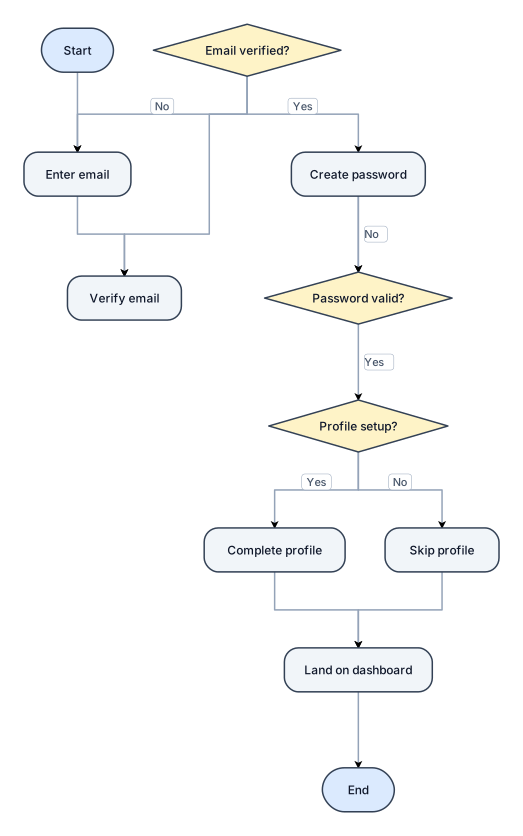
A flowchart for a user sign-up process: enter email, verify email, create password, optional profile setup, then land on the dashboard
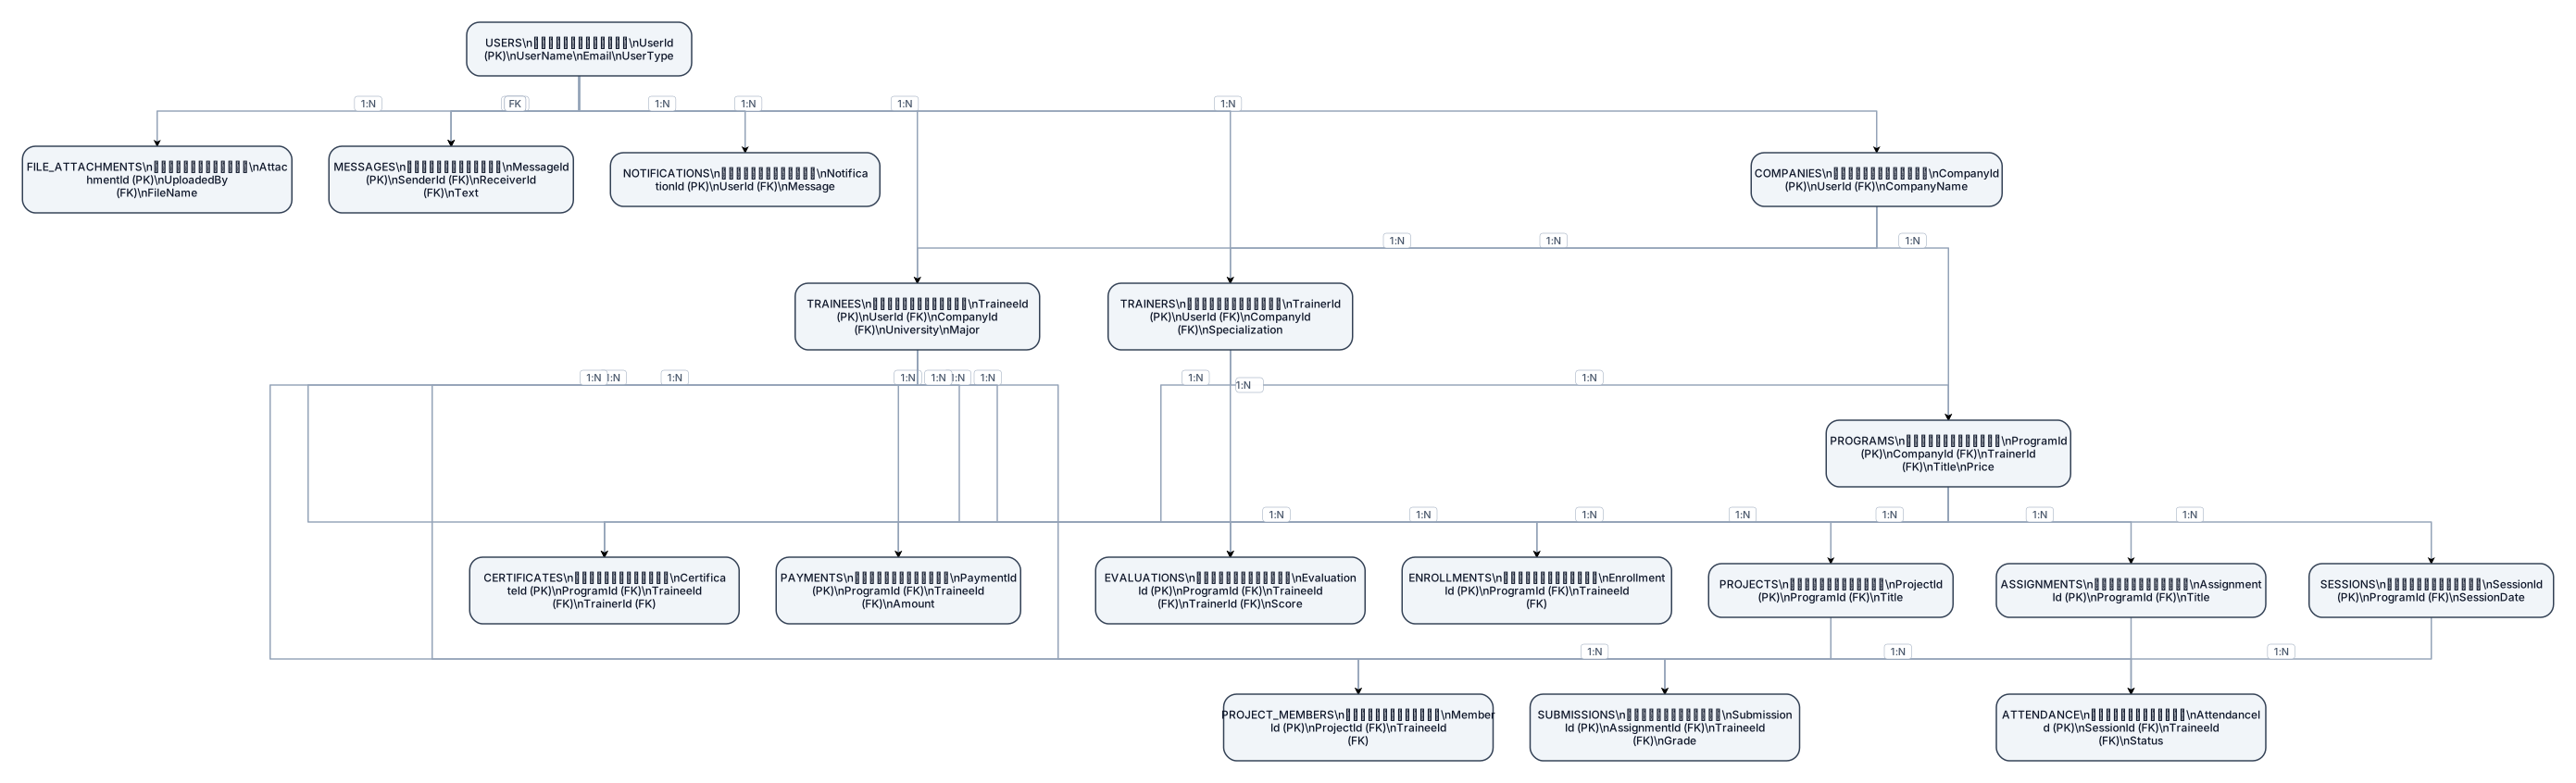
ERD for Training Management System. PK/FK included. Entities: - USERS: UserId(PK), UserName, Email, UserType - COMPANIES: CompanyId(PK), UserId(FK), CompanyName - TRAINERS: TrainerId(PK), UserId(FK), CompanyId(FK), Specialization - TRAINEES: TraineeId(PK), UserId(FK), CompanyId(FK), University, Major - PROGRAMS: ProgramId(PK), CompanyId(FK), TrainerId(FK), Title, Price - SESSIONS: SessionId(PK), ProgramId(FK), SessionDate - ATTENDANCE: AttendanceId(PK), SessionId(FK), TraineeId(FK), Status - ASSIGNMENTS: AssignmentId(PK), ProgramId(FK), Title - SUBMISSIONS: SubmissionId(PK), AssignmentId(FK), TraineeId(FK), Grade - ENROLLMENTS: EnrollmentId(PK), ProgramId(FK), TraineeId(FK) - PAYMENTS: PaymentId(PK), ProgramId(FK), TraineeId(FK), Amount - EVALUATIONS: EvaluationId(PK), ProgramId(FK), TraineeId(FK), TrainerId(FK), Score - CERTIFICATES: CertificateId(PK), ProgramId(FK), TraineeId(FK), TrainerId(FK) - PROJECTS: ProjectId(PK), ProgramId(FK), Title - PROJECT_MEMBERS: MemberId(PK), ProjectId(FK), TraineeId(FK) - MESSAGES: MessageId(PK), SenderId(FK), ReceiverId(FK), Text - NOTIFICATIONS: NotificationId(PK), UserId(FK), Message - FILE_ATTACHMENTS: AttachmentId(PK), UploadedBy(FK), FileName Relations: Users link to companies, trainers, trainees. Programs have sessions, assignments, enrollments, payments, evaluations, certificates, projects. Trainees interact with attendance, submissions, projects, messages.
Focused examples and prompt ideas
Start with the complete visitor wall above, then use these focused collections when you want a narrower subject and more prompt context.
The first curated collection is being prepared.