START, Sales Representative Visits Customer as per Assigned Route, obtain Customer Requirement, Pre-Order Obtained, Pre-Order Booked in MIRA through HHD, (Location-Based Control), Outside Customer, Boundary?, No │ Yes, Obtian Supervisor Approval, Obtain Area Manager Approval, Demand Consolidated by Route & Item, Forecast Department Reviews Demand vs. Previous Demand, IF Significant Demand or Any Variance Identified ?, Obtain Area Manager Confirmation, Demadn Finalized & Segregated into In-House / Trading.
NODE ARCHIVE · REAL DIAGRAM BRIEFS
Diagram Examples from Real Visitor Prompts
Browse eligible diagrams shared by FreeDiagram visitors, inspect the exact prompts, and build your own version.
Browse 1008 real creationsCOMMUNITY OUTPUTS · EXACT PROMPTS
Main diagram studio
Showing 217–240 of 601. No stock examples or system defaults. Choose a tool, study a real result, then reopen its prompt as your starting point.
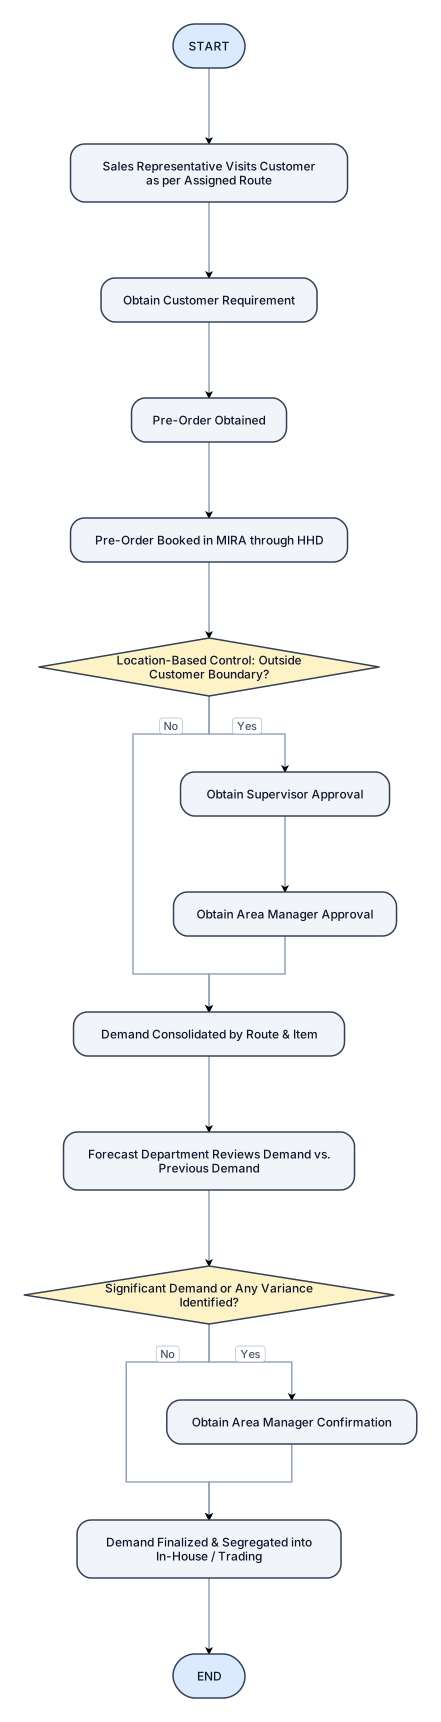
START, Sales Representative Visits Customer as per Assigned Route, obtain Customer Requirement, Pre-Order Obtained, Pre-Order Booked in MIRA through HHD, (Location-Based Control), Outside Customer, Boundary?, No │ Yes, Obtian Supervisor Approval, Obtain Area Manager Approval, Demand Consolidated by Route & Item, Forecast Department Reviews Demand vs. Previous Demand, IF Significant Demand or Any Variance Identified ?, Obtain Area Manager Confirmation, Demadn Finalized & Segregated into In-House / Trading.
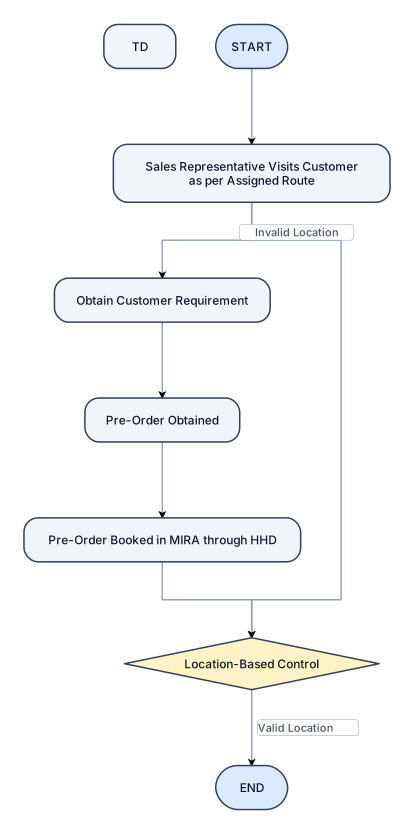
START, Sales Representative Visits Customer as per Assigned Route, obtain Customer Requirement, Pre-Order Obtained, Pre-Order Booked in MIRA through HHD, (Location-Based Control).
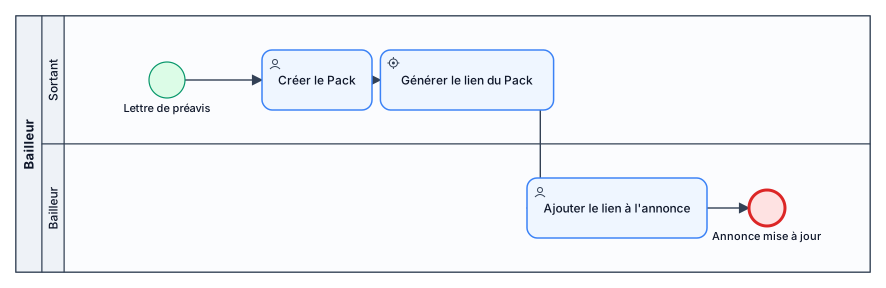
Lettre de préavis -> Le sortant créer le Pack ->génération du lien du Pack à ajouter à l'annonce par le bailleur
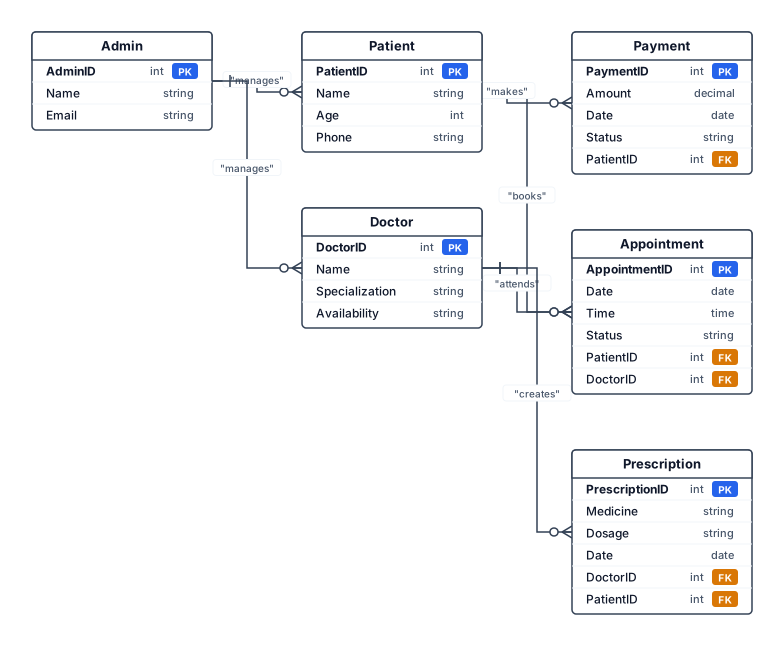
Patient – PatientID, Name, Age, Phone Doctor – DoctorID, Name, Specialization, Availability Appointment – AppointmentID, Date, Time, Status Prescription – PrescriptionID, Medicine, Dosage, Date Payment – PaymentID, Amount, Date, Status Admin – AdminID, Name, Email Patient books Appointment. Doctor attends Appointment. Doctor creates Prescription. Patient makes Payment. Admin manages Patients and Doctors.
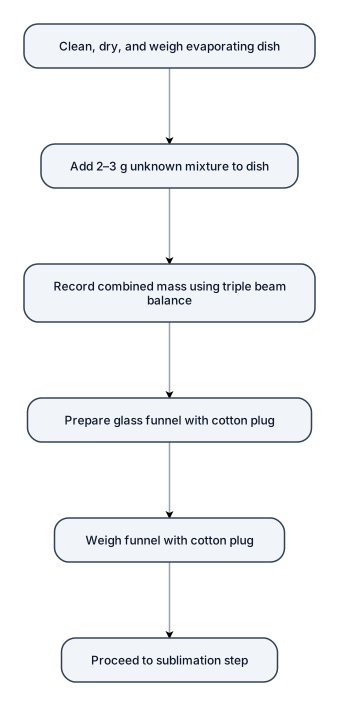
The first evaporating dish was cleaned, dried, and weighed. Approximately 2–3 g of the unknown mixture was placed into the dish, and the combined mass was recorded using triple beam balance. A glass funnel with a cotton plug was then prepared and weighed for the sublimation step.
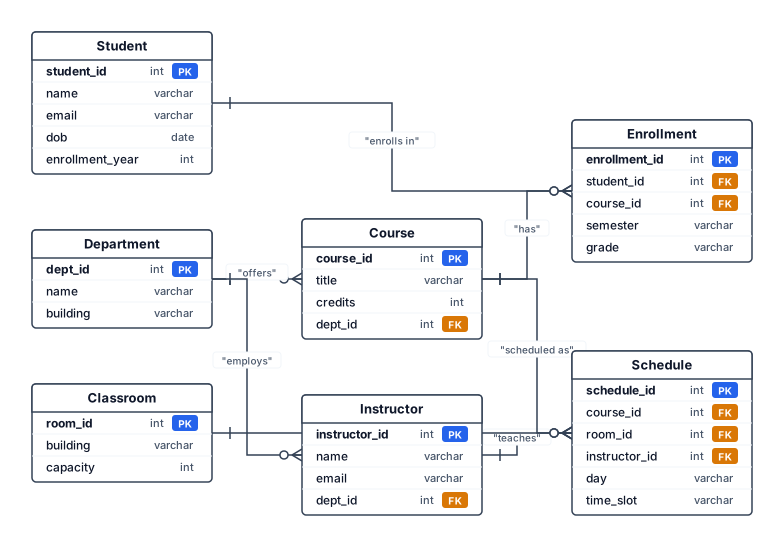
Er diagram for college management system
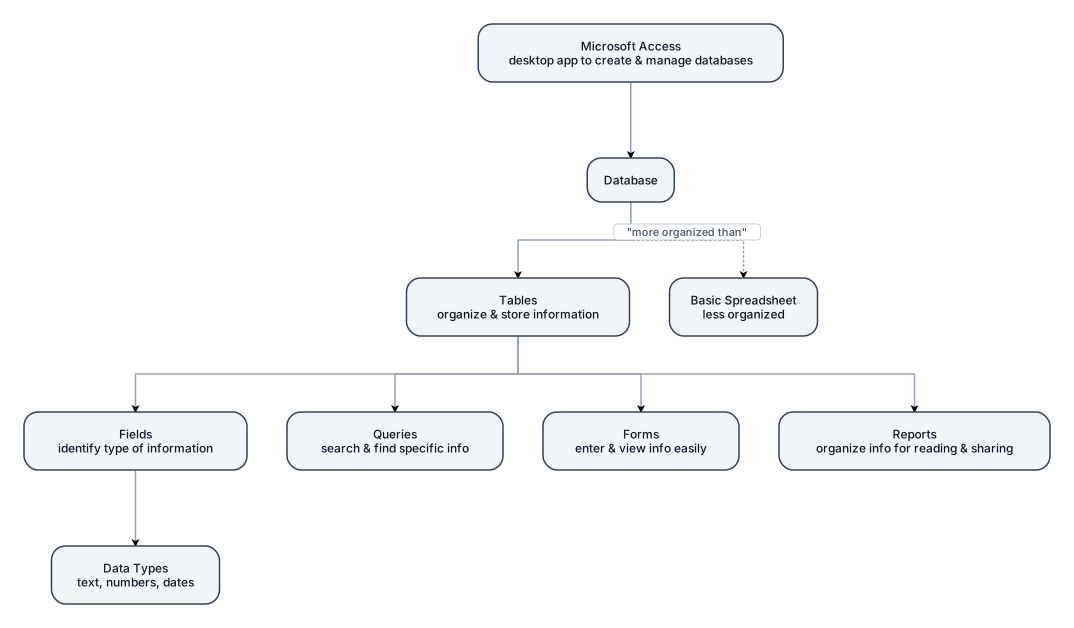
a flowchart: prisma flow with short explanations using this info: A database is made up of tables that are used to organize and store information. Microsoft Access is a desktop application used to create and manage databases. In Access, tables contain fields that identify the type of information being stored, while data types tell Access what kind of information can be entered, such as text, numbers, or dates. Queries are used to search for and find specific information in a database. Forms make it easier to enter and view information, while reports organize the information into a format that is easy to read and share. Overall, Microsoft Access can be used to store, manage, and search through large amounts of information in a more organized way than a basic spreadsheet.
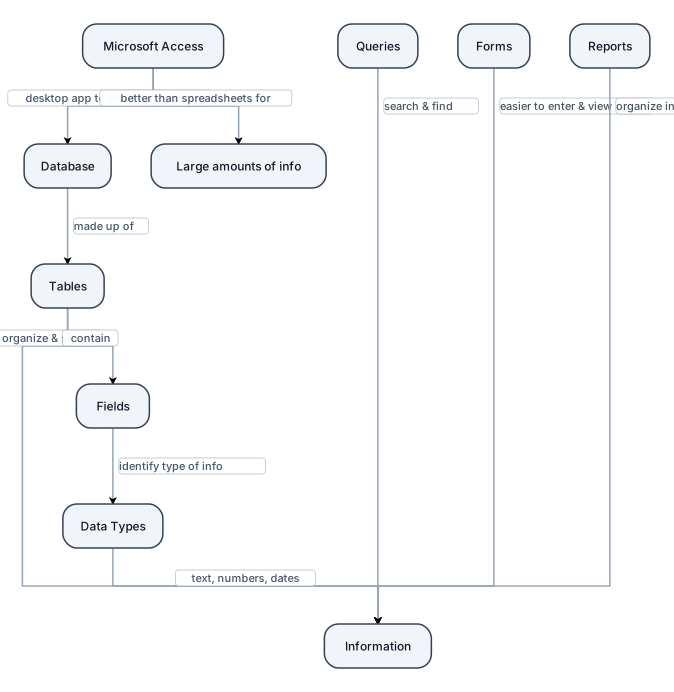
flowchart with short blurbs and explanations using this info: A database is made up of tables that are used to organize and store information. Microsoft Access is a desktop application used to create and manage databases. In Access, tables contain fields that identify the type of information being stored, while data types tell Access what kind of information can be entered, such as text, numbers, or dates. Queries are used to search for and find specific information in a database. Forms make it easier to enter and view information, while reports organize the information into a format that is easy to read and share. Overall, Microsoft Access can be used to store, manage, and search through large amounts of information in a more organized way than a basic spreadsheet.
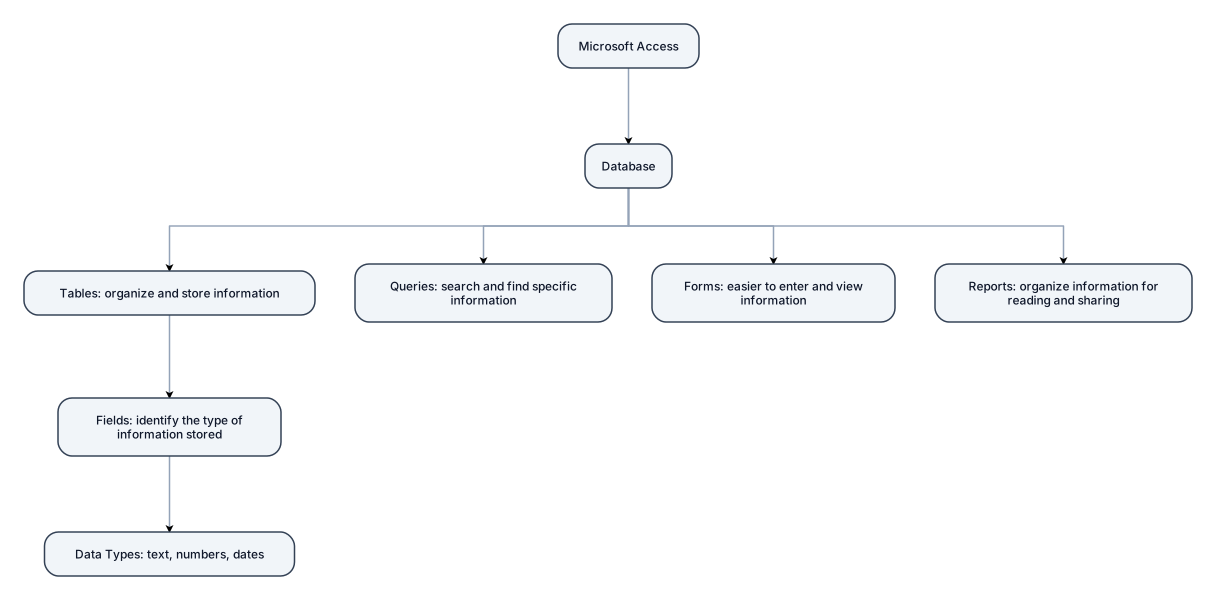
flowchart with short blurbs using this info: A database is made up of tables that are used to organize and store information. Microsoft Access is a desktop application used to create and manage databases. In Access, tables contain fields that identify the type of information being stored, while data types tell Access what kind of information can be entered, such as text, numbers, or dates. Queries are used to search for and find specific information in a database. Forms make it easier to enter and view information, while reports organize the information into a format that is easy to read and share. Overall, Microsoft Access can be used to store, manage, and search through large amounts of information in a more organized way than a basic spreadsheet.
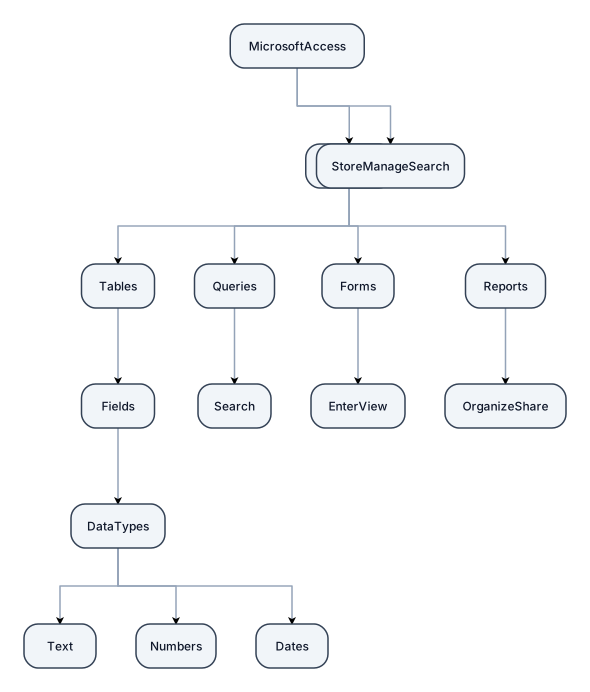
flowchart using this info: A database is made up of tables that are used to organize and store information. Microsoft Access is a desktop application used to create and manage databases. In Access, tables contain fields that identify the type of information being stored, while data types tell Access what kind of information can be entered, such as text, numbers, or dates. Queries are used to search for and find specific information in a database. Forms make it easier to enter and view information, while reports organize the information into a format that is easy to read and share. Overall, Microsoft Access can be used to store, manage, and search through large amounts of information in a more organized way than a basic spreadsheet.
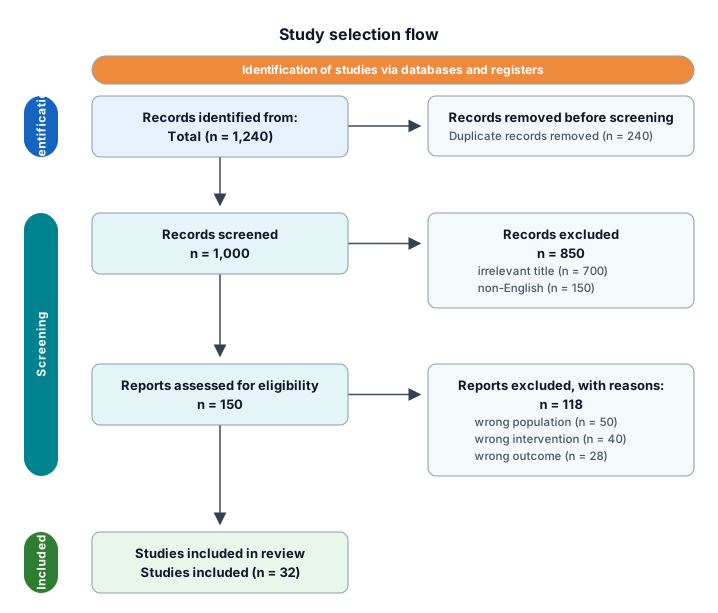
A PRISMA study-selection flow from 1,240 identified records through deduplication, screening, eligibility, and 32 included studies
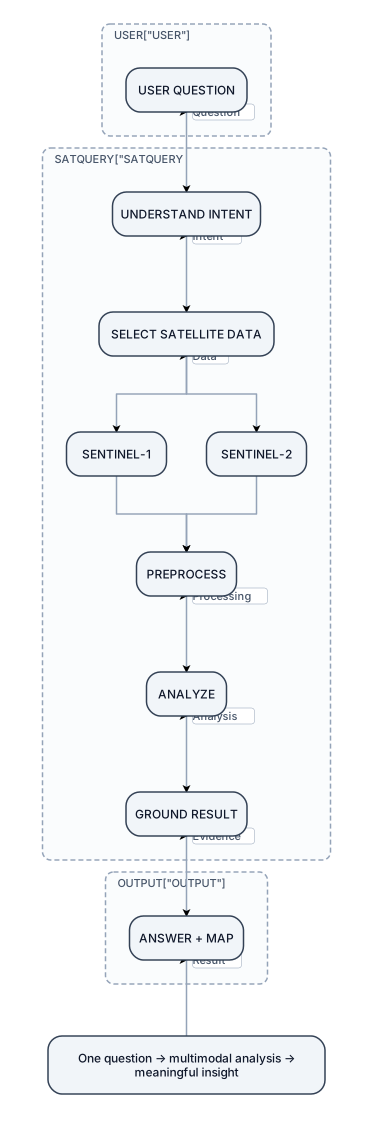
This should become your "What happens when I use SatQuery?" slide. Make the entire slide one large workflow USER QUESTION ↓ UNDERSTAND INTENT ↓ SELECT SATELLITE DATA ↓ SENTINEL-1 + SENTINEL-2 ↓ PREPROCESS ↓ ANALYZE ↓ GROUND RESULT ↓ ANSWER + MAP Don't explain each box with paragraphs. Instead, put tiny labels/icons underneath: Question ↓ Intent ↓ Data ↓ Processing ↓ Analysis ↓ Evidence ↓ Result At the bottom: A single sentence: One question → multimodal analysis → meaningful insight This is already aligned with the SatQuery positioning in your deck. make it as human as possible. It shouldn't look AI generated. I want a very structured architectural diagram not a basic flow chart.
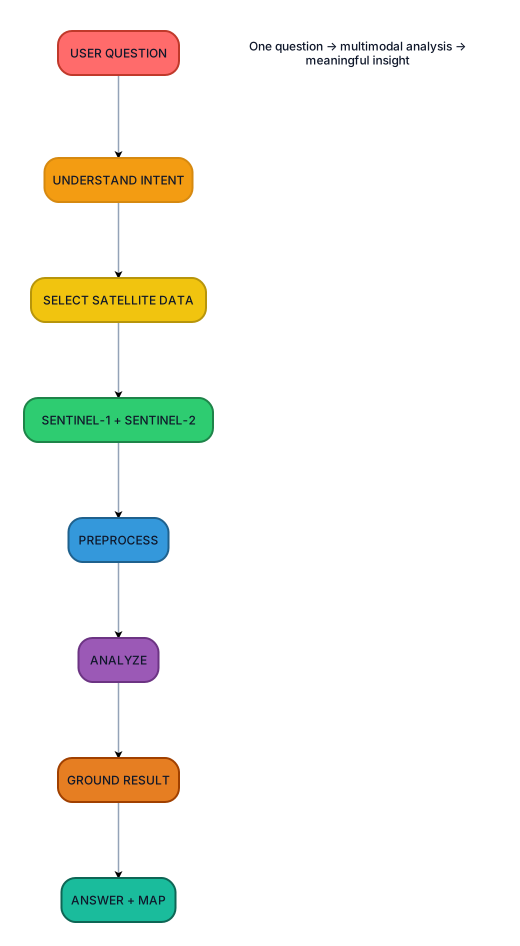
This should become your "What happens when I use SatQuery?" slide. Make the entire slide one large workflow USER QUESTION ↓ UNDERSTAND INTENT ↓ SELECT SATELLITE DATA ↓ SENTINEL-1 + SENTINEL-2 ↓ PREPROCESS ↓ ANALYZE ↓ GROUND RESULT ↓ ANSWER + MAP Don't explain each box with paragraphs. Instead, put tiny labels/icons underneath: Question ↓ Intent ↓ Data ↓ Processing ↓ Analysis ↓ Evidence ↓ Result At the bottom: A single sentence: One question → multimodal analysis → meaningful insight This is already aligned with the SatQuery positioning in your deck. make it as human as possible. It shouldn't look AI generated

Create a nursing concept map showing dehydration → decreased circulating volume → hypovolemia → decreased tissue perfusion → complications.
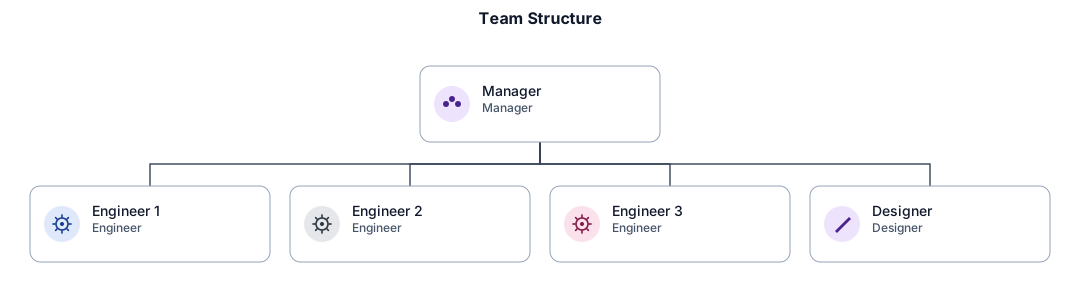
قصة اصحاب السبت An org chart for a small team with a manager, three engineers, and a designer
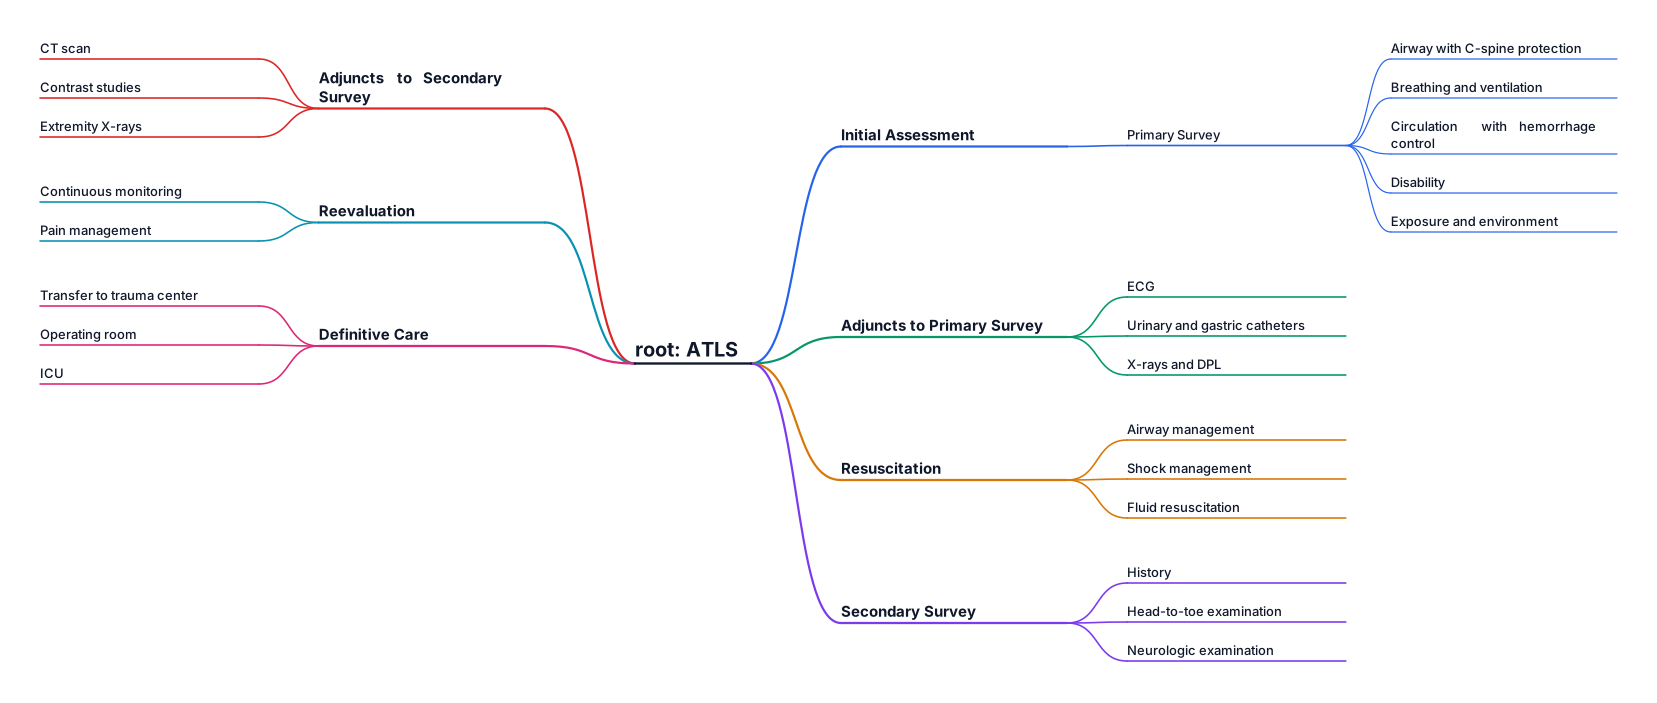
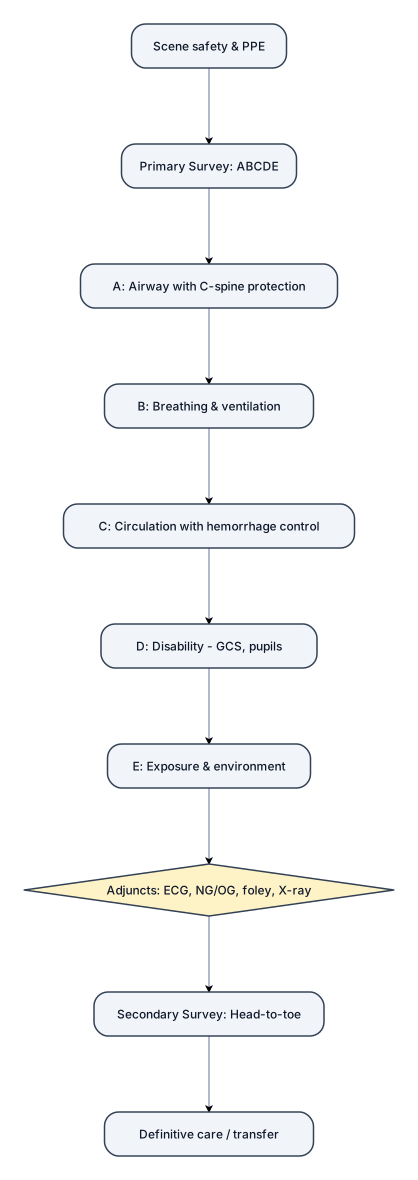
A mind map for Atls
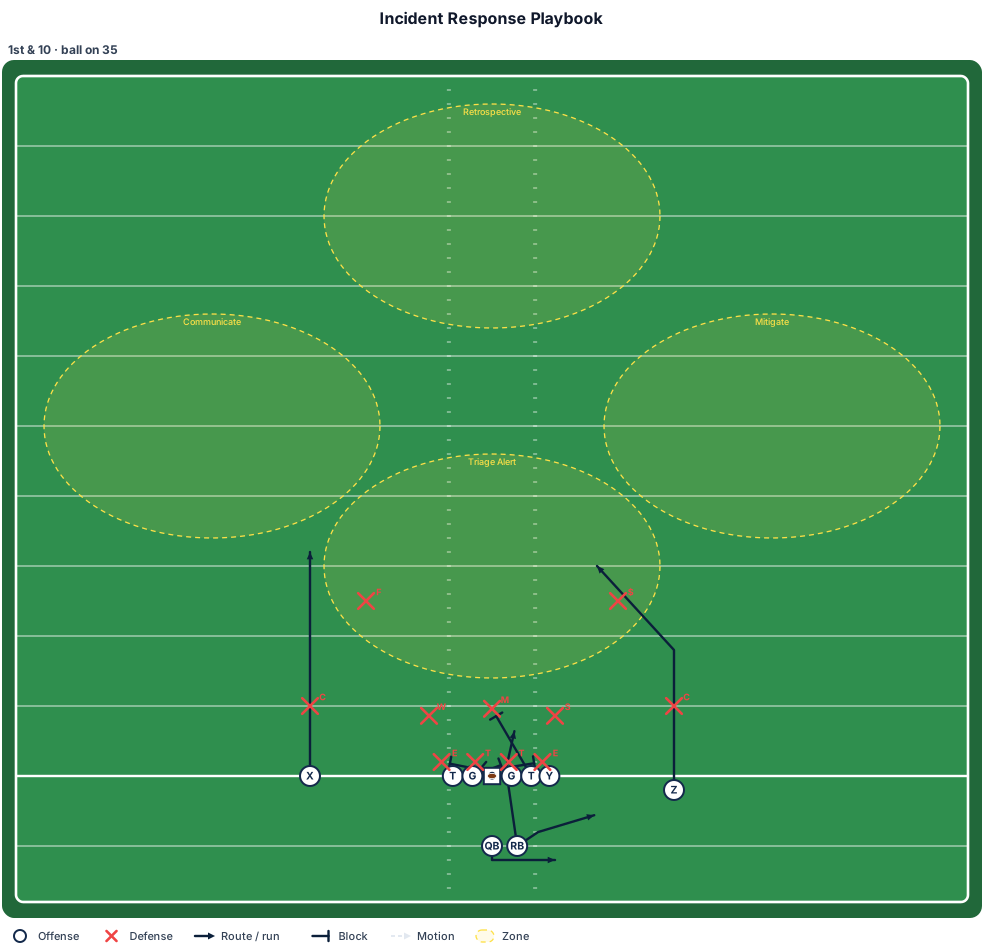
A customer incident response playbook from alert triage through mitigation, communication, and retrospective
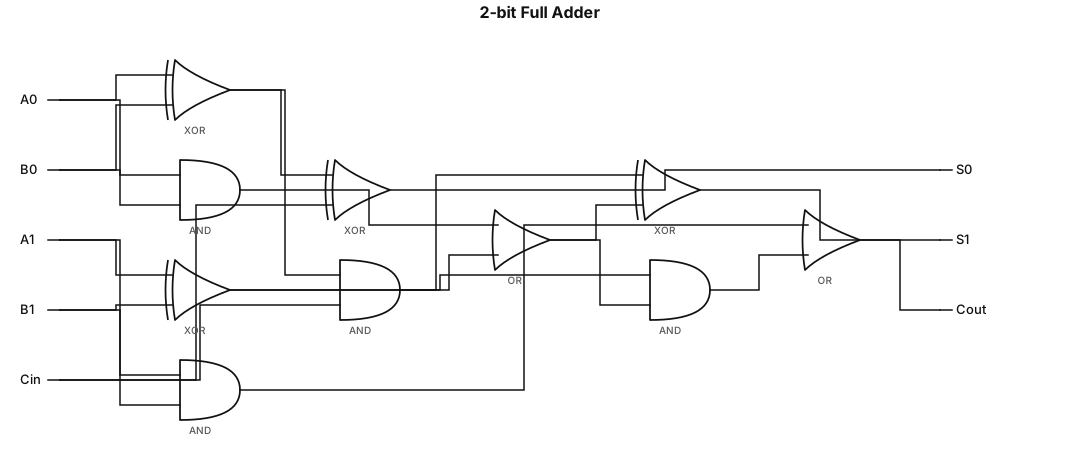
A logic gate circuit for a 2-bit full adder using AND, OR, and XOR gates
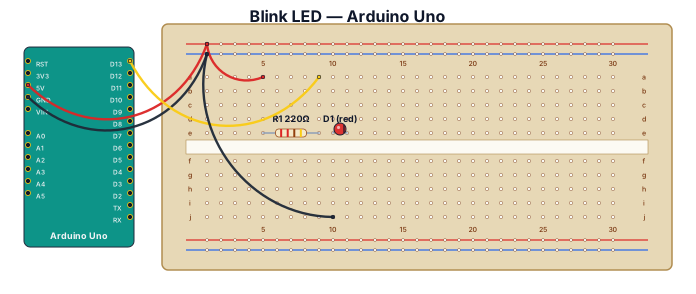
A breadboard wiring diagram for an Arduino blinking an LED through a 220-ohm resistor
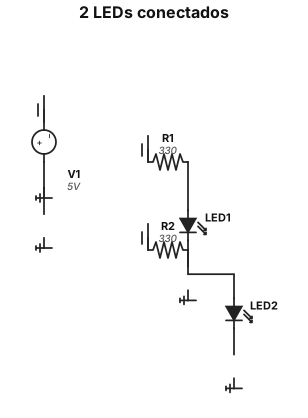
2 Diodos leds conectados
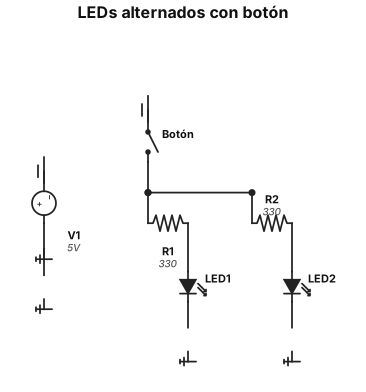
2 Diodos leds conectados a un boton que apaga uno y enciende el otro

A circuit schematic of a non-inverting op-amp amplifier with a gain of 10
Focused examples and prompt ideas
Start with the complete visitor wall above, then use these focused collections when you want a narrower subject and more prompt context.
The first curated collection is being prepared.