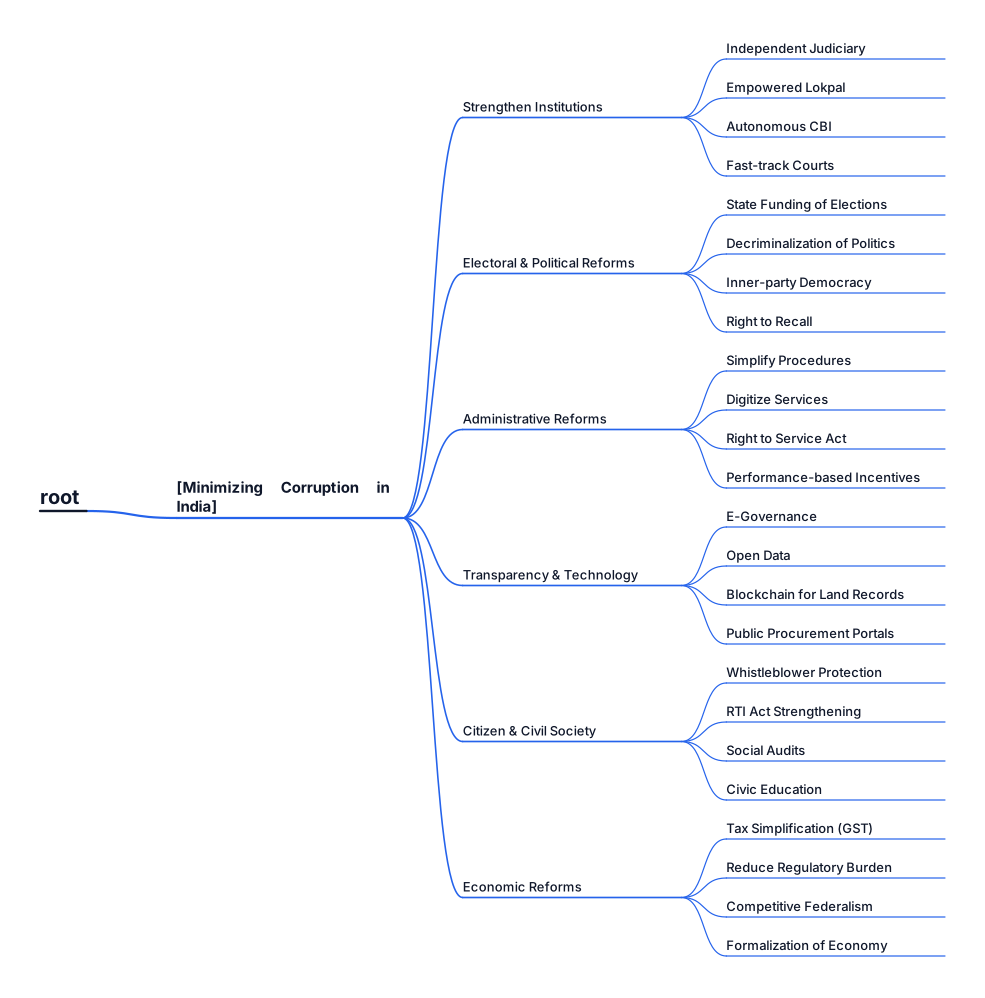
How to minimize corruption in india
NODE ARCHIVE · REAL DIAGRAM BRIEFS
Diagram Examples from Real Visitor Prompts
Browse eligible diagrams shared by FreeDiagram visitors, inspect the exact prompts, and build your own version.
Browse 3345 real creationsCOMMUNITY OUTPUTS · EXACT PROMPTS
All visitor creations
Showing 3289–3312 of 3345. No stock examples or system defaults. Choose a tool, study a real result, then reopen its prompt as your starting point.
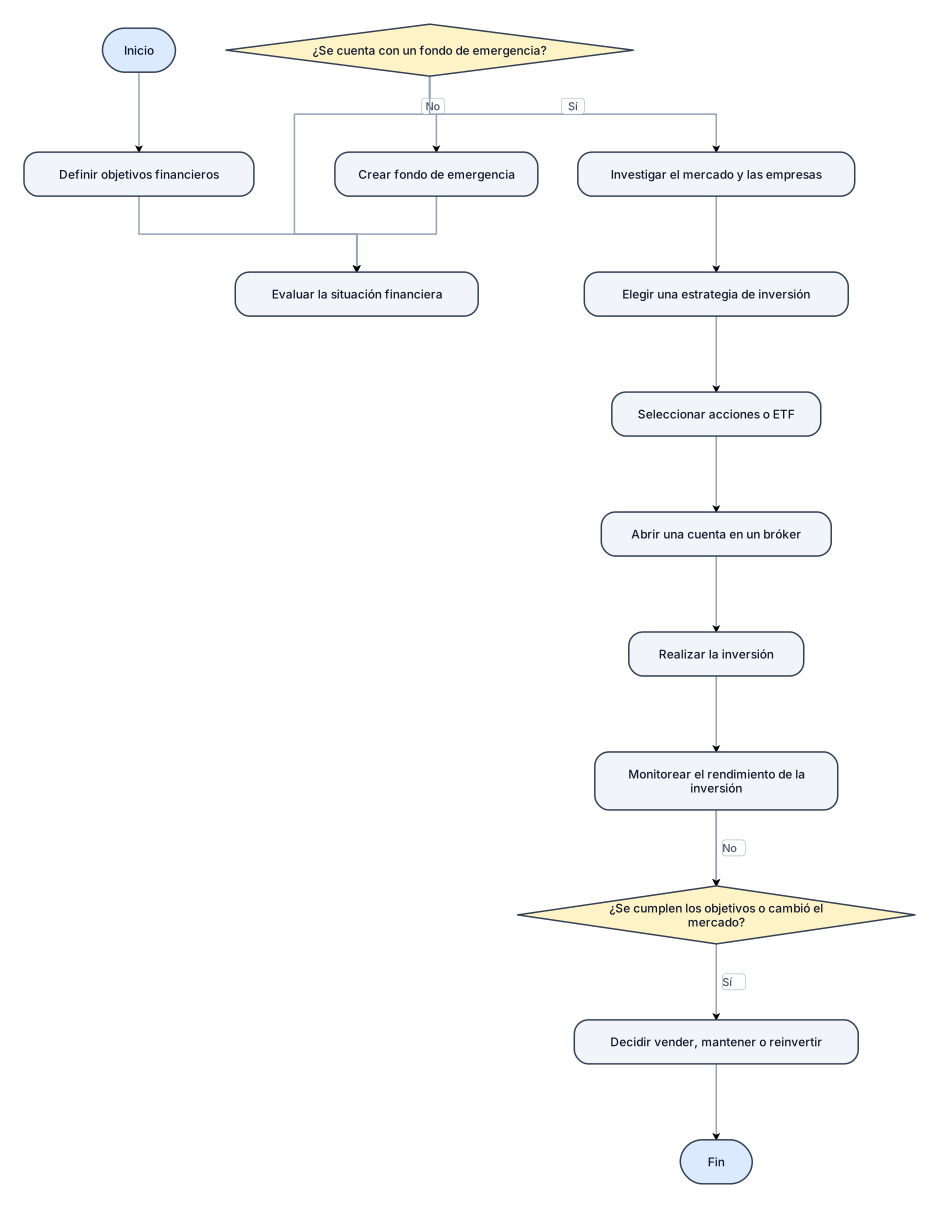
Crea un diagrama de flujo sobre el proceso de inversión en la bolsa de valores. El flujo debe comenzar con "Inicio", seguido de "Definir objetivos financieros". Luego "Evaluar la situación financiera". Después un punto de decisión: "¿Se cuenta con un fondo de emergencia?". Si la respuesta es "No", ir a "Crear fondo de emergencia" y volver a "Evaluar la situación financiera". Si la respuesta es "Sí", continuar con "Investigar el mercado y las empresas". Luego "Elegir una estrategia de inversión (largo plazo, dividendos o crecimiento)". Después "Seleccionar acciones o ETF". Luego "Abrir una cuenta en un bróker". Después "Realizar la inversión". Continuar con "Monitorear el rendimiento de la inversión". Luego un punto de decisión: "¿Se cumplen los objetivos o cambió el mercado?". Si la respuesta es "No", regresar a "Monitorear el rendimiento". Si la respuesta es "Sí", ir a "Decidir vender, mantener o reinvertir". Finalmente terminar en "Fin". Utiliza símbolos estándar de diagramas de flujo (óvalos para inicio y fin, rectángulos para procesos y rombos para decisiones). La estructura sería algo así: Inicio │ Definir objetivos financieros │ Evaluar situación financiera │ ¿Tiene fondo de emergencia? ┌──┴──┐ No Sí │ │ Crear Investigar mercado fondo │ │ Elegir estrategia └──────► │ Seleccionar acciones o ETF │ Abrir cuenta en bróker │ Realizar inversión │ Monitorear rendimiento │ ¿Se cumplen los objetivos o cambió el mercado? ┌──────┴──────┐ No Sí │ │ └────────► Decidir vender, mantener o reinvertir │ Fin
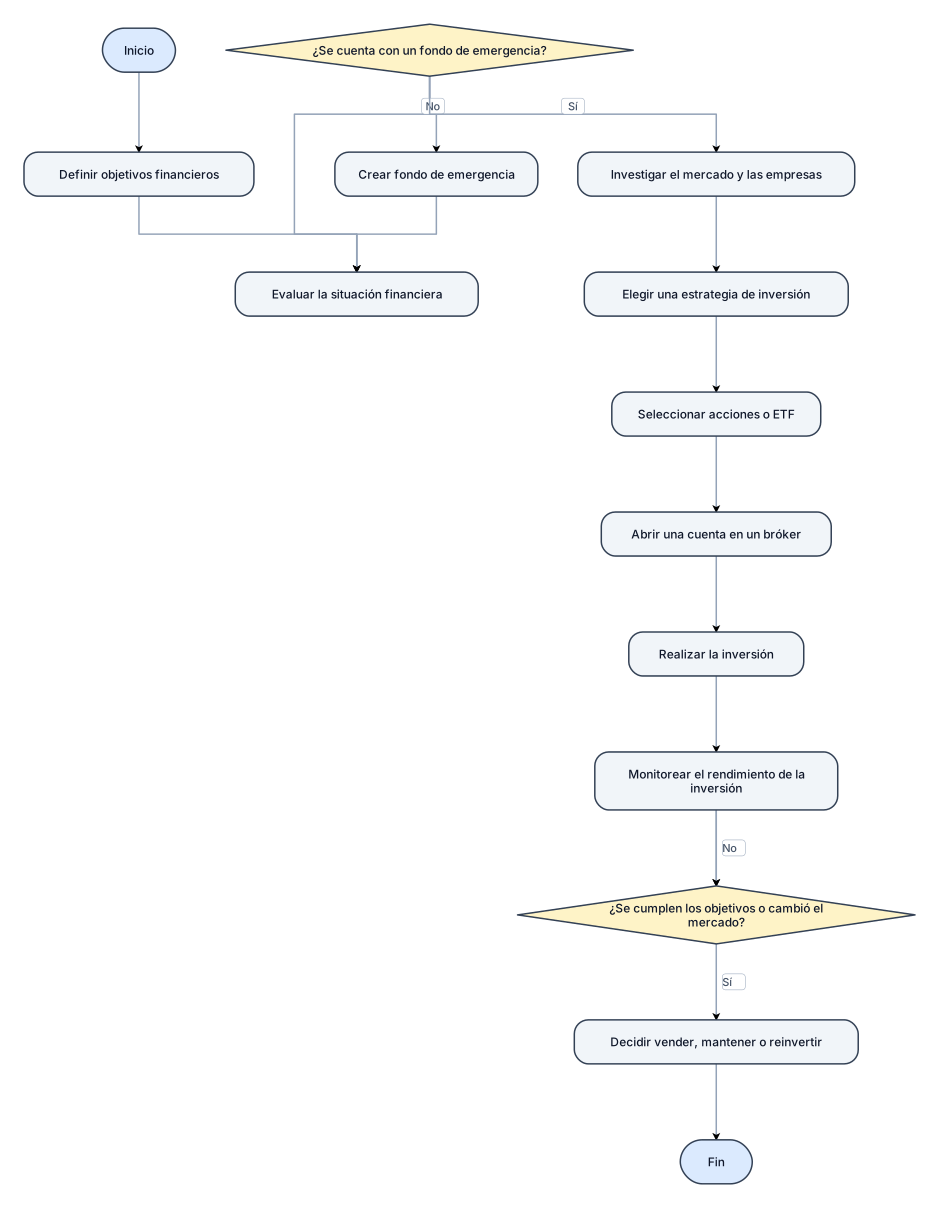
Crea un diagrama de flujo sobre el proceso de inversión en la bolsa de valores. El flujo debe comenzar con "Inicio", seguido de "Definir objetivos financieros". Luego "Evaluar la situación financiera". Después un punto de decisión: "¿Se cuenta con un fondo de emergencia?". Si la respuesta es "No", ir a "Crear fondo de emergencia" y volver a "Evaluar la situación financiera". Si la respuesta es "Sí", continuar con "Investigar el mercado y las empresas". Luego "Elegir una estrategia de inversión (largo plazo, dividendos o crecimiento)". Después "Seleccionar acciones o ETF". Luego "Abrir una cuenta en un bróker". Después "Realizar la inversión". Continuar con "Monitorear el rendimiento de la inversión". Luego un punto de decisión: "¿Se cumplen los objetivos o cambió el mercado?". Si la respuesta es "No", regresar a "Monitorear el rendimiento". Si la respuesta es "Sí", ir a "Decidir vender, mantener o reinvertir". Finalmente terminar en "Fin". Utiliza símbolos estándar de diagramas de flujo (óvalos para inicio y fin, rectángulos para procesos y rombos para decisiones).
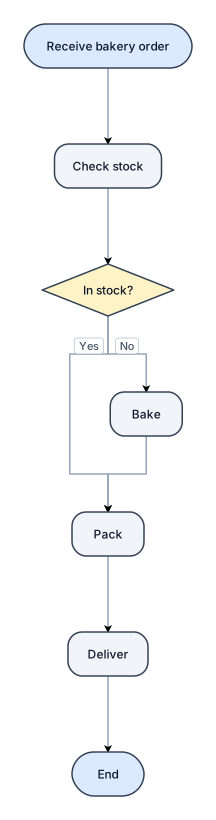
A simple flowchart: receive bakery order, check stock, bake if needed, pack, deliver
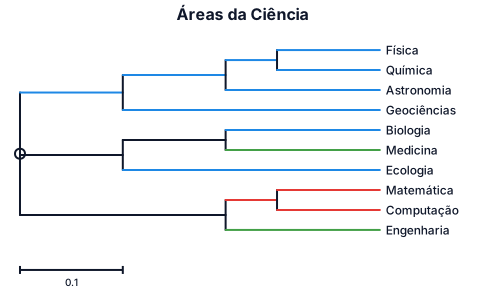
todas as areas da ciencia
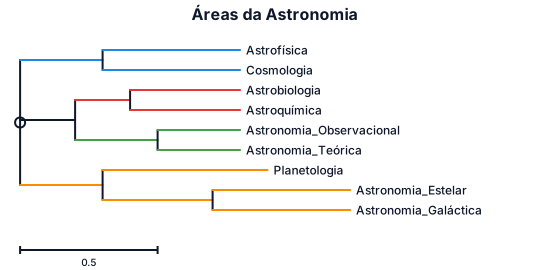
quero todas as areas das astronomia
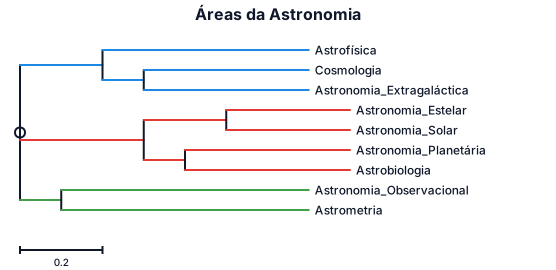
todas as areas da astronomia
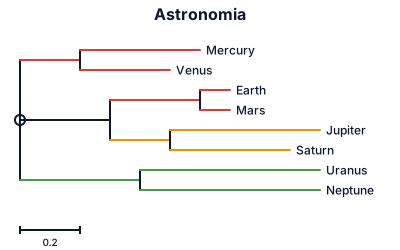
astronomia
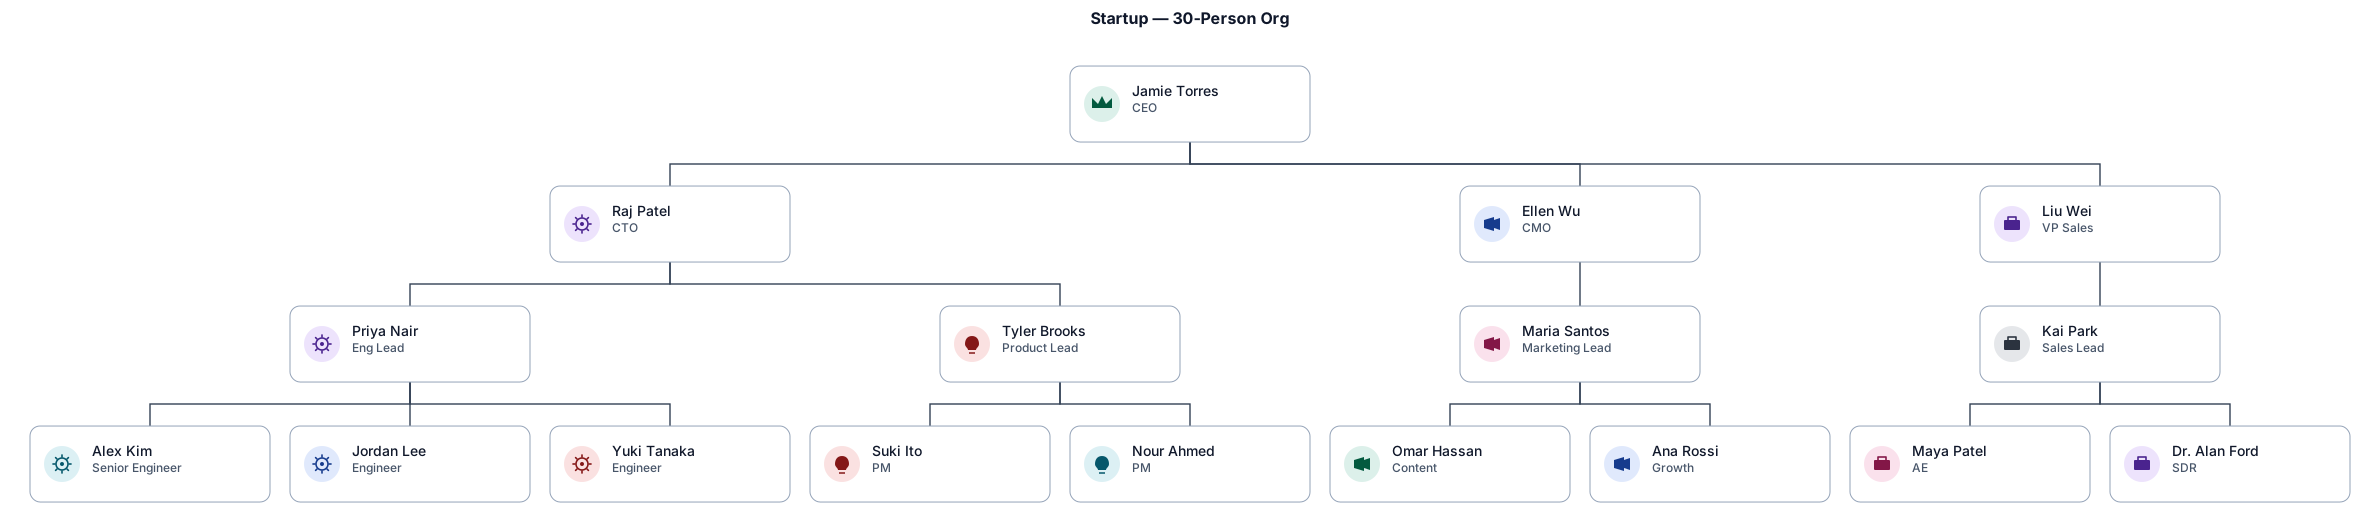
An org chart for a 30-person startup with a CEO, CTO, CMO, and VP of Sales at the top — then engineering, product, marketing, and sales teams below with their leads
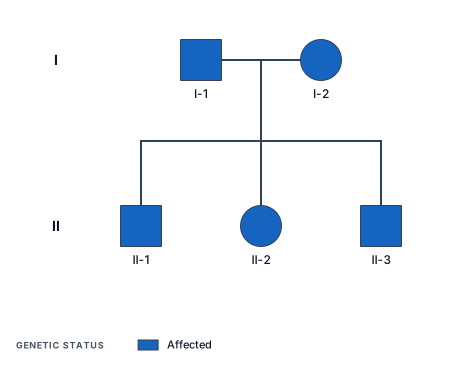
An X-linked recessive pedigree for a black skin allele showing an affected father, and an affected mother carrying a white-skin, X-linked allele, with three offspring
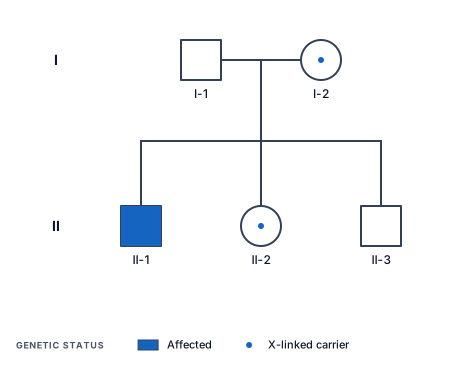
An X-linked recessive pedigree for a black skin allele showing an unaffected father, and an affected carrying a white-skin, X-linked allele, with three offspring
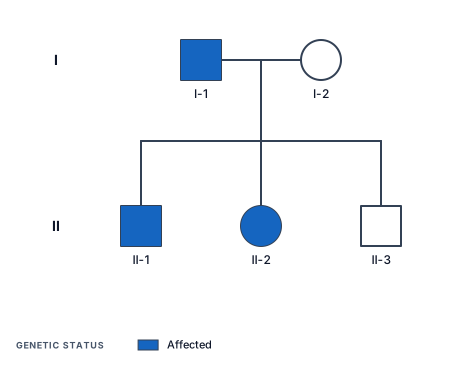
Two organisms (one black, one white) producing three offspring. The black organism is physically stronger and adapted to rough life, while the white organisms' species is accustomed to less challenging environments. Please generate a chart representing the colour of the offspring
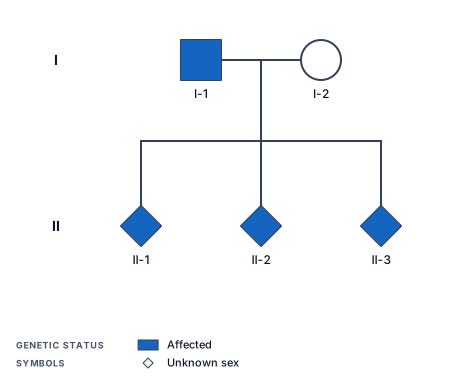
Two organisms (one black, one white) producing three offspring. The black organism is the last of its kind, while the white organism is still a present species. Please generate a realistic chart of the colour of the offspring
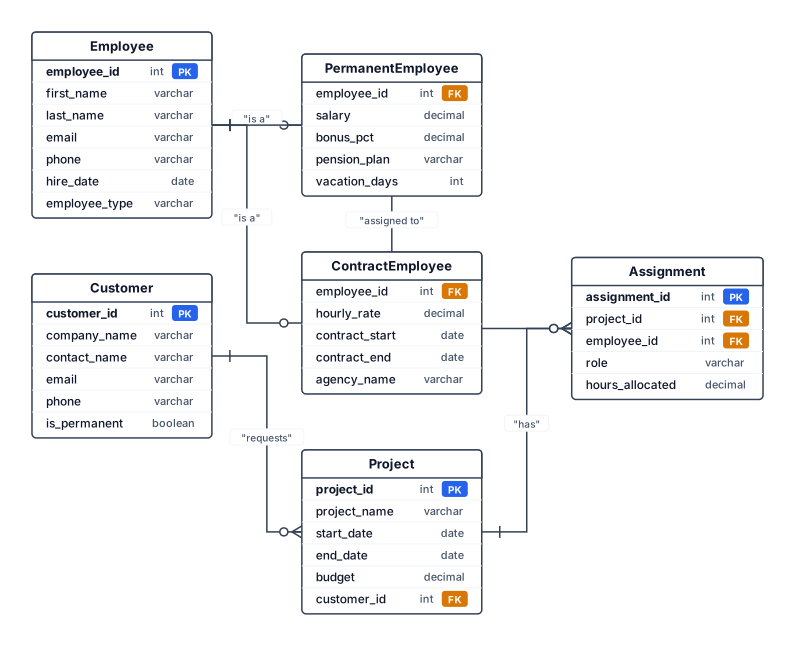
er for the employee manegement syteam and that the permanet costemer and the contact based employe more entty andd inthat
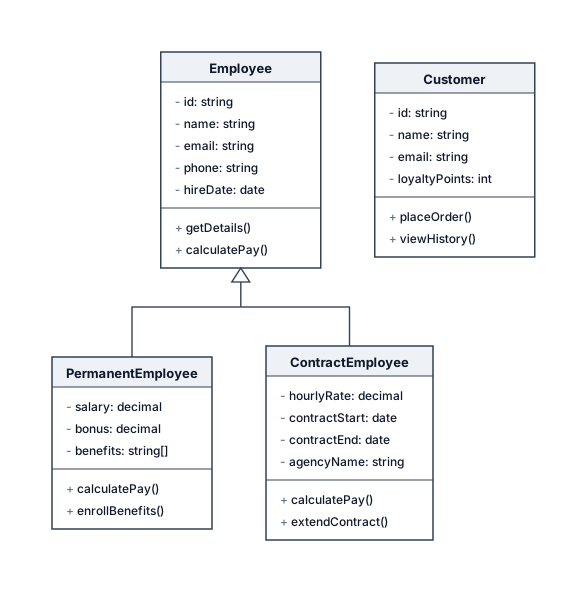
er for the employee manegement syteam and that the permanet costemer and the contact based employe
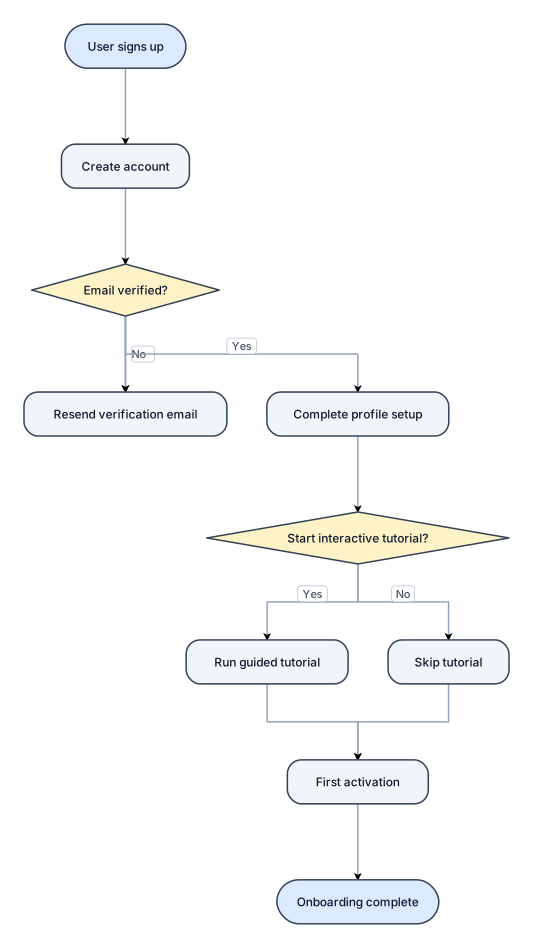
A flowchart of a new-user onboarding flow from signup to first activation, with a verification branch
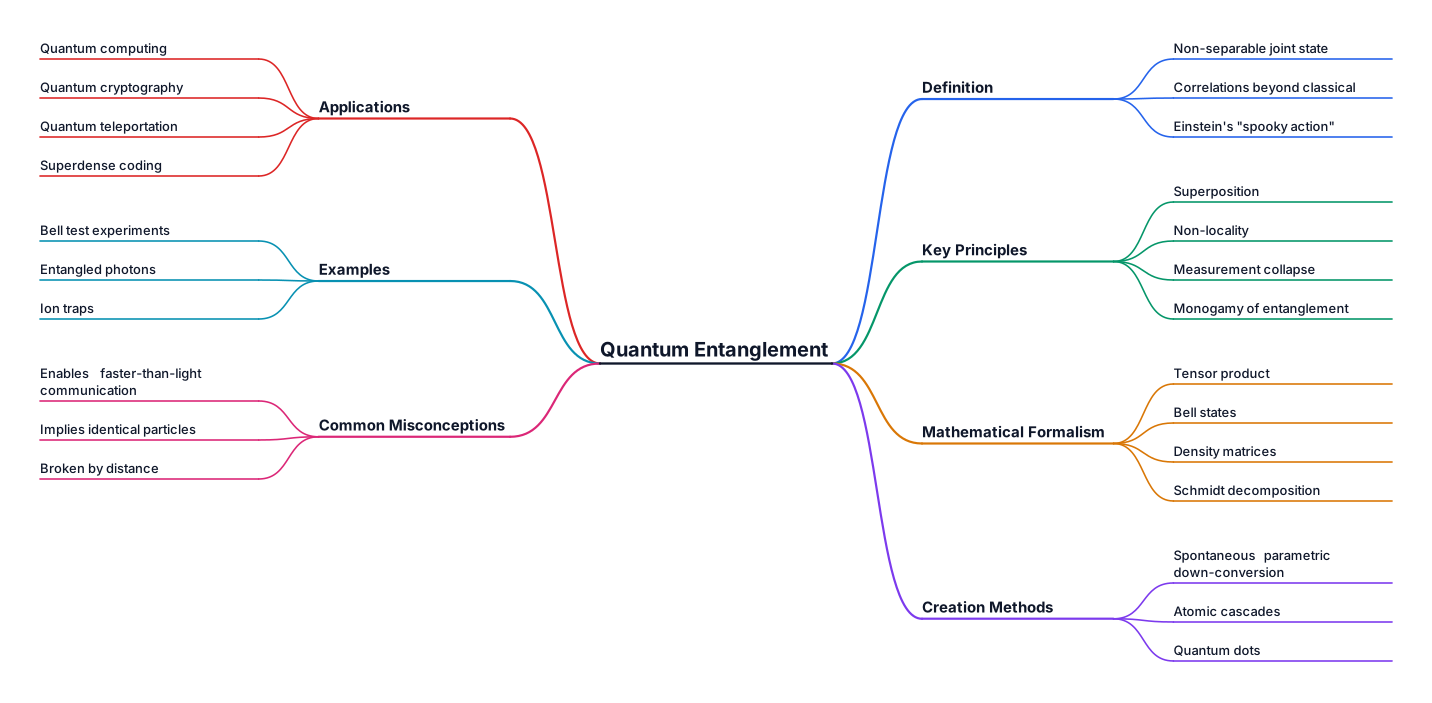
I want to learn about "quantum entnglement". Create a clear hierarchical mind map for learning this concept. Put "quantum entnglement" at the center, then use 5 to 7 meaningful main branches with 2 to 4 concise subtopics each. Label causal, sequential, or contrasting relationships where that adds meaning. Include one branch for examples and one for common misconceptions. Use short node labels rather than paragraphs. If a visual map cannot be generated directly, return the same structure as an editable indented outline.
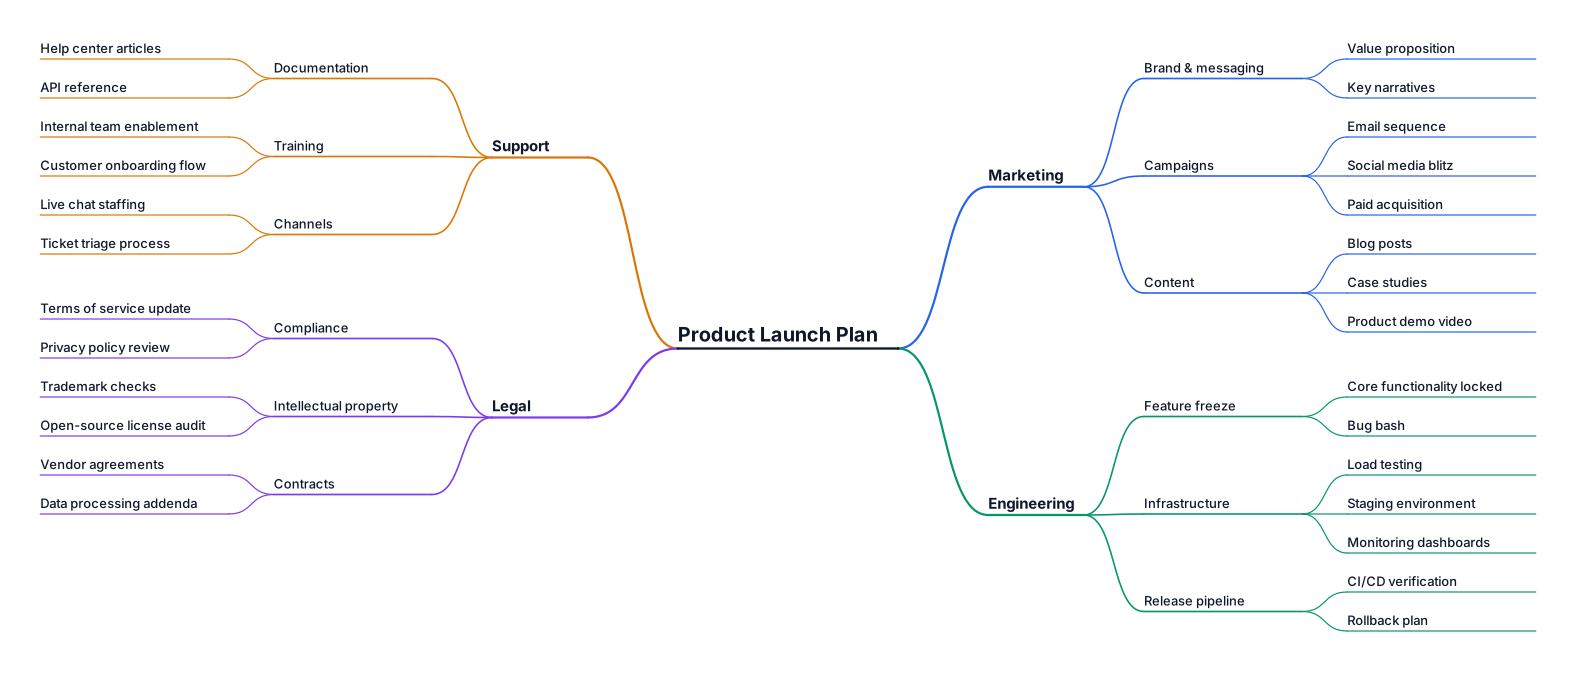
A mind map for planning a product launch, branching into marketing, engineering, support, and legal
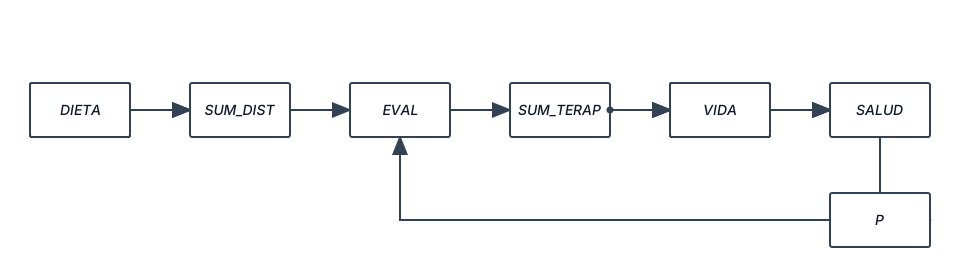
me lo hces diagrama de bloque el tema es medicina natural detallado y con conceptos
me lo hces diagrama de bloque el tema es medicina natural
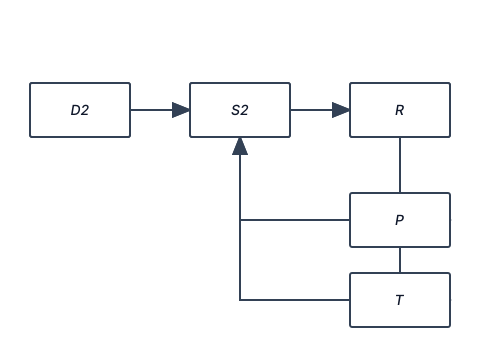
me lo hces diagrama de bloque que se trate de medicina natural
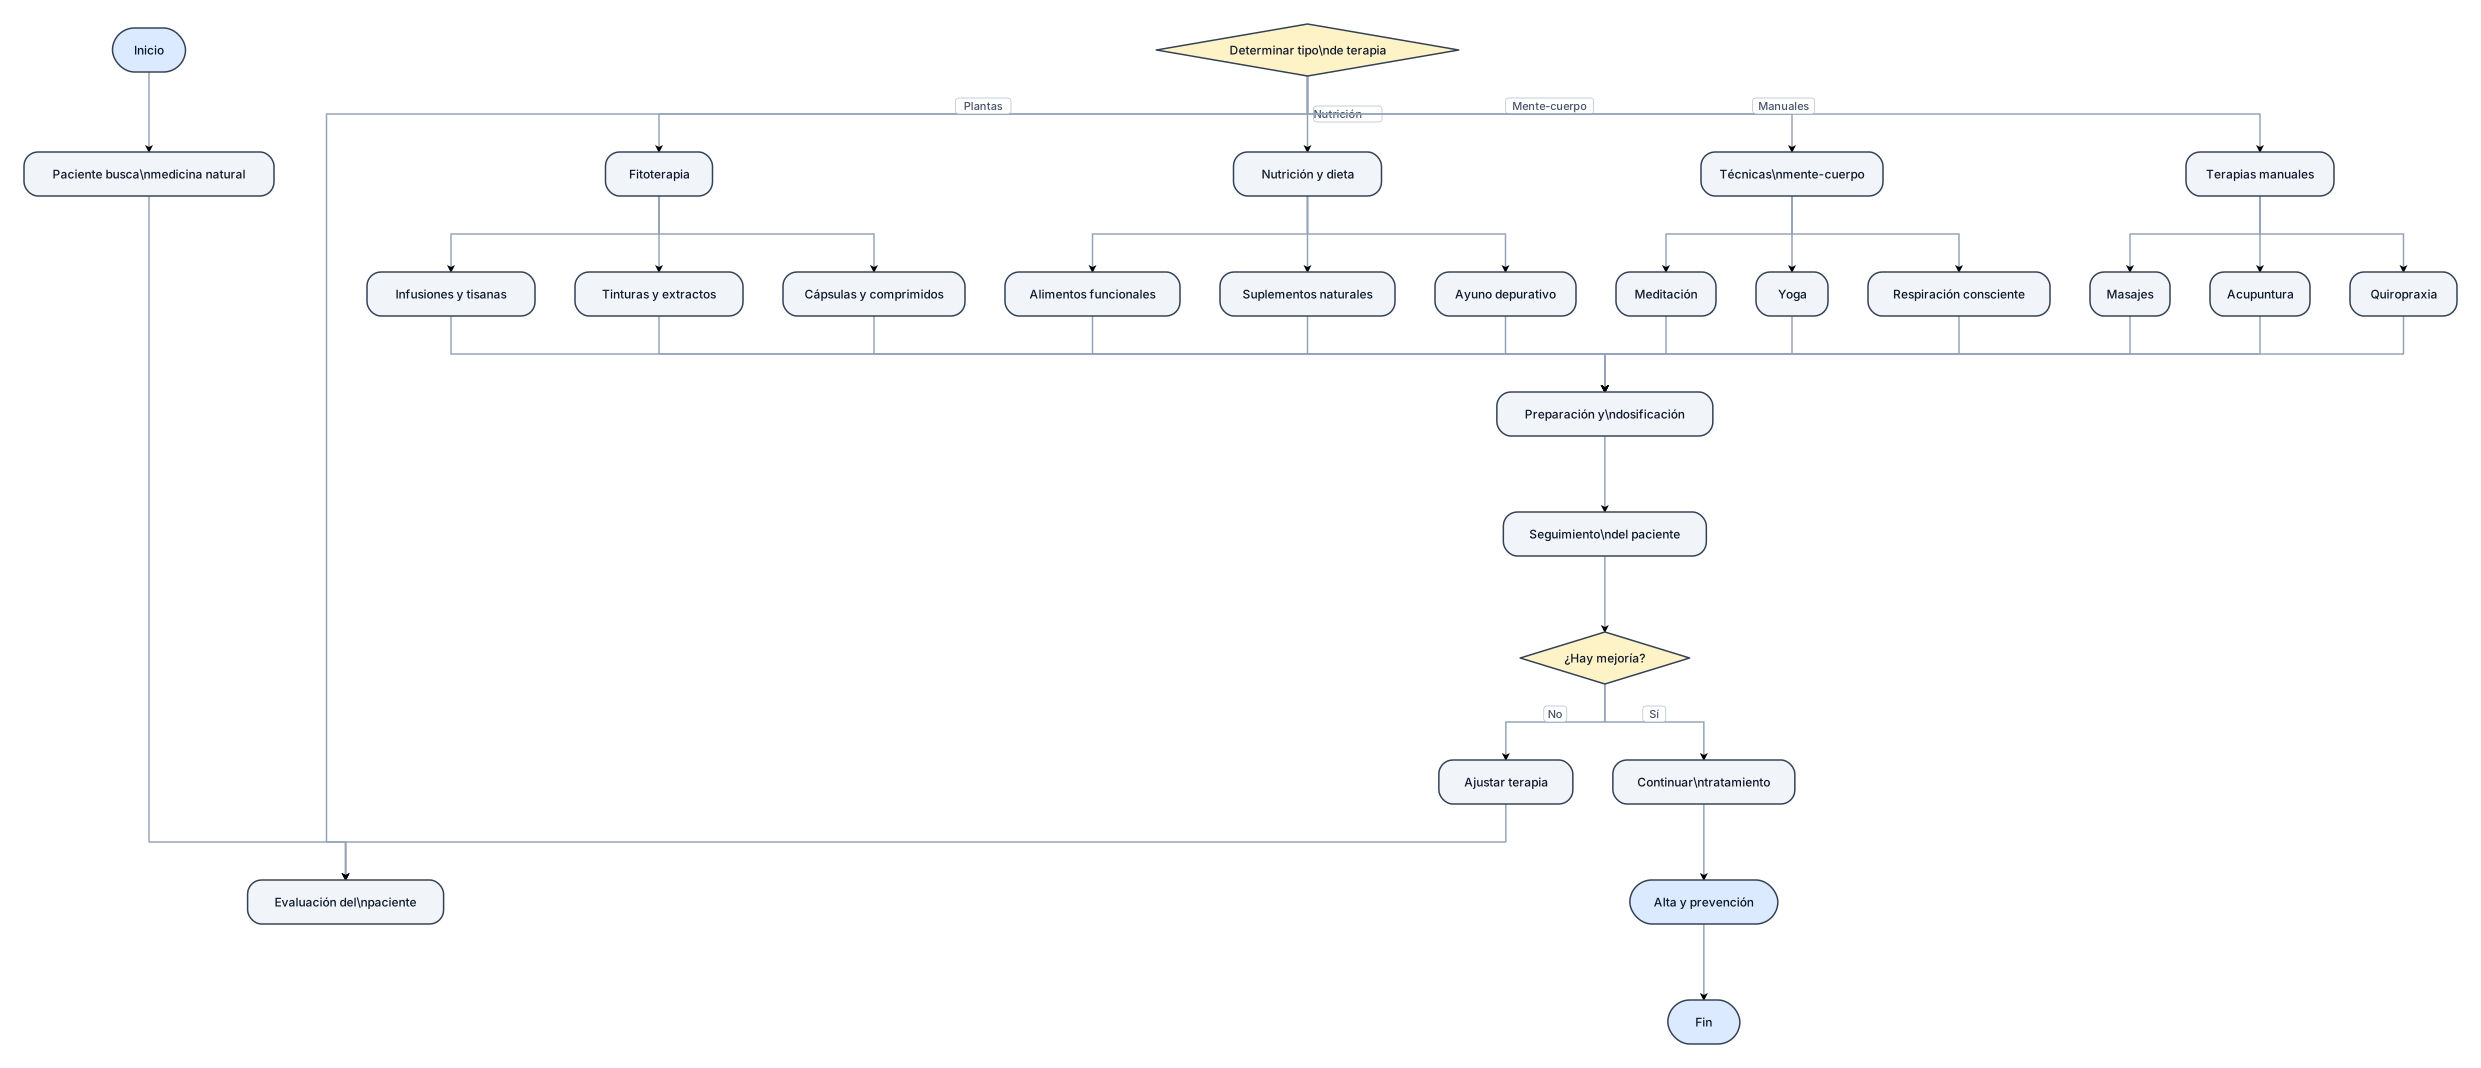
me lo hces diagrama de flujo que se trate de medicina natural
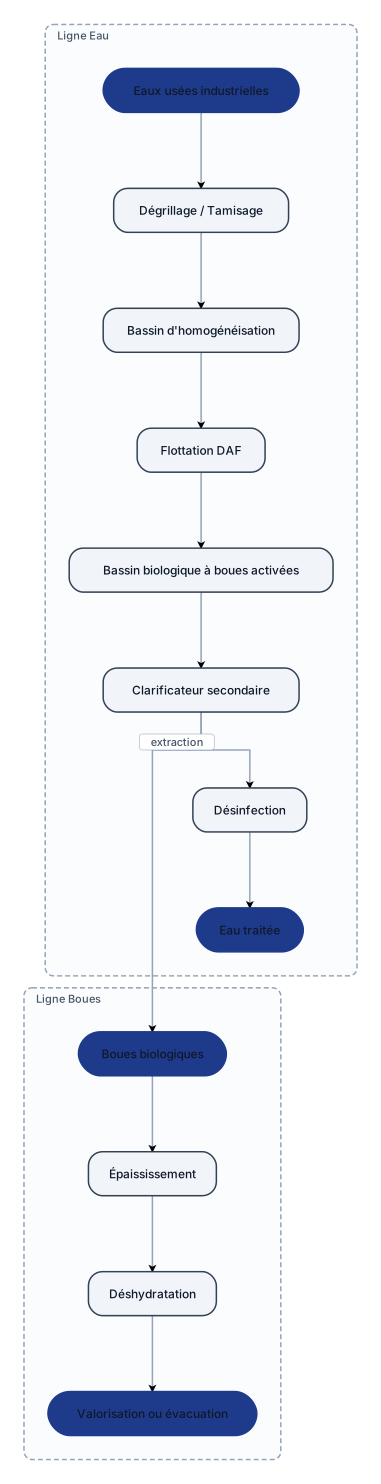
Créer un synoptique professionnel d'une STEP industrielle agroalimentaire (industrie laitière). Titre : STEP industrielle agroalimentaire – Traitement des eaux usées Ligne eau : Eaux usées industrielles ↓ Dégrillage / Tamisage (élimination des déchets grossiers) ↓ Bassin d'homogénéisation (régulation du débit et de la charge polluante) ↓ Flottation DAF (élimination des graisses et matières en suspension) ↓ Bassin biologique à boues activées (oxydation de la matière organique) ↓ Clarificateur secondaire (séparation eau-boues) ↓ Désinfection ↓ Eau traitée (rejet ou réutilisation) Ajouter une ligne boues : Boues biologiques ↓ Épaississement ↓ Déshydratation ↓ Valorisation ou évacuation Style : diagramme industriel PFD, professionnel, fond blanc, blocs bleus, flèches noires.
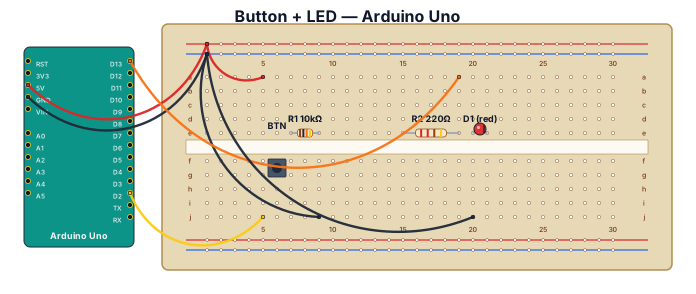
A breadboard wiring diagram for an Arduino Uno reading a button press and lighting an LED: button with pull-down resistor on D2, LED with 220-ohm resistor on D13