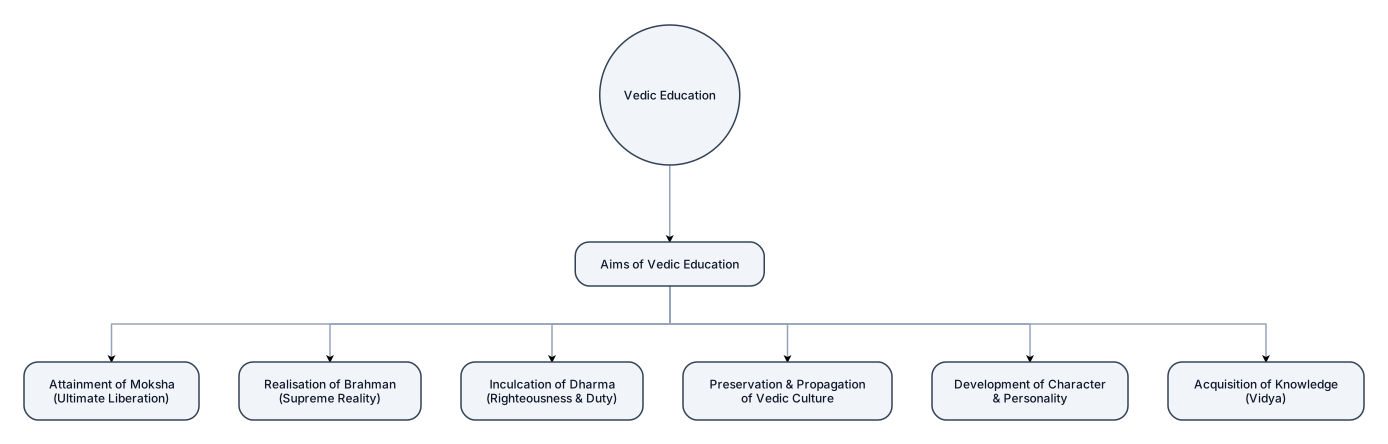
“Create a simple, exam-friendly flowchart on Vedic Education showing its aims.”
NODE ARCHIVE · REAL DIAGRAM BRIEFS
Diagram Examples from Real Visitor Prompts
Browse eligible diagrams shared by FreeDiagram visitors, inspect the exact prompts, and build your own version.
Browse 1008 real creationsCOMMUNITY OUTPUTS · EXACT PROMPTS
Main diagram studio
Showing 337–360 of 601. No stock examples or system defaults. Choose a tool, study a real result, then reopen its prompt as your starting point.
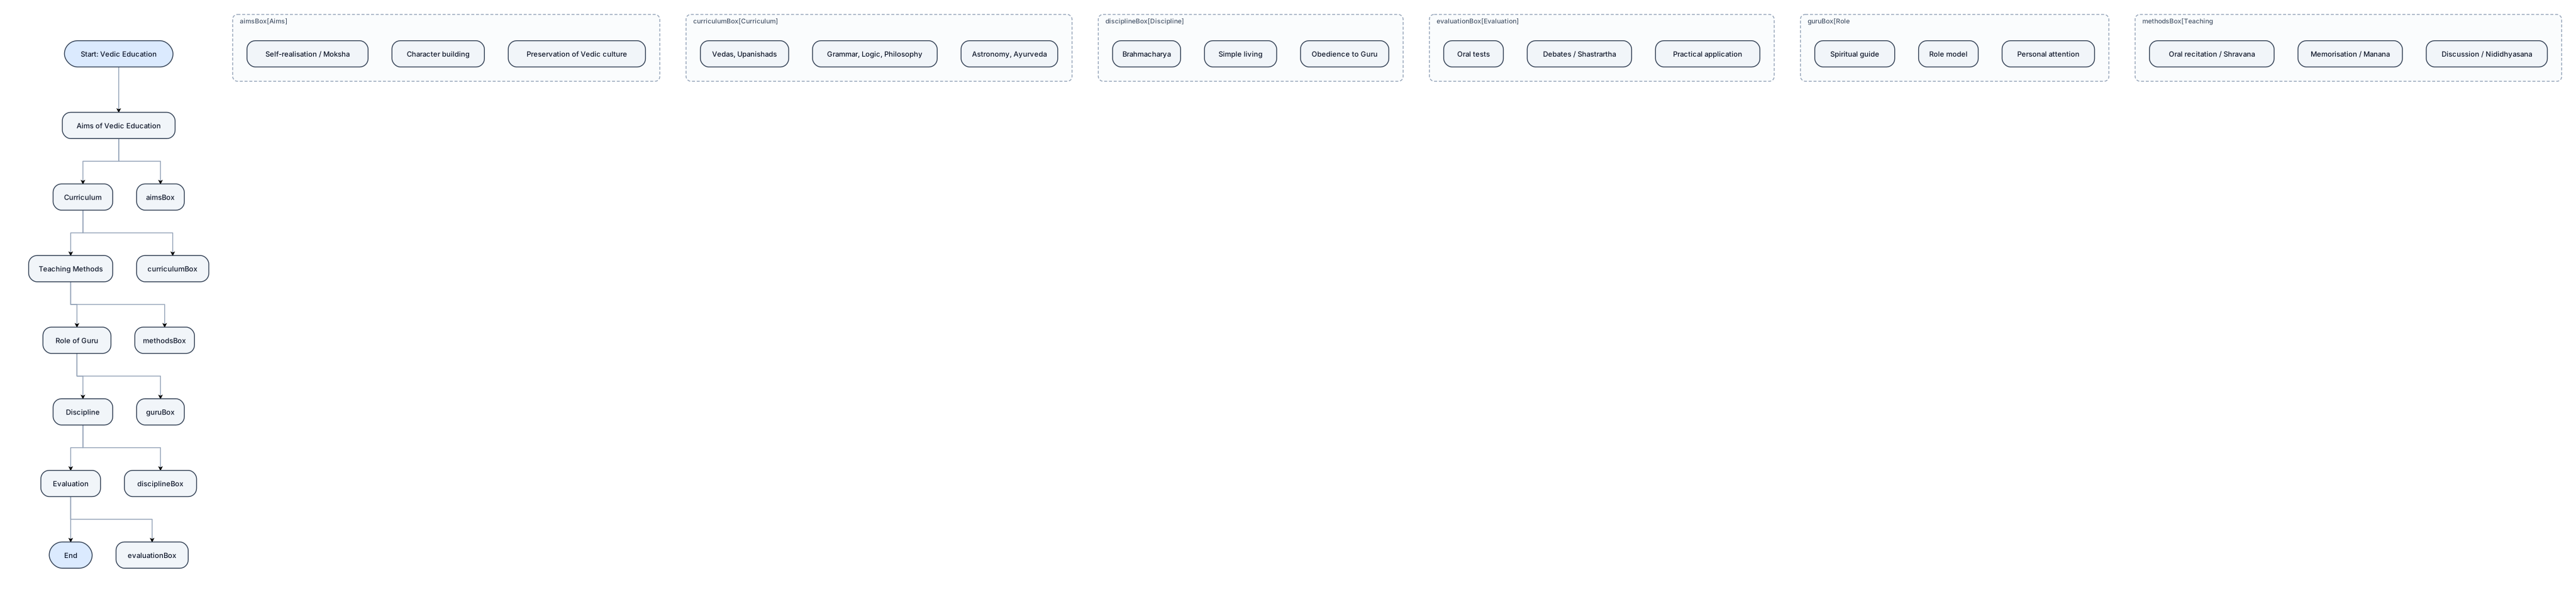
“Create a simple, exam-friendly flowchart on Vedic Education showing its aims, curriculum, teaching methods, role of Guru, discipline and evaluation.”

Create a scientific conceptual diagram showing broccoli microgreen cultivation, glucosinolate accumulation, myrosinase conversion of glucoraphanin to sulforaphane, absorption, and potential hepatoprotective effects in grade I fatty liver disease
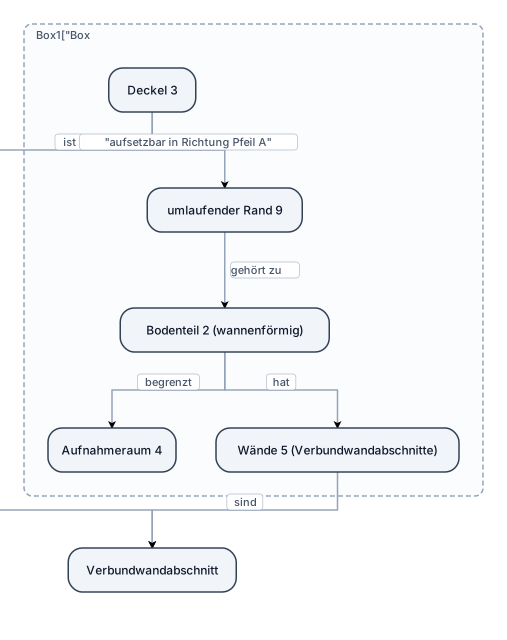
Figur 1 zeigt eine Box 1 mit einem wannenförmigen Bodenteil 2 und einem Deckel 3. Das Bodenteil 2 begrenzt einen Aufnahmeraum 4. Die Wände 5 des Bodenteils 2 und der Deckel 3 sind als Verbundwandabschnitte ausgebildet. Der Deckel 3 ist in Richtung des Pfeils A auf den umlaufenden Rand 9 des Bodenteils 2 aufsetzbar.
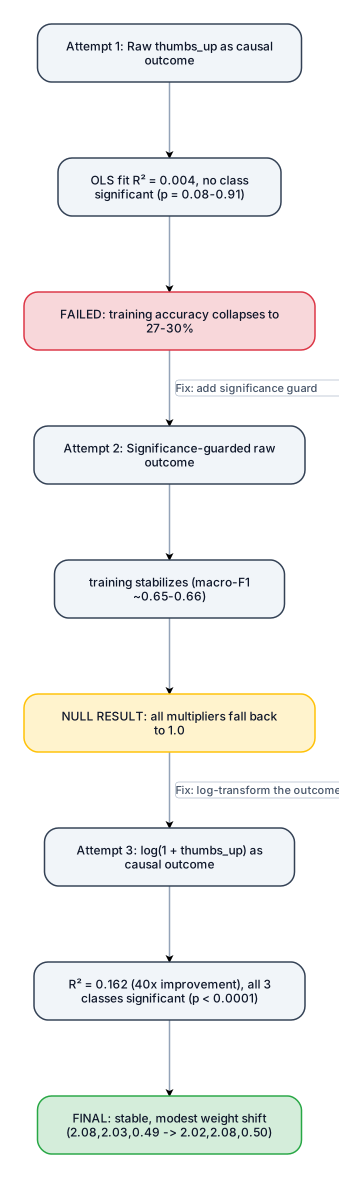
Create a flowchart titled "Causal-Driven Cost-Sensitive Weighting: Iteration History". Attempt 1: "Raw thumbs_up as causal outcome" -> OLS fit R² = 0.004, no class significant (p = 0.08-0.91) -> "FAILED: training accuracy collapses to 27-30%" (red box). Arrow labeled "Fix: add significance guard" leads to Attempt 2: "Significance-guarded raw outcome" -> training stabilizes (macro-F1 ~0.65-0.66) -> "NULL RESULT: all multipliers fall back to 1.0" (yellow/amber box). Arrow labeled "Fix: log-transform the outcome" leads to Attempt 3: "log(1 + thumbs_up) as causal outcome" -> R² = 0.162 (40x improvement), all 3 classes significant (p < 0.0001) -> "FINAL: stable, modest weight shift (2.08,2.03,0.49 -> 2.02,2.08,0.50)" (green box). Use a vertical top-to-bottom flowchart with color coding: red for failure, amber/yellow for stabilized-but-null, green for final success.
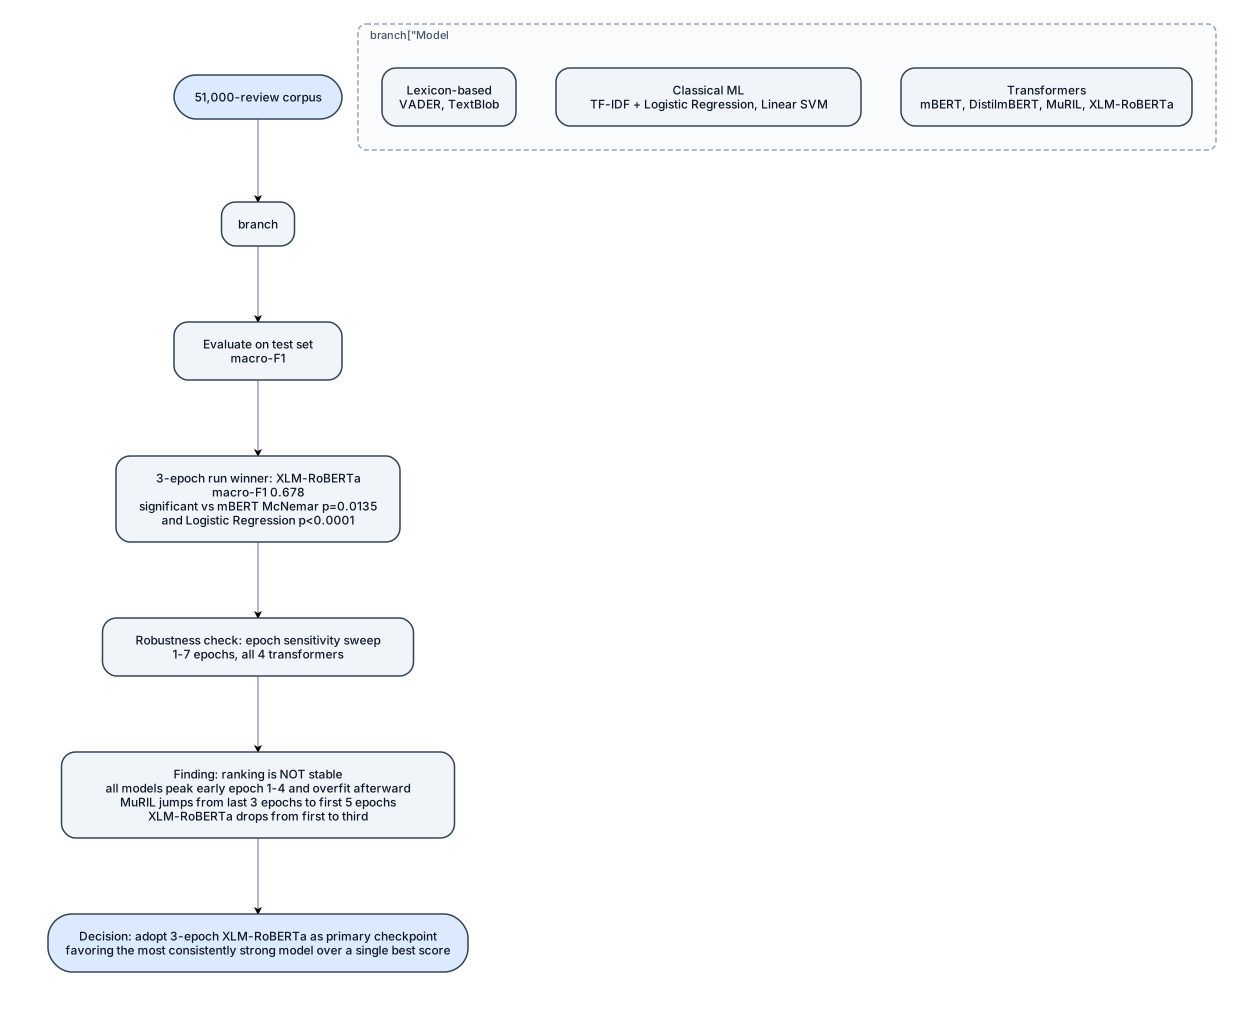
Create a flowchart titled "Sentiment Model Evaluation Pipeline". Start: 51,000-review corpus. Branch into 3 model families evaluated in parallel: Lexicon-based: VADER, TextBlob Classical ML: TF-IDF + Logistic Regression, Linear SVM Transformers: mBERT, DistilmBERT, MuRIL, XLM-RoBERTa All 8 models converge into: "Evaluate on test set (macro-F1)". Result box: "3-epoch run winner: XLM-RoBERTa (macro-F1 0.678), significant vs mBERT (McNemar p=0.0135) and Logistic Regression (p<0.0001)". Next step: "Robustness check: epoch sensitivity sweep (1-7 epochs, all 4 transformers)". Result box: "Finding: ranking is NOT stable - all models peak early (epoch 1-4) and overfit afterward. MuRIL jumps from last (3 epochs) to first (5 epochs); XLM-RoBERTa drops from first to third." Final step: "Decision: adopt 3-epoch XLM-RoBERTa as the primary checkpoint, favoring the most consistently strong model over a single best score." Use a funnel/pipeline layout, with the 3 model families as parallel colored branches merging into a single evaluation step.

Create a flowchart titled "Data Collection & Cleaning Pipeline". Step 1: Raw scrape - Banking apps: 27,000 reviews (9 apps x 3,000). UPI apps: 27,004 reviews (9 apps x ~3,000). Step 2: Data quality check - two issues found in parallel branches: Branch A: "Jupiter" app has only 4 reviews, dated 2020-2021, outside the Apr-Jun 2026 scrape window -> Dropped as failed scrape. Branch B: ICICI iMobile Pay found duplicated - same 3,000 reviews appear as "ICICI iMobile" in Banking AND "iMobile Pay" in UPI (same review IDs) -> Kept as Banking (bank-issued app), duplicate UPI copy dropped. Step 3: Final combined corpus: 51,000 reviews total = 27,000 Banking (9 apps) + 24,000 UPI (8 apps). Step 4: Preprocessing - light-touch cleaning, per-model subword tokenization, star rating mapped to sentiment label (1-2 negative, 3 neutral, 4-5 positive). Step 5: Output - Ready for sentiment model training. Use a clean left-to-right flowchart style, blue for collection, orange for the quality-check/decision branches, green for the final clean output.
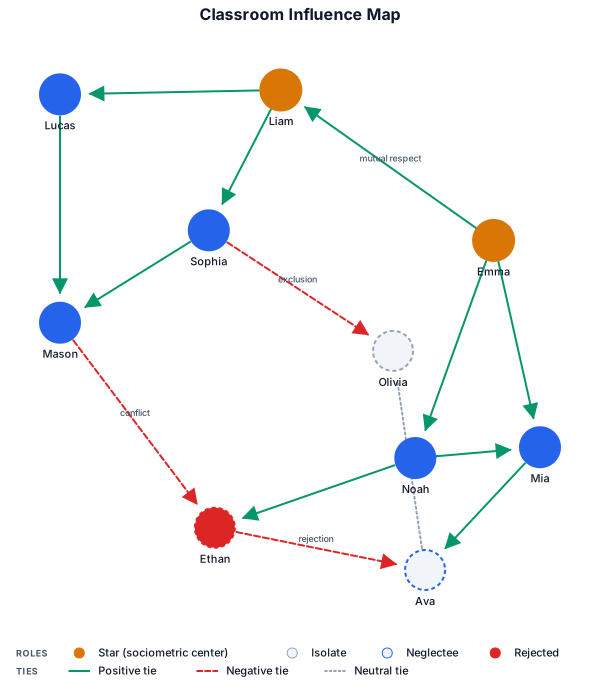
A sociogram of a classroom showing who influences whom, with positive and negative ties
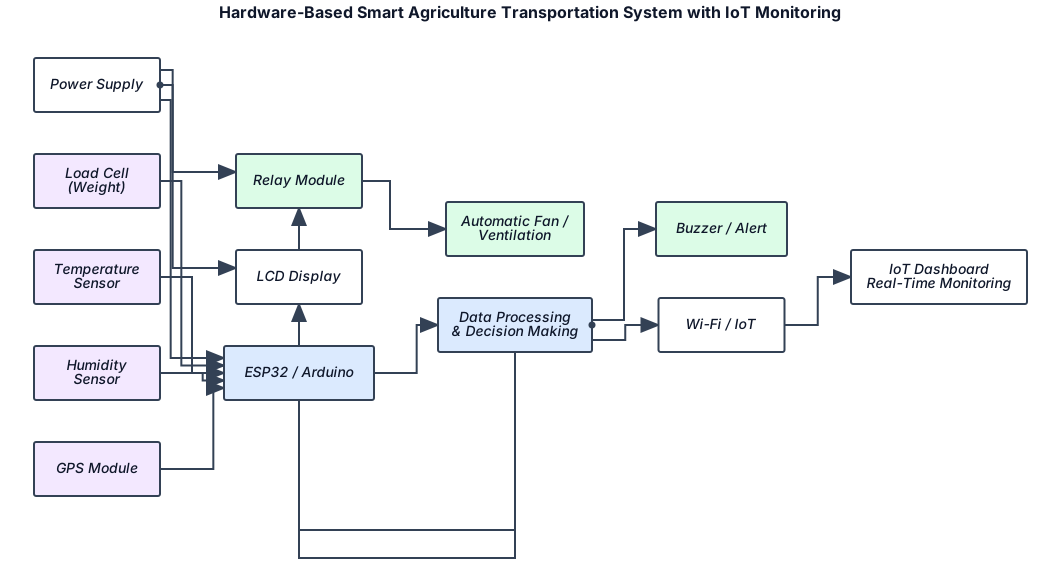
Create a simple engineering block diagram for a Hardware-Based Smart Agriculture Transportation System with IoT Monitoring. Show this flow: Load Cell (Weight) + Temperature Sensor + Humidity Sensor + GPS Module ↓ ESP32 / Arduino ↓ Data Processing & Decision Making ↓ Relay Module → Automatic Fan / Ventilation ↓ Wi-Fi / IoT ↓ IoT Dashboard → Real-Time Monitoring Also connect LCD Display and Buzzer/Alert to the ESP32/Arduino. Add Power Supply to the system. Use clean rectangular blocks, simple arrows, and a professional college-project style.flowchart
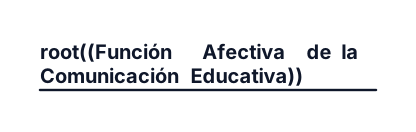
querio un mapa de burbuja bien original y comprensible puede tener concepto, caracteristicas, un ejemplo en clase, y como nos ayuda en el ámbito educativo con el tema funcion afectiva de la comunicación educativa
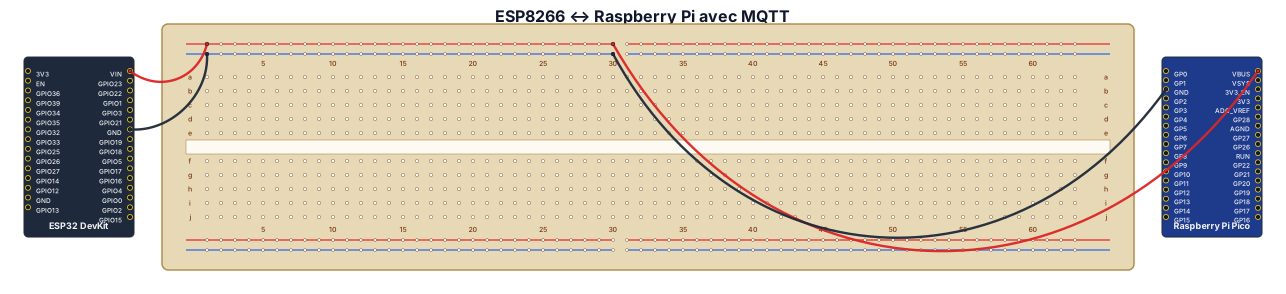
Créer un schéma technique horizontal pour un tutoriel domotique intitulé « ESP8266 ↔ Raspberry Pi avec MQTT ». À gauche, représenter un module ESP8266. L'ESP8266 se connecte en Wi-Fi au réseau local. Au centre, représenter le réseau local Wi-Fi. À droite, représenter un Raspberry Pi. Dans le Raspberry Pi, montrer « Broker MQTT / Mosquitto ». Le Raspberry Pi est également relié à « RaspiDomo », l'application domotique. Montrer les communications avec des flèches clairement identifiées : ESP8266 → Wi-Fi → Réseau local → Raspberry Pi. Montrer MQTT entre l'ESP8266 et le broker MQTT. Montrer également le retour des commandes du Raspberry Pi vers l'ESP8266. Style : schéma informatique/domotique professionnel, fond clair, couleurs sobres, icônes ESP8266 et Raspberry Pi si disponibles, texte en français, très lisible, format horizontal, adapté à une documentation de tutoriel.
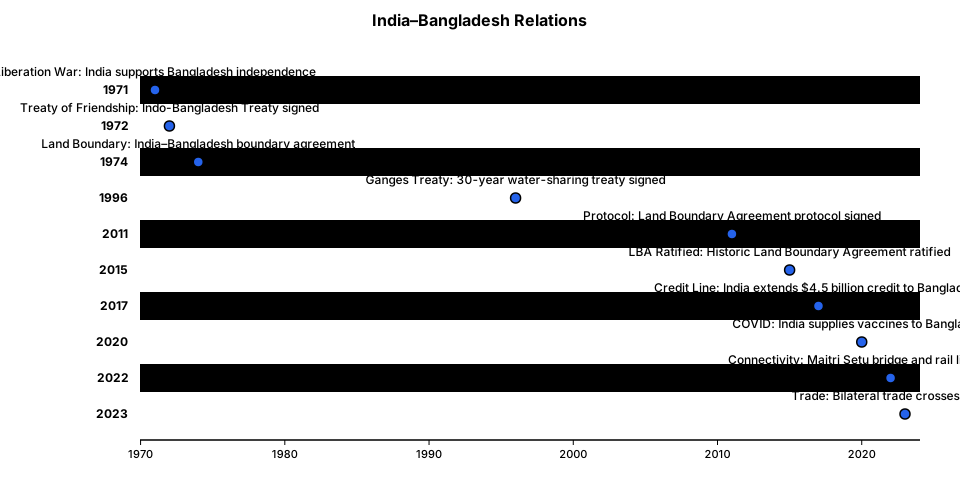
India Bangladesh relation
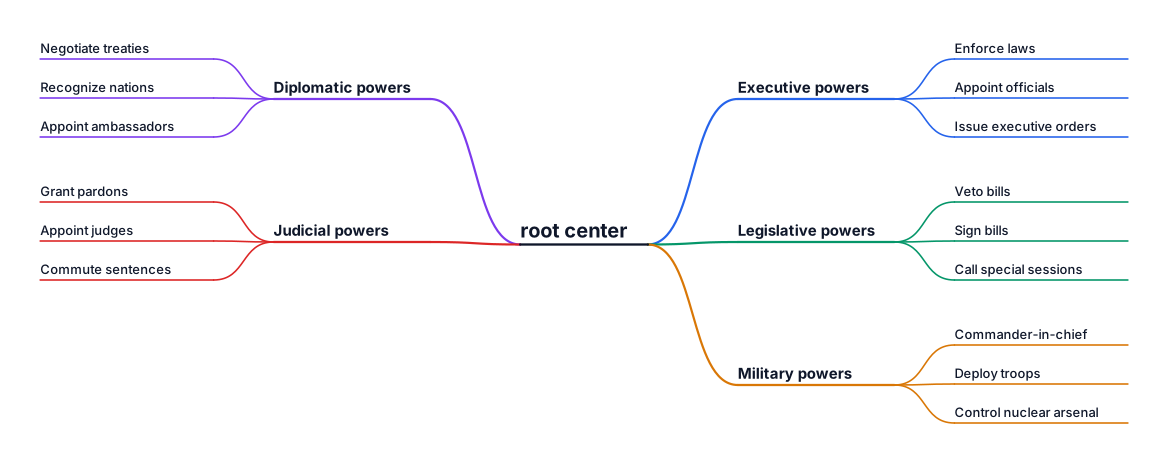
Power of president

I need a horizontal diagram that covers years from 2017 to 2026
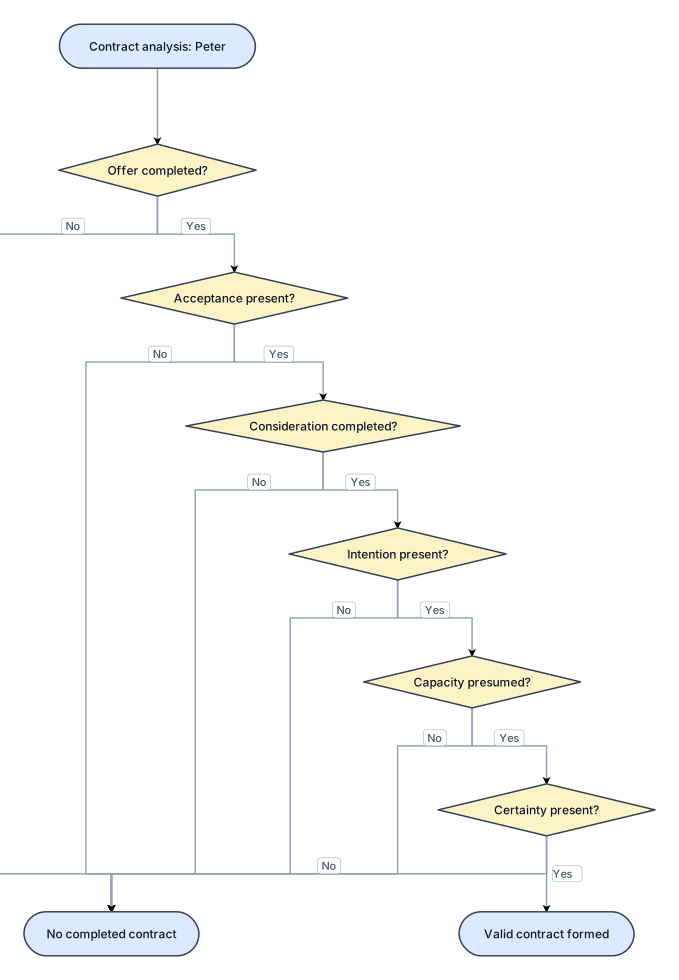
Peter's six contract elements: Offer – not yet completed; Acceptance – absent; Consideration – not completed; Intention – present; Capacity – presumed; Certainty – present; Result – no completed contract.
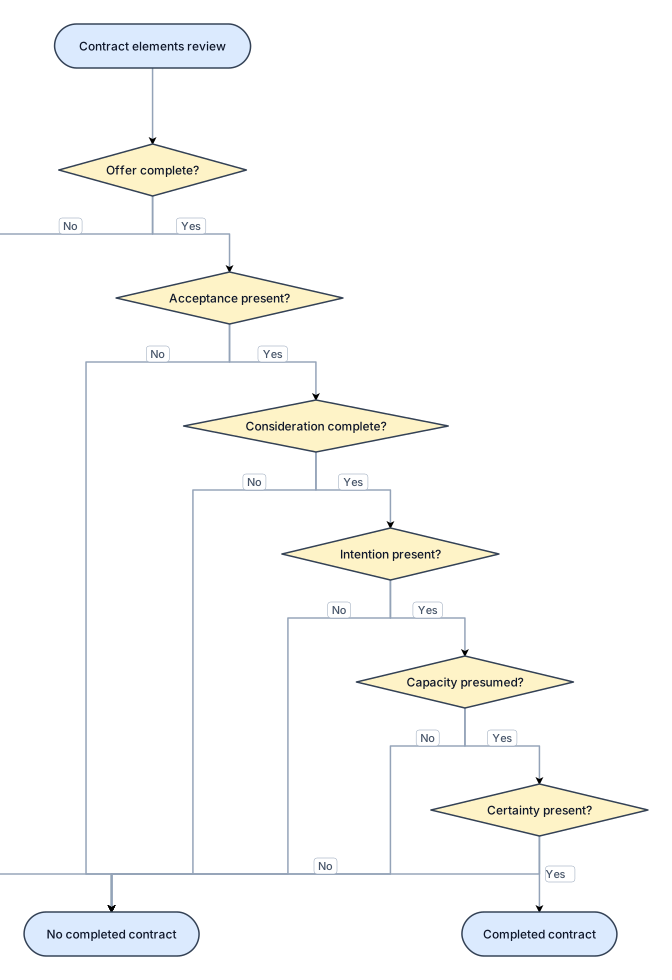
A flowchart of Peter's six contract elements: Offer – not yet completed; Acceptance – absent; Consideration – not completed; Intention – present; Capacity – presumed; Certainty – present; Result – no completed contract.
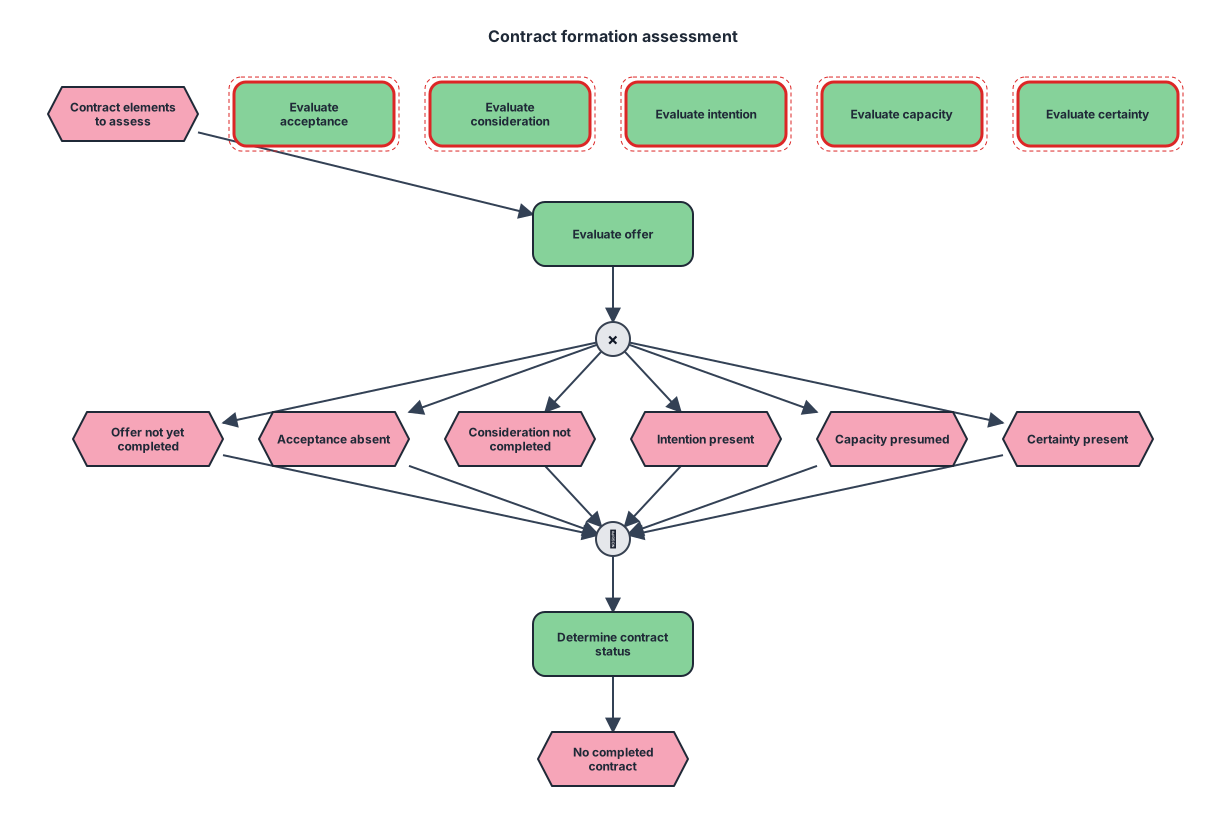
Peter's six contract elements: Offer – not yet completed; Acceptance – absent; Consideration – not completed; Intention – present; Capacity – presumed; Certainty – present; Result – no completed contract.
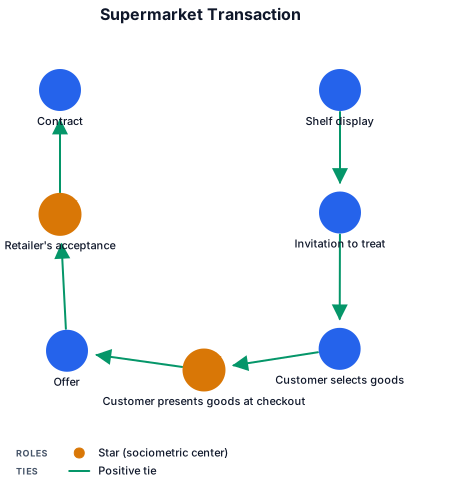
A sociogram of a Supermarket transaction: Shelf display → Invitation to treat → Customer selects goods → Customer presents goods at checkout → Offer → Retailer's acceptance → Contract.
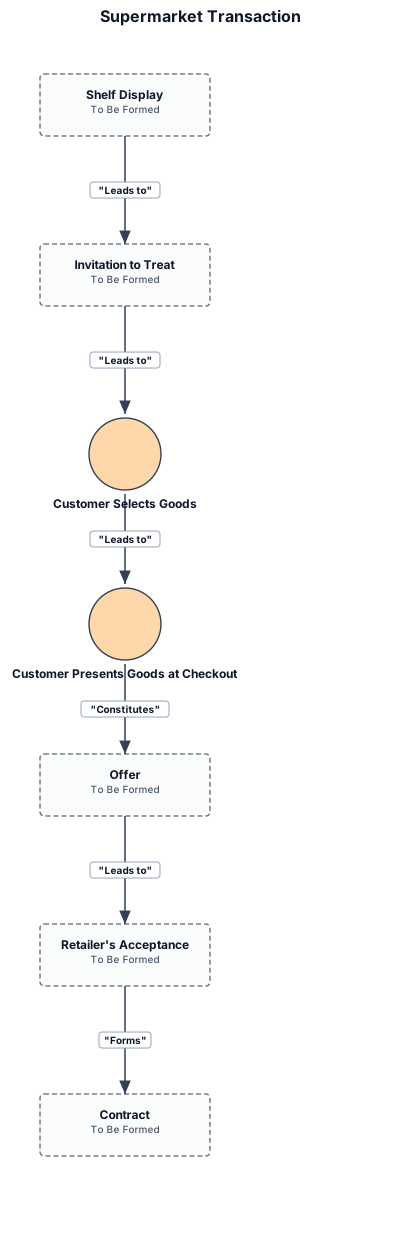
Supermarket transaction: Shelf display → Invitation to treat → Customer selects goods → Customer presents goods at checkout → Offer → Retailer's acceptance → Contract.
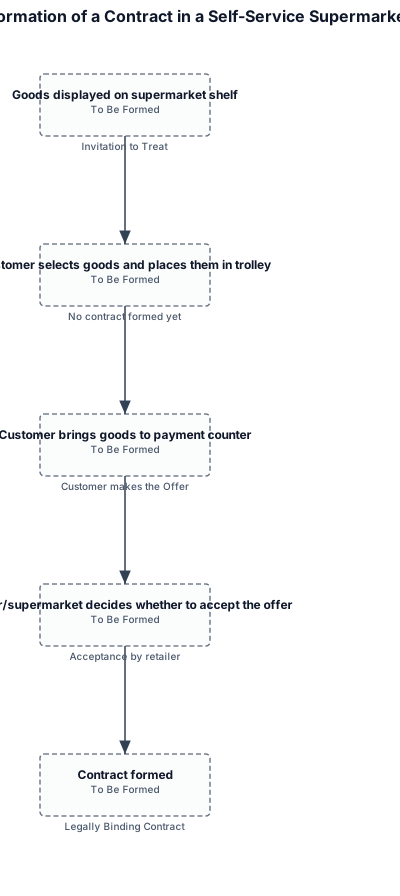
Create a clean, professional academic flowchart for a university Business Law assignment explaining the formation of a contract in a self-service supermarket. Use a simple left-to-right or top-to-bottom sequence with arrows. Show these exact stages: 1. Goods displayed on supermarket shelf Label: “Invitation to Treat” ↓ 2. Customer selects goods and places them in trolley Label: “No contract formed yet” ↓ 3. Customer brings goods to payment counter Label: “Customer makes the Offer” ↓ 4. Cashier/supermarket decides whether to accept the offer Label: “Acceptance by retailer” ↓ 5. Contract formed Label: “Legally Binding Contract” Add a small note below the diagram: “Based on Pharmaceutical Society of Great Britain v. Boots Cash Chemists (Southern) Ltd. [1953] 1 Q.B. 401.”

Create a clean, professional academic flowchart for a university Business Law assignment explaining the formation of a contract in a self-service supermarket. Use a simple left-to-right or top-to-bottom sequence with arrows. Show these exact stages: 1. Goods displayed on supermarket shelf Label: “Invitation to Treat” ↓ 2. Customer selects goods and places them in trolley Label: “No contract formed yet” ↓ 3. Customer brings goods to payment counter Label: “Customer makes the Offer” ↓ 4. Cashier/supermarket decides whether to accept the offer Label: “Acceptance by retailer” ↓ 5. Contract formed Label: “Legally Binding Contract” Add a small note below the diagram: “Based on Pharmaceutical Society of Great Britain v. Boots Cash Chemists (Southern) Ltd. [1953] 1 Q.B. 401.”

A fishbone diagram that shows Six elements of a valid contract: 1 Offer → 2 Acceptance → 3 Consideration → 4 Intention → 5 Capacity → 6 Certainty ,then it becomes Legally binding contract.

A fishbone diagram that shows Six elements of a valid contract: Offer → Acceptance → Consideration → Intention → Capacity → Certainty → Legally binding contract.
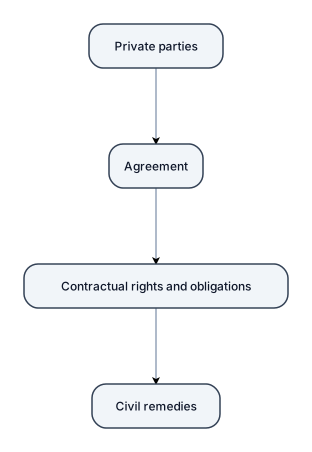
Figure 1. Contract law as private law: Private parties → Agreement → Contractual rights and obligations → Civil remedies.
Focused examples and prompt ideas
Start with the complete visitor wall above, then use these focused collections when you want a narrower subject and more prompt context.
The first curated collection is being prepared.