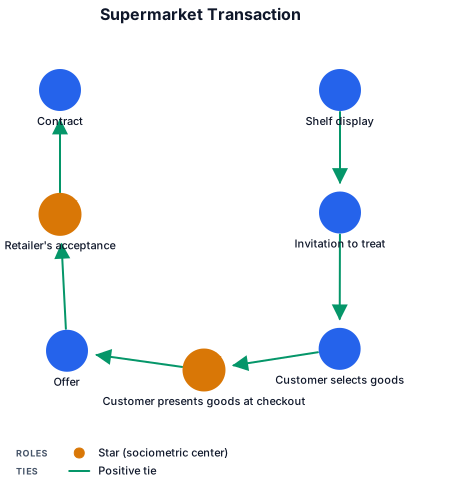
A sociogram of a Supermarket transaction: Shelf display → Invitation to treat → Customer selects goods → Customer presents goods at checkout → Offer → Retailer's acceptance → Contract.
NODE ARCHIVE · REAL DIAGRAM BRIEFS
Diagram Examples from Real Visitor Prompts
Browse eligible diagrams shared by FreeDiagram visitors, inspect the exact prompts, and build your own version.
Browse 1016 real creationsCOMMUNITY OUTPUTS · EXACT PROMPTS
Main diagram studio
Showing 361–384 of 608. No stock examples or system defaults. Choose a tool, study a real result, then reopen its prompt as your starting point.
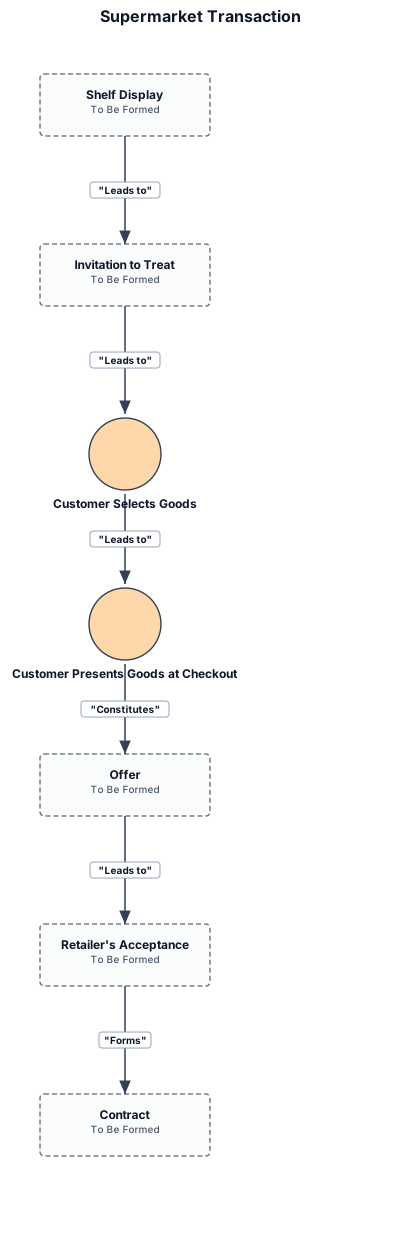
Supermarket transaction: Shelf display → Invitation to treat → Customer selects goods → Customer presents goods at checkout → Offer → Retailer's acceptance → Contract.
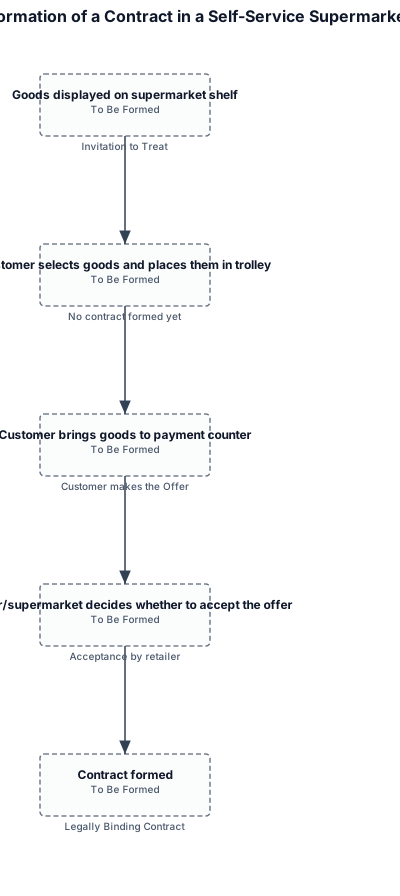
Create a clean, professional academic flowchart for a university Business Law assignment explaining the formation of a contract in a self-service supermarket. Use a simple left-to-right or top-to-bottom sequence with arrows. Show these exact stages: 1. Goods displayed on supermarket shelf Label: “Invitation to Treat” ↓ 2. Customer selects goods and places them in trolley Label: “No contract formed yet” ↓ 3. Customer brings goods to payment counter Label: “Customer makes the Offer” ↓ 4. Cashier/supermarket decides whether to accept the offer Label: “Acceptance by retailer” ↓ 5. Contract formed Label: “Legally Binding Contract” Add a small note below the diagram: “Based on Pharmaceutical Society of Great Britain v. Boots Cash Chemists (Southern) Ltd. [1953] 1 Q.B. 401.”

Create a clean, professional academic flowchart for a university Business Law assignment explaining the formation of a contract in a self-service supermarket. Use a simple left-to-right or top-to-bottom sequence with arrows. Show these exact stages: 1. Goods displayed on supermarket shelf Label: “Invitation to Treat” ↓ 2. Customer selects goods and places them in trolley Label: “No contract formed yet” ↓ 3. Customer brings goods to payment counter Label: “Customer makes the Offer” ↓ 4. Cashier/supermarket decides whether to accept the offer Label: “Acceptance by retailer” ↓ 5. Contract formed Label: “Legally Binding Contract” Add a small note below the diagram: “Based on Pharmaceutical Society of Great Britain v. Boots Cash Chemists (Southern) Ltd. [1953] 1 Q.B. 401.”

A fishbone diagram that shows Six elements of a valid contract: 1 Offer → 2 Acceptance → 3 Consideration → 4 Intention → 5 Capacity → 6 Certainty ,then it becomes Legally binding contract.

A fishbone diagram that shows Six elements of a valid contract: Offer → Acceptance → Consideration → Intention → Capacity → Certainty → Legally binding contract.
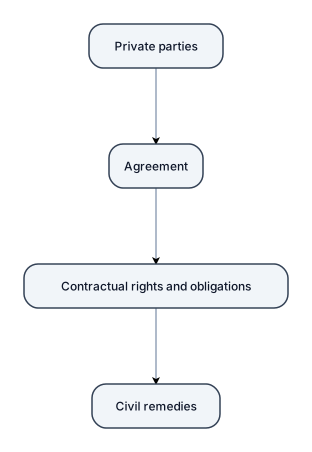
Figure 1. Contract law as private law: Private parties → Agreement → Contractual rights and obligations → Civil remedies.
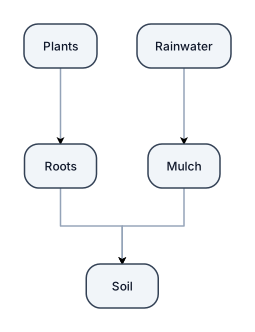
Simple school science sketch of a soil erosion prevention design. Show a side view of soil with small plants growing above it, roots visible underground, and mulch covering the soil. Add arrows and labels for Plants, Roots, Mulch, Soil, and Rainwater. Black and white hand-drawn worksheet style. Make it look like a student science diagram, not a logo, poster, advertisement, or front design.
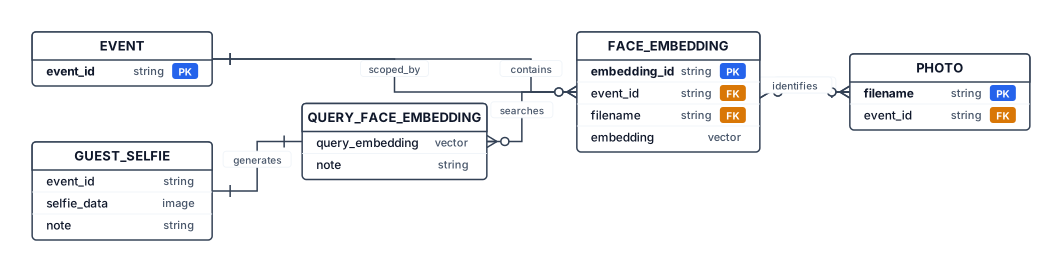
Create a professional academic Logical Data Model / ER-style Diagram for: "ClickMe – AI Event Photo Retrieval System Using Face Recognition" Important: The actual implementation uses ChromaDB, not a relational database. Therefore, represent the logical relationships rather than traditional relational database tables. Show these main components: EVENT - event_id PHOTO - filename - event_id FACE EMBEDDING - embedding_id - event_id - filename - embedding vector GUEST SELFIE / QUERY - event_id - query face embedding Relationships: EVENT contains PHOTO. PHOTO produces or is associated with FACE EMBEDDING. GUEST SELFIE is temporarily processed to generate a QUERY FACE EMBEDDING. QUERY FACE EMBEDDING searches stored FACE EMBEDDINGS. Matching FACE EMBEDDINGS identify matching PHOTOS. Clearly indicate that the guest selfie and query embedding are temporary and are not permanently stored. Use clean academic diagram notation, white background, rectangular entities, arrows showing relationships, minimal colors, readable labels, suitable for a university project report. Do not show PostgreSQL, MySQL or any relational database.
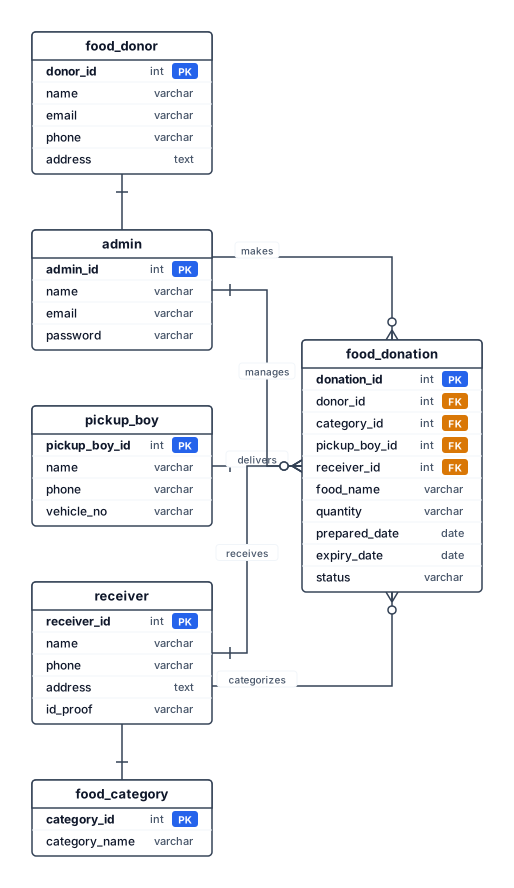
Entity relationship diagram for food donation system. ER diagram . food donation,food donor,admin,pick-up boy,receiver,food category,ER diagram generate
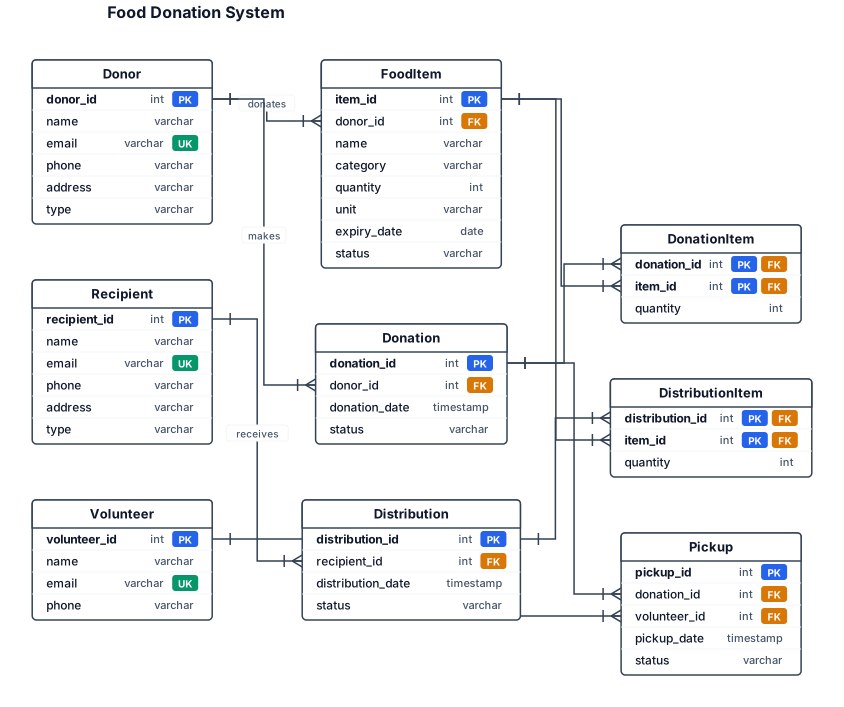
An entity-relationship diagram for the topic is food donation system relationship between entity
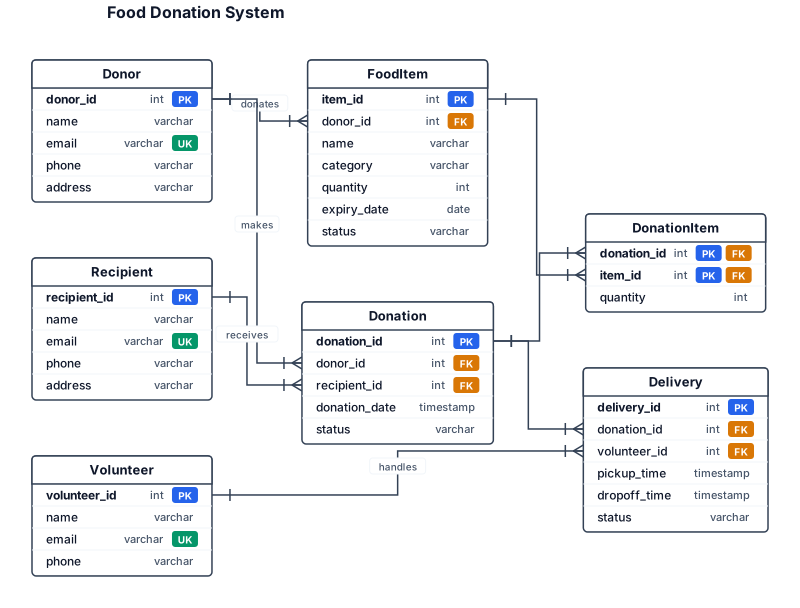
An entity-relationship diagram for the topic is food donation system relationship between entitys
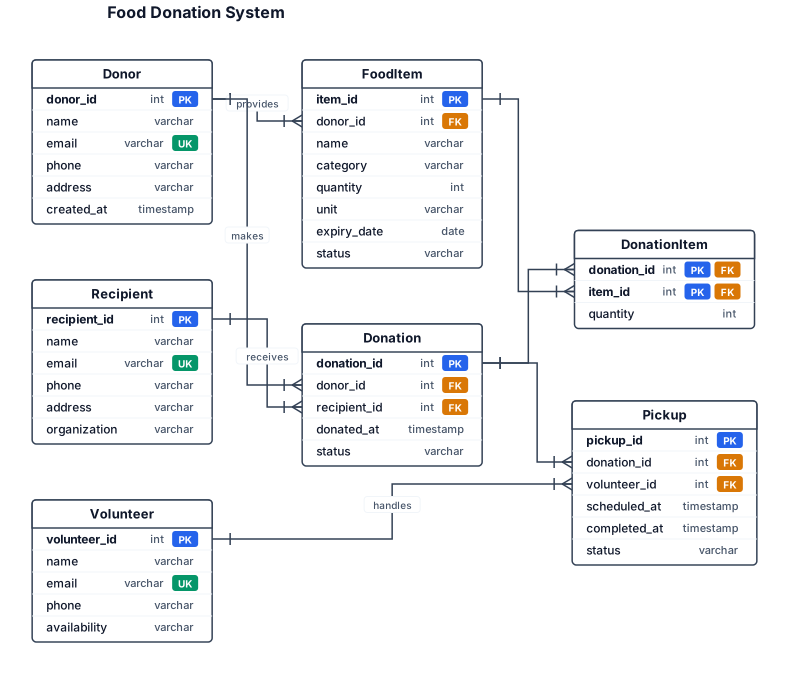
An entity-relationship diagram for the topic is food donation system
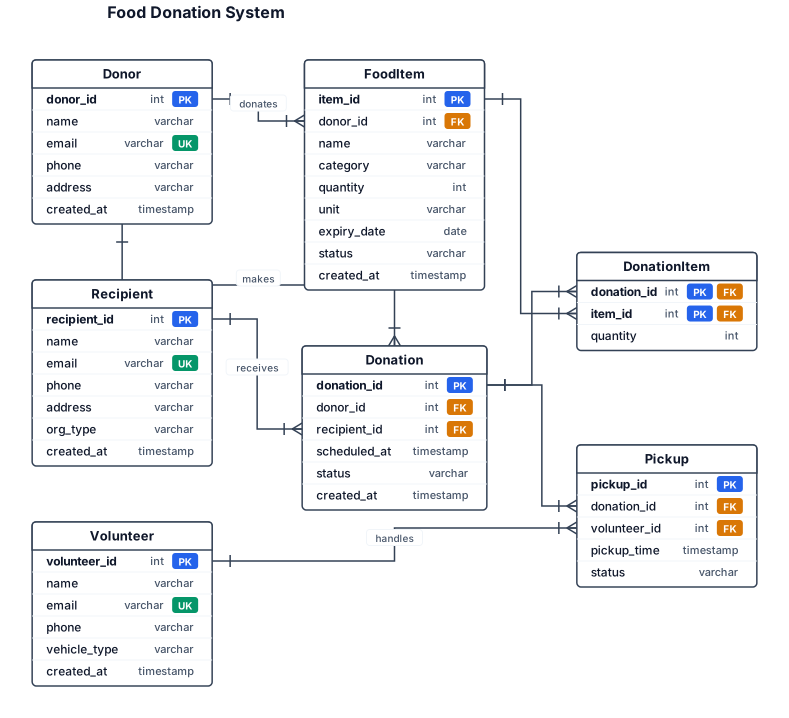
An entity-relationship diagram for a SaaS app the topic is food donation system
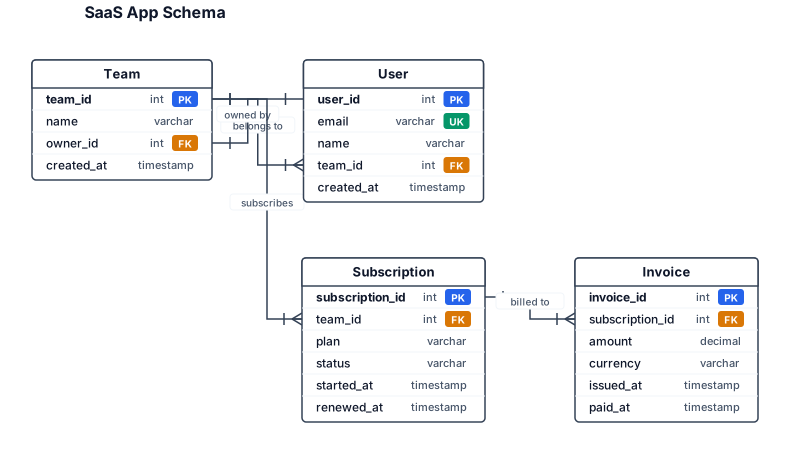
An entity-relationship diagram for a SaaS app with users, teams, subscriptions, and invoices
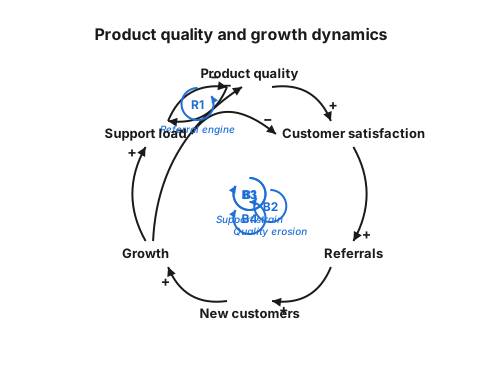
A causal loop diagram showing how product quality, customer satisfaction, referrals, growth, and support load reinforce or balance each other

Create a clean academic 0-Level DFD for: “ClickMe – AI Event Photo Retrieval System” LAYOUT: Use a wide landscape layout with plenty of empty space. Do NOT make the diagram compact or crowded. Place the elements like this: LEFT: Rectangle: PHOTOGRAPHER CENTER: One large process box: (ClickMe – AI Event Photo Retrieval System) RIGHT: Rectangle: GUEST ARROWS: PHOTOGRAPHER → CLICKME Label: Event Photos + Event ID GUEST → CLICKME Label: Selfie + Event ID CLICKME → GUEST Label: Matching Photographs IMPORTANT: - Exactly 2 external entities: Photographer and Guest - Exactly 1 central process: ClickMe - No other boxes - No internal processes - No ChromaDB - No Face Detection - No Face Embedding - No Similarity Search - No extra text - No icons - No decoration - Do not stack the elements vertically - Do not overlap arrows or labels - Keep large spacing between all elements - Use clear directional arrows - Use black text and black lines on white background - Professional college-project style - Landscape orientation - High resolution The final diagram should be visually simple: PHOTOGRAPHER → CLICKME → GUEST ↑ │ GUEST → CLICKME Caption: Figure 5.3.1: 0-Level DFD of ClickMe

Create a clean and professional academic 0-Level Data Flow Diagram (DFD) for a college project titled: “ClickMe – AI Event Photo Retrieval System” Use standard DFD notation. IMPORTANT: This is a 0-Level DFD, so show the complete ClickMe application as ONE single central process. Do NOT show internal processes such as face detection, face embedding generation, similarity search, ChromaDB, OpenCV, InsightFace, Docker, or any other internal component. Include exactly TWO external entities: 1. PHOTOGRAPHER 2. GUEST Include exactly ONE central process: “ClickMe – AI Event Photo Retrieval System” Data flows: 1. PHOTOGRAPHER → ClickMe System Label the arrow: “Event Photos + Event ID” 2. GUEST → ClickMe System Label the arrow: “Selfie + Event ID” 3. ClickMe System → GUEST Label the arrow: “Matching Photographs” The diagram should clearly show that the photographer provides event photographs and Event ID to the system, while the guest provides a selfie and Event ID to search for photographs. The system returns matching photographs to the guest. Use: - Standard DFD symbols - External entities as rectangles - The complete ClickMe system as one process - Clearly labelled directional arrows - Black and white academic style - White background - Clean rectangular shapes - Simple professional typography - Landscape orientation - No decorative graphics - No icons - No photographs - No unnecessary text - No extra entities - No extra processes Make the diagram suitable for direct insertion into a college project report. Title/caption should be: “Figure 5.3.1: 0-Level DFD of ClickMe”
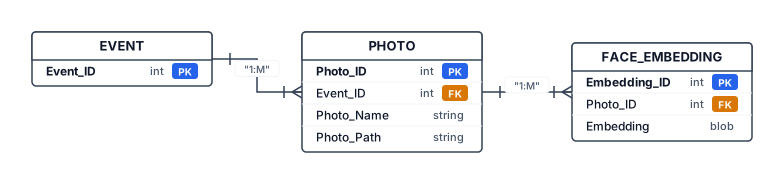
Create a clean academic ER diagram for my AI Event Photo Retrieval System called ClickMe. The system stores event photographs and facial embeddings for selfie-based photo retrieval. Use three main database entities: EVENT, PHOTO, and FACE_EMBEDDING. EVENT contains PK Event_ID. PHOTO contains PK Photo_ID, FK Event_ID, Photo_Name, and Photo_Path. FACE_EMBEDDING contains PK Embedding_ID, FK Photo_ID, and facial Embedding. Show a one-to-many relationship between EVENT and PHOTO because one event contains many photographs. Show a one-to-many relationship between PHOTO and FACE_EMBEDDING because one photograph may contain multiple detected faces and therefore multiple facial embeddings. Show a separate Guest Selfie input outside the database entities. The Guest Selfie is processed to generate a facial embedding and is used for similarity search against the stored facial embeddings in ChromaDB; it is not a permanent database entity. Mention ChromaDB as the vector database used to store and search facial embeddings, but do not represent ChromaDB as an entity. Use standard ERD notation, clear rectangles, PK/FK labels, cardinality 1:M, black-and-white academic style, white background, landscape layout, no unnecessary decoration, suitable for a college project report.
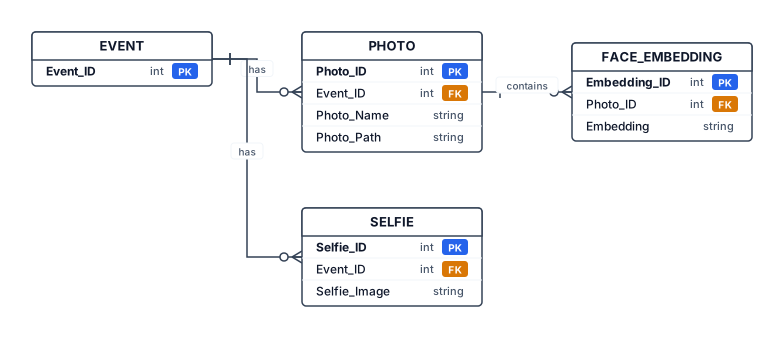
Create a clean academic Entity Relationship Diagram (ERD) for an AI Event Photo Retrieval System called ClickMe. Include four entities: EVENT, PHOTO, FACE_EMBEDDING, and SELFIE. EVENT has Event_ID as the primary key. PHOTO has Photo_ID as the primary key, Event_ID as a foreign key, and Photo_Name/Photo_Path. FACE_EMBEDDING has Embedding_ID as the primary key, Photo_ID as a foreign key, and Embedding. SELFIE has Selfie_ID as the primary key, Event_ID as a foreign key, and Selfie_Image. Show these relationships: one EVENT can have many PHOTOS; one PHOTO can contain multiple FACE_EMBEDDINGS; one EVENT can have multiple SELFIES. Use standard ERD notation, clear rectangles, primary key and foreign key labels, simple black-and-white academic style, no unnecessary decoration, white background, landscape layout, suitable for a college project report.
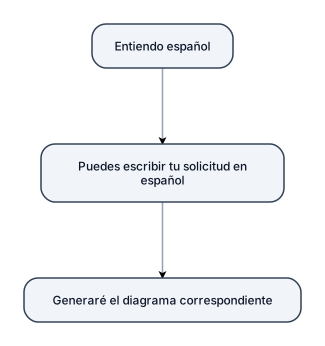
Me entiendes si escribo mi solicitud en español?
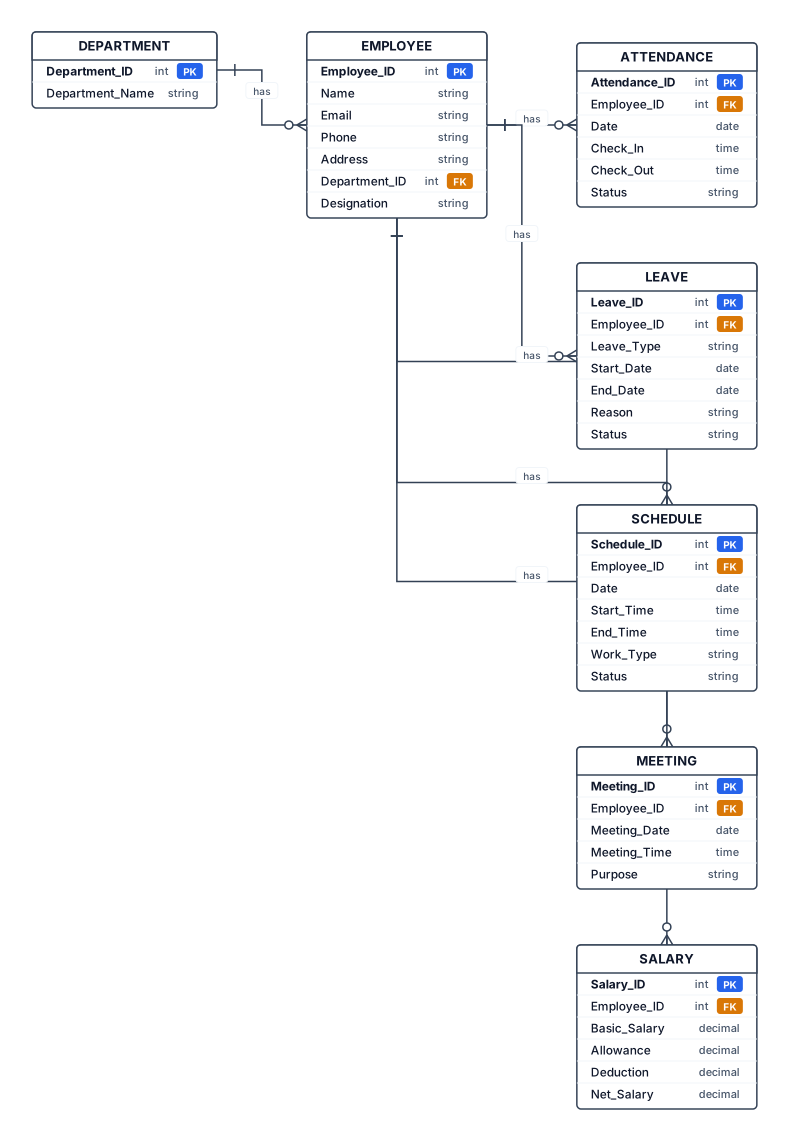
Create a simple, professional black-and-white ER (Entity Relationship) diagram for an Employee Management System college project. Use exactly these 7 entities: 1. EMPLOYEE 2. DEPARTMENT 3. ATTENDANCE 4. LEAVE 5. SCHEDULE 6. MEETING 7. SALARY EMPLOYEE attributes: Employee_ID (PK), Name, Email, Phone, Address, Department_ID (FK), Designation DEPARTMENT attributes: Department_ID (PK), Department_Name ATTENDANCE attributes: Attendance_ID (PK), Employee_ID (FK), Date, Check_In, Check_Out, Status LEAVE attributes: Leave_ID (PK), Employee_ID (FK), Leave_Type, Start_Date, End_Date, Reason, Status SCHEDULE attributes: Schedule_ID (PK), Employee_ID (FK), Date, Start_Time, End_Time, Work_Type, Status MEETING attributes: Meeting_ID (PK), Employee_ID (FK), Meeting_Date, Meeting_Time, Purpose SALARY attributes: Salary_ID (PK), Employee_ID (FK), Basic_Salary, Allowance, Deduction, Net_Salary Relationships: DEPARTMENT has many EMPLOYEES (1:M). EMPLOYEE has many ATTENDANCE records (1:M). EMPLOYEE can have many LEAVE records (1:M). EMPLOYEE can have many SCHEDULE records (1:M). EMPLOYEE can attend many MEETINGS (1:M). EMPLOYEE can have many SALARY records (1:M). Use standard ER diagram notation: - Rectangles for entities - Ovals for attributes - Diamonds for relationships - Clearly mark primary keys (PK) and foreign keys (FK) - Show cardinalities 1:M - Use clean straight connecting lines - Keep EMPLOYEE as the central entity - Arrange the diagram neatly with no overlapping lines - White background, black text and borders - Make all labels large, clear and readable - Suitable for a BCA college project documentation DO NOT include Dashboard, Task, Task Scheduler, or Training. Do not add any extra entities or attributes.
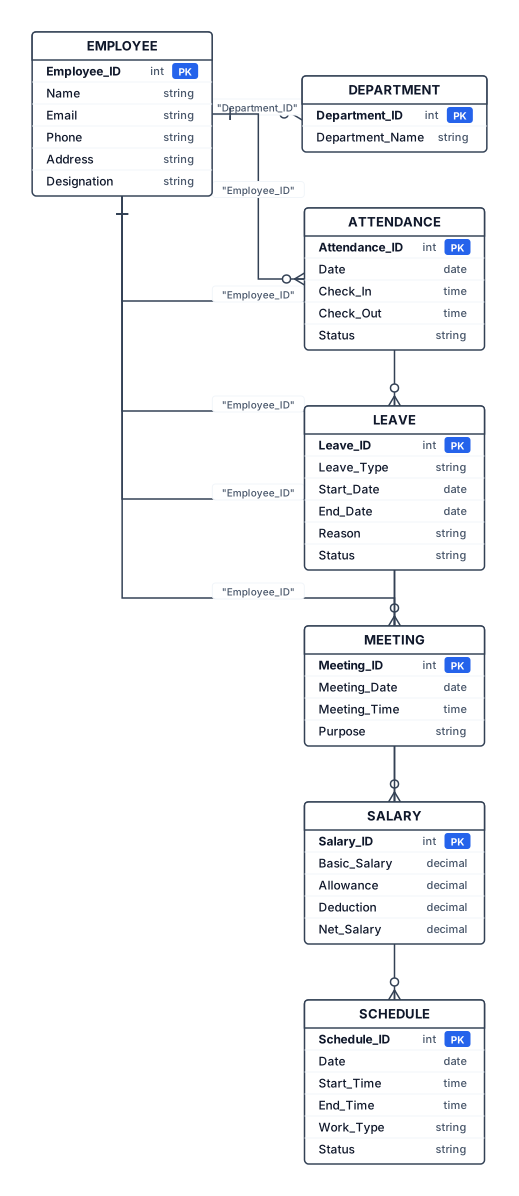
Entities & important attributes EMPLOYEE Employee_ID (PK) Name Email Phone Address Department_ID (FK) Designation DEPARTMENT Department_ID (PK) Department_Name ATTENDANCE Attendance_ID (PK) Employee_ID (FK) Date Check_In Check_Out Status LEAVE Leave_ID (PK) Employee_ID (FK) Leave_Type Start_Date End_Date Reason Status MEETING Meeting_ID (PK) Employee_ID (FK) Meeting_Date Meeting_Time Purpose SALARY Salary_ID (PK) Employee_ID (FK) Basic_Salary Allowance Deduction Net_Salary SCHEDULE Schedule_ID (PK) Employee_ID (FK) Date Start_Time End_Time Work_Type Status

Crea un DIAGRAMA JERÁRQUICO sobre la CLASIFICACIÓN DE VEHÍCULOS. TEMA CENTRAL: VEHÍCULOS PRIMER NIVEL: 1. VEHÍCULOS LIGEROS 2. VEHÍCULOS PESADOS 3. VEHÍCULOS DE CONSTRUCCIÓN 4. VEHÍCULOS DE AGRICULTURA SEGUNDO NIVEL: VEHÍCULOS LIGEROS: - Sedán - Hatchback - Coupé - Station Wagon - SUV - Pick Up - VAN - Peso bruto vehicular: hasta 3500 kg. VEHÍCULOS PESADOS: - Transporte de personas - Transporte de carga VEHÍCULOS DE CONSTRUCCIÓN: - Utilizados en arquitectura e ingeniería - Actividades de construcción VEHÍCULOS DE AGRICULTURA: - Utilizados en sembrío - Utilizados en cosecha DISEÑO: - Formato de árbol jerárquico. - "VEHÍCULOS" debe estar arriba o al centro. - Las 4 categorías deben salir directamente de "VEHÍCULOS". - Cada categoría debe conectarse con sus subcategorías. - Usar cuadros conectados con líneas. - Diseño académico y profesional. - Texto corto y legible. - No inventar nuevas categorías. - No eliminar ninguna subcategoría. - Todo debe estar escrito en español.
Focused examples and prompt ideas
Start with the complete visitor wall above, then use these focused collections when you want a narrower subject and more prompt context.
The first curated collection is being prepared.