
Please create a fish bone diagram.
NODE ARCHIVE · REAL DIAGRAM BRIEFS
Diagram Examples from Real Visitor Prompts
Browse eligible diagrams shared by FreeDiagram visitors, inspect the exact prompts, and build your own version.
Browse 1016 real creationsCOMMUNITY OUTPUTS · EXACT PROMPTS
Main diagram studio
Showing 385–408 of 608. No stock examples or system defaults. Choose a tool, study a real result, then reopen its prompt as your starting point.
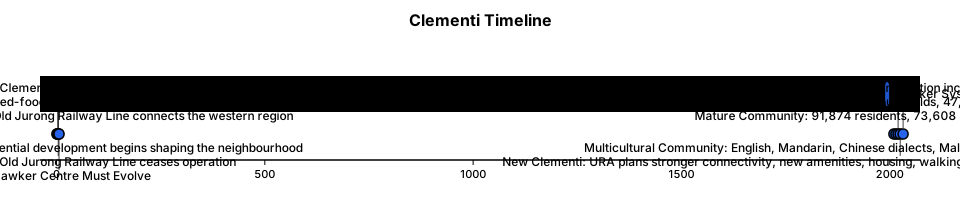
A historical timeline of: 1960s RAILWAY + INDUSTRIAL CLEMENTI Old Jurong Railway Line connects the western region. ↓ 1970s HDB CLEMENTI Large-scale residential development begins shaping the neighbourhood. ↓ 1970s CLEMENTI 2 MARKET Market + cooked-food centre becomes neighbourhood infrastructure. ↓ 1989–1998 HAWKER SYSTEM UNDER PRESSURE Government-market/hawker-centre stalls fall from 5,613 to 3,614 nationally. ↓ 1990s RAILWAY DISAPPEARS Old Jurong Railway Line ceases operation. ↓ 2010 MATURE COMMUNITY 91,874 residents 73,608 HDB-related population. ↓ 2015 MULTICULTURAL COMMUNITY English, Mandarin, Chinese dialects, Malay and Tamil remain major home languages. ↓ 2020 STABLE BUT CHANGING 91,990 residents 33,609 households 47,609 employed residents 15,910 students. ↓ 2020s AGEING INFRASTRUCTURE Clementi 2 identified as eligible for HUP 2.0. ↓ 2025 NEW CLEMENTI URA plans stronger connectivity, new amenities, housing, walking/cycling infrastructure and heritage/ecological connections. ↓ 2032 CROSS ISLAND LINE Planned Clementi station increases future connectivity. ↓ FUTURE THE HAWKER CENTRE MUST EVOLVE
A mind mapof a historical timeline for 1960s RAILWAY + INDUSTRIAL CLEMENTI Old Jurong Railway Line connects the western region. ↓ 1970s HDB CLEMENTI Large-scale residential development begins shaping the neighbourhood. ↓ 1970s CLEMENTI 2 MARKET Market + cooked-food centre becomes neighbourhood infrastructure. ↓ 1989–1998 HAWKER SYSTEM UNDER PRESSURE Government-market/hawker-centre stalls fall from 5,613 to 3,614 nationally. ↓ 1990s RAILWAY DISAPPEARS Old Jurong Railway Line ceases operation. ↓ 2010 MATURE COMMUNITY 91,874 residents 73,608 HDB-related population. ↓ 2015 MULTICULTURAL COMMUNITY English, Mandarin, Chinese dialects, Malay and Tamil remain major home languages. ↓ 2020 STABLE BUT CHANGING 91,990 residents 33,609 households 47,609 employed residents 15,910 students. ↓ 2020s AGEING INFRASTRUCTURE Clementi 2 identified as eligible for HUP 2.0. ↓ 2025 NEW CLEMENTI URA plans stronger connectivity, new amenities, housing, walking/cycling infrastructure and heritage/ecological connections. ↓ 2032 CROSS ISLAND LINE Planned Clementi station increases future connectivity. ↓ FUTURE THE HAWKER CENTRE MUST EVOLVE
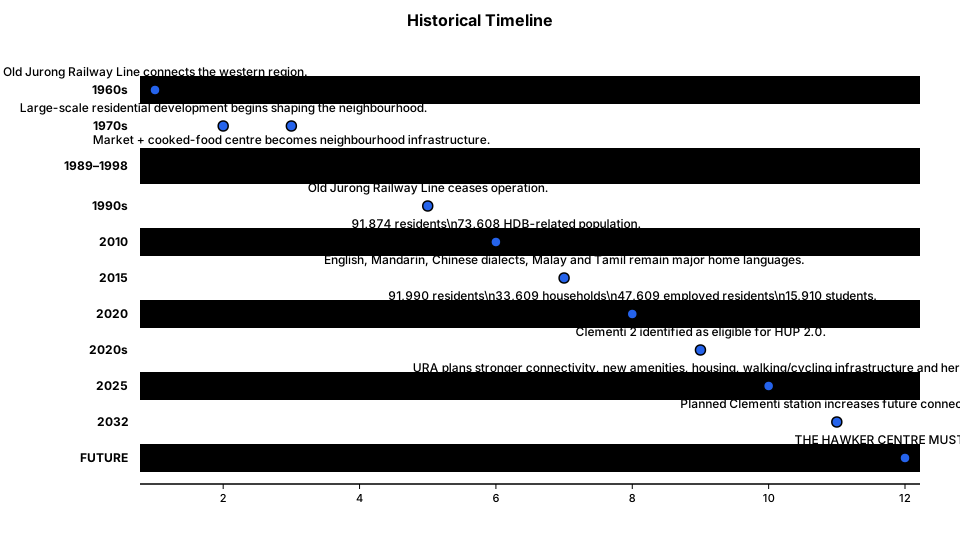
timeline of Historical Timeline: 1960s RAILWAY + INDUSTRIAL CLEMENTI Old Jurong Railway Line connects the western region. ↓ 1970s HDB CLEMENTI Large-scale residential development begins shaping the neighbourhood. ↓ 1970s CLEMENTI 2 MARKET Market + cooked-food centre becomes neighbourhood infrastructure. ↓ 1989–1998 HAWKER SYSTEM UNDER PRESSURE Government-market/hawker-centre stalls fall from 5,613 to 3,614 nationally. ↓ 1990s RAILWAY DISAPPEARS Old Jurong Railway Line ceases operation. ↓ 2010 MATURE COMMUNITY 91,874 residents 73,608 HDB-related population. ↓ 2015 MULTICULTURAL COMMUNITY English, Mandarin, Chinese dialects, Malay and Tamil remain major home languages. ↓ 2020 STABLE BUT CHANGING 91,990 residents 33,609 households 47,609 employed residents 15,910 students. ↓ 2020s AGEING INFRASTRUCTURE Clementi 2 identified as eligible for HUP 2.0. ↓ 2025 NEW CLEMENTI URA plans stronger connectivity, new amenities, housing, walking/cycling infrastructure and heritage/ecological connections. ↓ 2032 CROSS ISLAND LINE Planned Clementi station increases future connectivity. ↓ FUTURE THE HAWKER CENTRE MUST EVOLVE
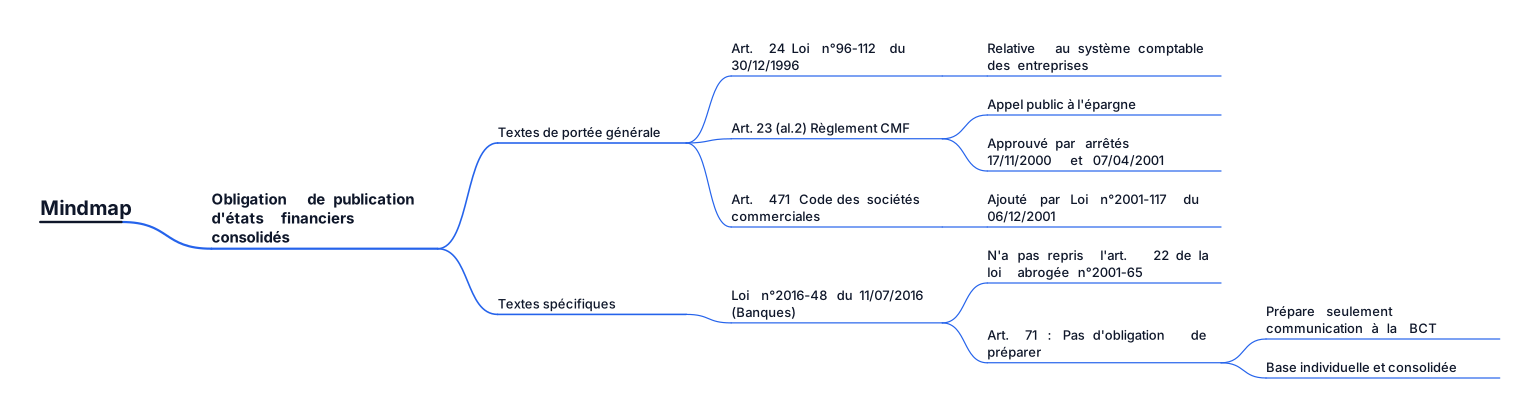
Quelssont lestextesédictantuneobligationdepublicationd’étatsfinanciers consolidés? Textesdeportéegénérale: • Article24delaloin°96-112du30 décembre1996relativeausystème comptabledesentreprises. • Article23(alinéa2)duRèglement du CMF relatif à l’appel public à l’épargne tel qu’approuvé par les arrêtésduministredes financesdu 17 novembre 2000 et du 7 Avril 2001. • Article 471 du code des sociétés commerciales, ajouté par la loi n°2001-117du6décembre2001. Textesspécifiques: • La loi n° 2016-48 du 11 juillet 2016 relative aux banques et aux établissements financiers n’a pas repris les dispositions de l’article 22de la loi abrogée n° 2001-65 du 10 juillet 2001 relativeauxétablissementsdecrédit. • L’article71de la loi n° 2016-48du11 juillet 2016 relativeauxbanqueset aux établissements financiers, n’édicte pas une obligation de préparer des états financiers consolidés mais prévoit seulementlacommunicationàlaBCTdes données sur la situation comptable sur baseindividuelleetconsolidée
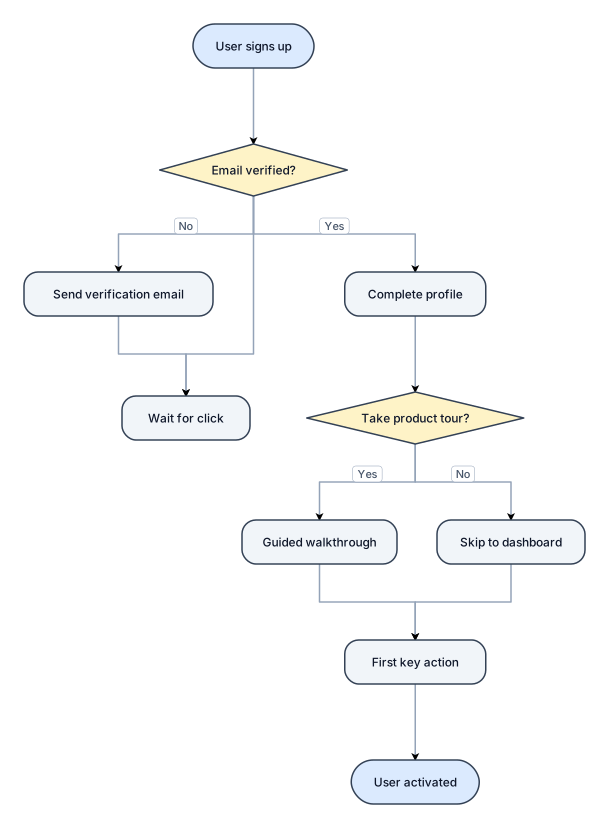
A flowchart of a new-user onboarding flow from signup to first activation, with a verification branch
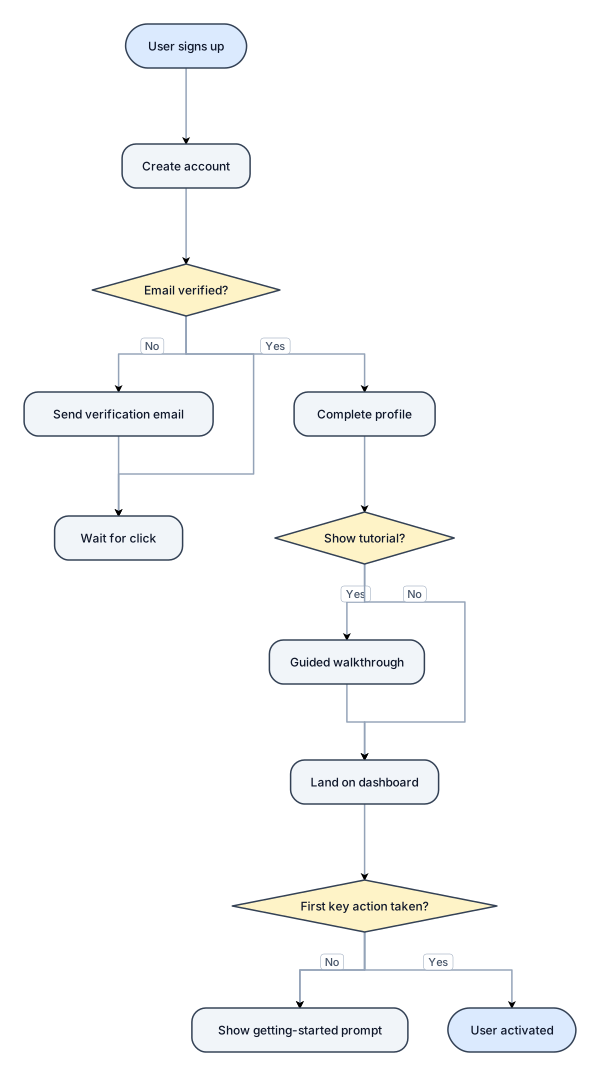
A flowchart of a new-user onboarding flow from signup to first activation, with a verification branch
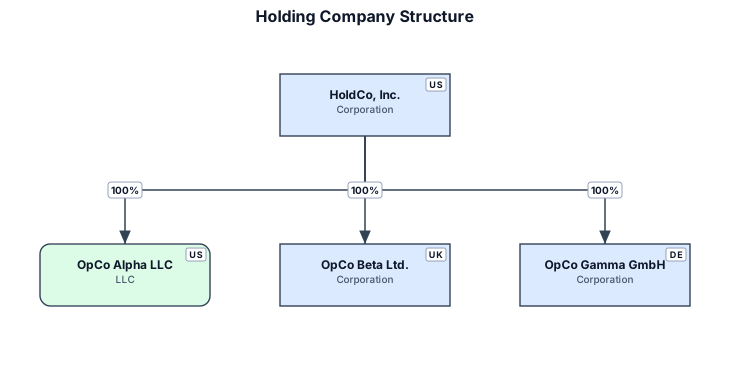
A legal entity structure for a holding company owning three operating subsidiaries with ownership percentages
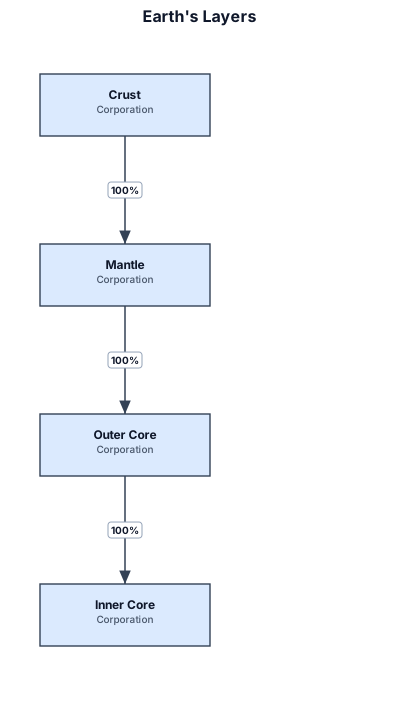
Earth's layers diagrame

Earth's layers diagram

Earth's layers
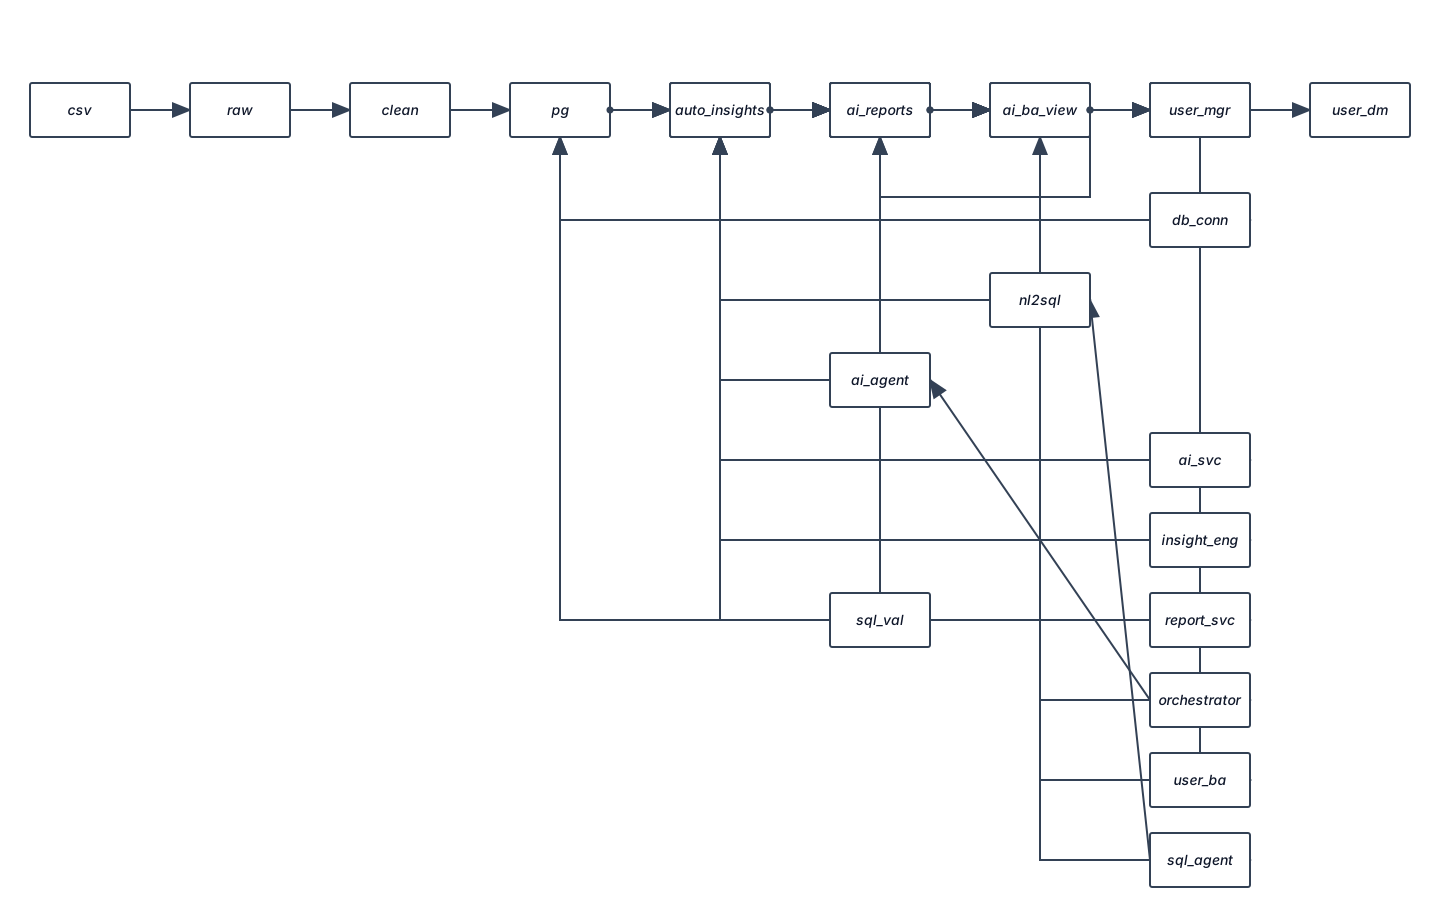
Create a professional system architecture diagram for an AI-Assisted Retail Intelligence System built using the Dunnhumby Complete Journey dataset. Use a clean enterprise architecture style with clear layers and directional arrows. LAYERS: 1. DATA LAYER - Dunnhumby Complete Journey CSV files - Raw Data - Cleaned Data - PostgreSQL Database 2. ANALYTICS LAYER - SQL Analytics - Revenue Analytics - Customer Analytics - Product & Sales Analytics - Marketing & Promotion Analytics - RFM Segmentation - Promotion Effectiveness 3. AI / INTELLIGENCE LAYER - Gemini AI - Natural Language → SQL - SQL Validation / Read-Only Security - AI Business Analyst - Automated Business Insights - AI Business Analyst Agent - Automated Analysis Pipeline - AI Business Reports 4. BACKEND LAYER - FastAPI - Database Connection - AI Service - SQL Agent - Insight Engine - Report Service - Analysis/Agent Orchestrator 5. FRONTEND LAYER - Executive Overview - Customer Intelligence - Product & Sales - Marketing & Promotions - AI Business Analyst 6. USER LAYER - Business Manager - Business Analyst - Retail Decision Maker SHOW THESE MAIN FLOWS: Dunnhumby Dataset → PostgreSQL → Analytics Layer → FastAPI Backend → Frontend User Question → AI Business Analyst → Gemini → SQL Generation → SQL Validation → PostgreSQL → Results → Gemini Business Explanation → Frontend PostgreSQL Analytics → Automated Insight Engine → AI Agent → Recommendations → Dashboard / Business Report Use arrows to clearly indicate data flow. Keep the diagram readable and suitable for a university capstone report and professional presentation. Do not add technologies that are not specified.
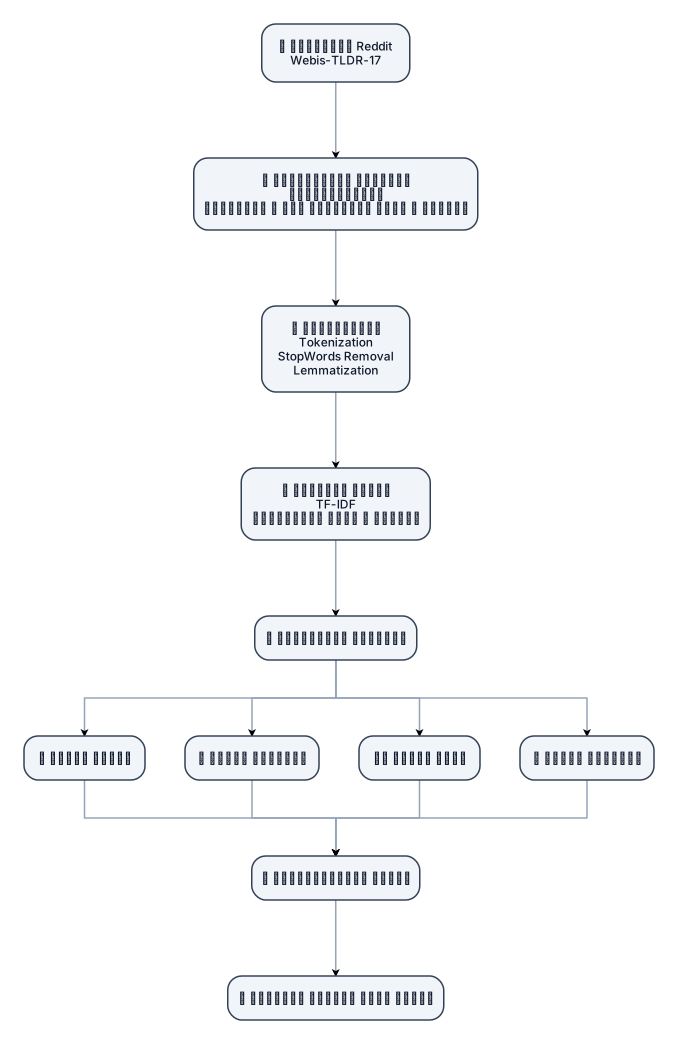
یک دیاگرام حرفهای و مینیمال برای اسلاید دفاع پایاننامه طراحی کن با عنوان «معماری کلی پژوهش». ساختار دیاگرام به صورت یک جریان مرحلهای باشد: دادههای Reddit Webis-TLDR-17 ↓ آمادهسازی دادهها نمونهبرداری پاکسازی و حذف دادههای ناقص و تکراری ↓ پیشپردازش Tokenization StopWords Removal Lemmatization ↓ استخراج ویژگی TF-IDF ویژگیهای متنی و رفتاری ↓ تحلیلهای چندبعدی این بخش به چهار شاخه تقسیم شود: • تحلیل محتوا • تحلیل کاربران • تحلیل گراف • تحلیل احساسات ↓ یکپارچهسازی نتایج ↓ پروفایل رفتاری جامع کاربر طراحی مناسب ارائه دانشگاهی و دفاع پایاننامه باشد. چیدمان منظم، ساده و خوانا باشد. از باکسهای مدرن، فلشهای واضح و آیکونهای ساده استفاده شود. متنها کوتاه باشند و از شلوغی جلوگیری شود. تمرکز اصلی روی مسیر «داده → پردازش → تحلیل → پروفایل رفتاری» باشد.
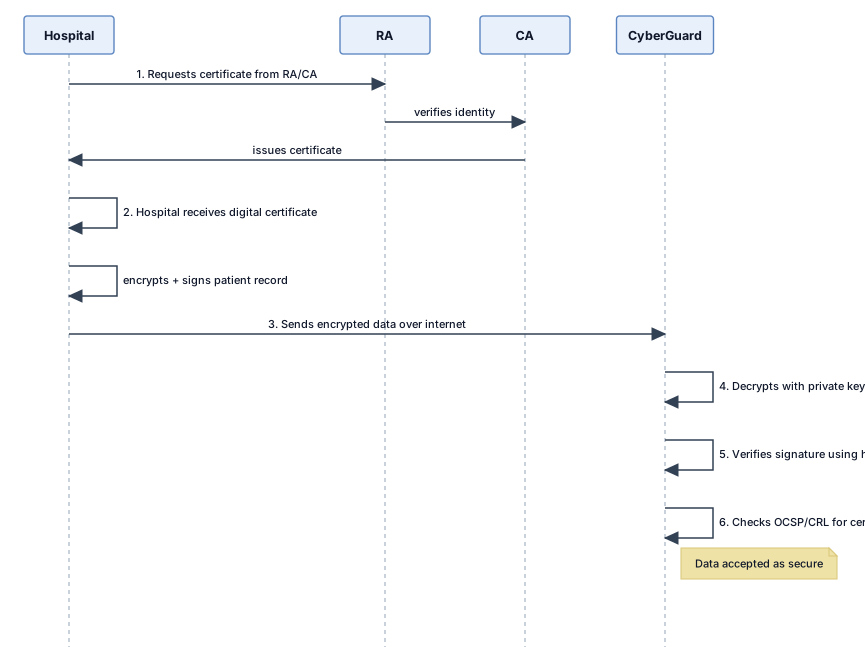
Hospital (sender) | | 1. Requests certificate from RA/CA v RA (verifies identity) --> CA (issues certificate) | | 2. Hospital receives digital certificate v Hospital encrypts + signs patient record | | 3. Sends encrypted data over the internet v CyberGuard (receiver) | | 4. Decrypts with private key | 5. Verifies signature using hospital's public key | 6. Checks OCSP/CRL for certificate status v Data accepted as secure
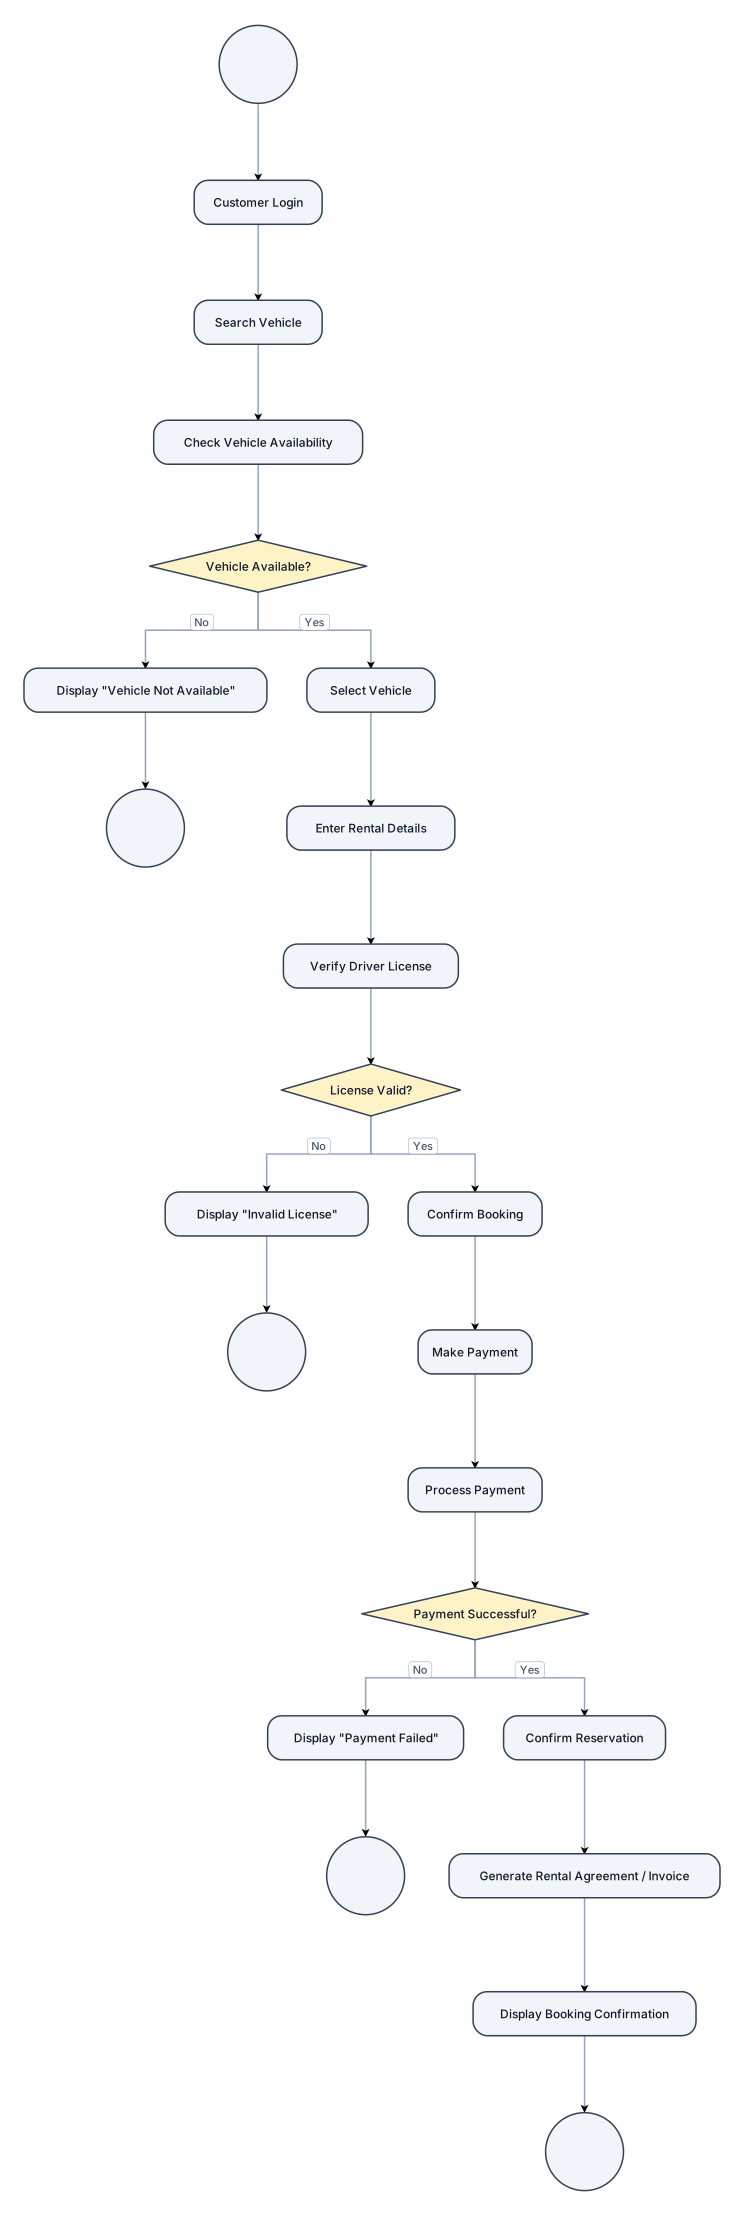
Create a simple UML Activity Diagram for a Vehicle Rental System. Title: Vehicle Booking Process Show ONLY this workflow: START ↓ Customer Login ↓ Search Vehicle ↓ Check Vehicle Availability ↓ [Vehicle Available?] NO → Display "Vehicle Not Available" → END YES → Select Vehicle ↓ Enter Rental Details ↓ Verify Driver License ↓ [License Valid?] NO → Display "Invalid License" → END YES → Confirm Booking ↓ Make Payment ↓ Process Payment ↓ [Payment Successful?] NO → Display "Payment Failed" → END YES → Confirm Reservation ↓ Generate Rental Agreement / Invoice ↓ Display Booking Confirmation ↓ END Use standard UML Activity Diagram notation: - Initial node - Rounded rectangle activity nodes - Diamond decision nodes - Directional arrows - [Yes] and [No] decision guards - Final node IMPORTANT: Keep the diagram simple and compact. Do not add any activities other than those listed. Do not add registration, cancellation, vehicle return, vehicle inspection, refunds, late fees, maintenance, reports, fleet management, notifications, or database activities. Do not create a Use Case Diagram. Do not use actor stick figures or use-case ellipses. Do not expand any activity into additional steps.
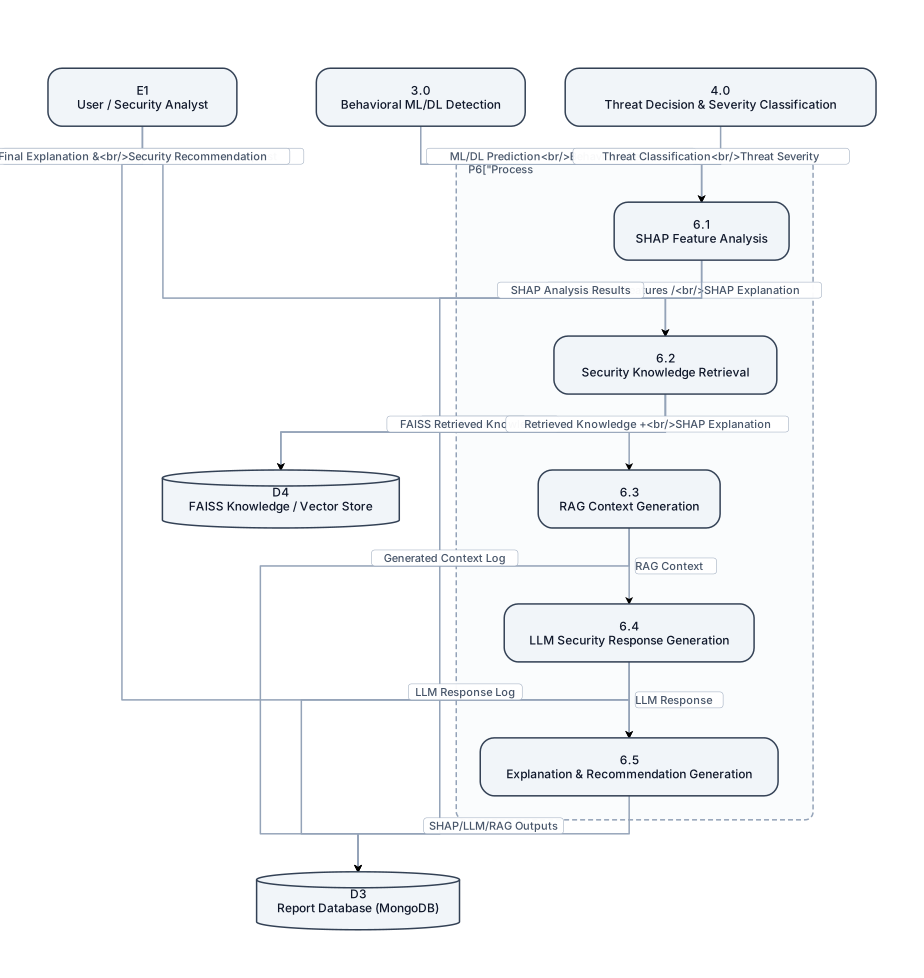
Create a detailed academic DFD Level 2 by decomposing Process 6.0 – LLM + RAG Security Assistant and SHAP Explainability from the Level 1 DFD of the Ransomware Detection and Autonomous Response System. Use standard DFD notation and include E1 User/Security Analyst, 3.0 Behavioral ML/DL Detection and 4.0 Threat Decision & Severity Classification as inputs. Decompose 6.0 into 6.1 SHAP Feature Analysis, 6.2 Security Knowledge Retrieval, 6.3 RAG Context Generation, 6.4 LLM Security Response Generation, and 6.5 Explanation & Recommendation Generation. Include D4 FAISS Knowledge/Vector Store and D3 Report Database (MongoDB). Show flows such as ML/DL Prediction, Behavioral Features, Threat Classification, Threat Severity → SHAP Analysis → Important Features/SHAP Explanation → Knowledge Retrieval → FAISS Retrieved Knowledge → RAG Context → LLM Response → Final Explanation & Security Recommendation → User. Also show User Security Query/Explanation Request entering the system and SHAP/LLM/RAG outputs being stored in MongoDB. Make it large, detailed, readable, professionally arranged, and suitable for a final-year engineering Review 1 PPT. Do not omit SHAP, LLM, RAG, FAISS, MongoDB, user interaction, detection information, explanations, and recommendations.
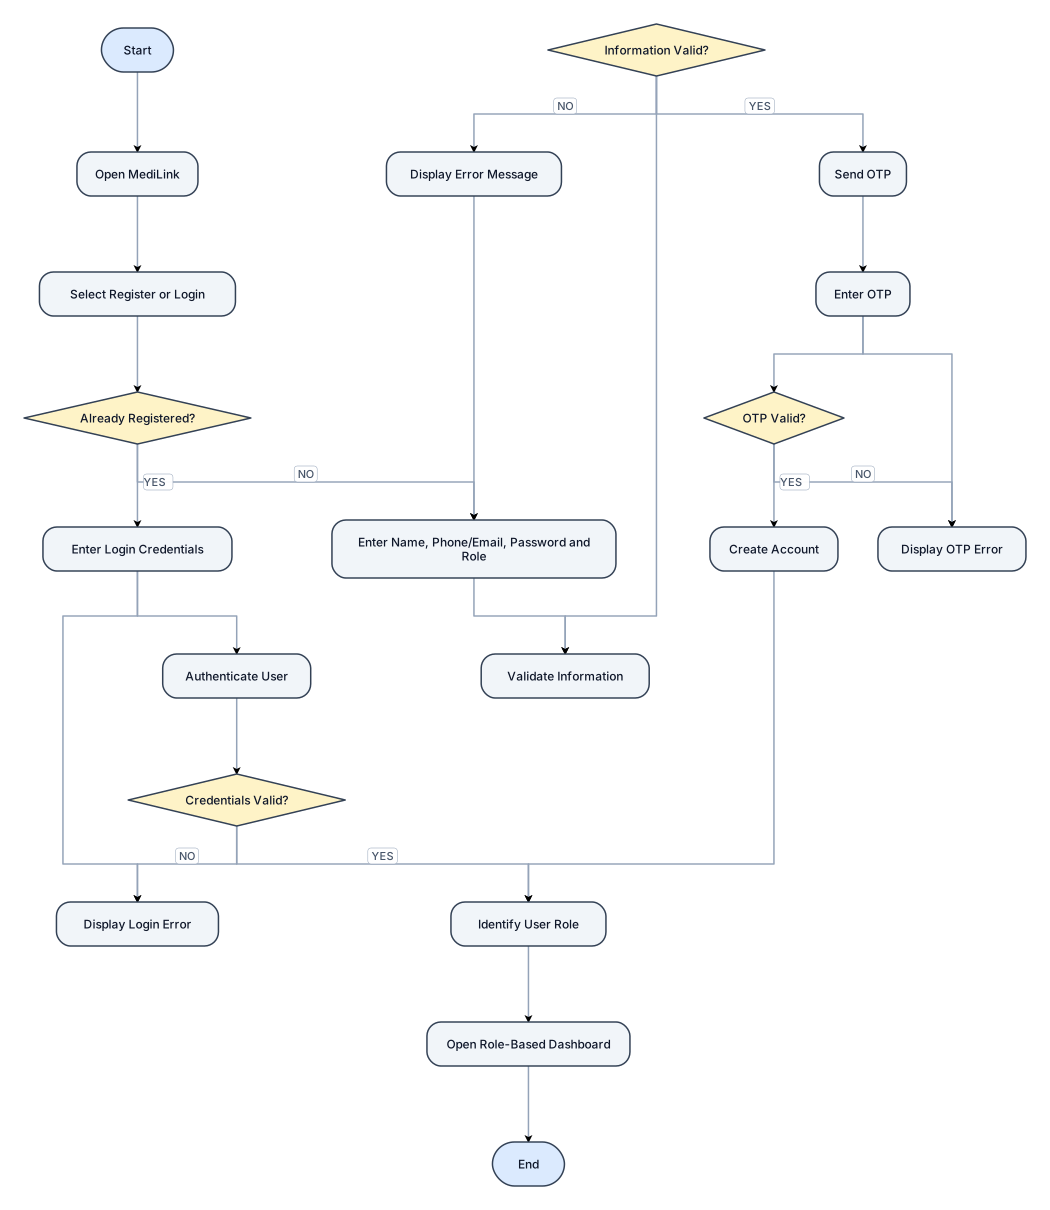
Create a flowchart titled: "Figure 5.1: MediLink User Registration and Login Flowchart" Show the complete authentication workflow. Flow: START → Open MediLink → Select Register or Login → Decision: "Already Registered?" If NO: → Enter Name, Phone/Email, Password and Role → Validate Information → Decision: "Information Valid?" → If NO: Display Error Message → Return to Enter Information → If YES: Send OTP → Enter OTP → Decision: "OTP Valid?" → If NO: Display OTP Error → Return to Enter OTP → If YES: Create Account If YES: → Enter Login Credentials → Authenticate User → Decision: "Credentials Valid?" → If NO: Display Login Error → Return to Login → If YES: Identify User Role Both successful registration and successful login must continue to: → Identify User Role → Open Role-Based Dashboard → END Use standard flowchart symbols and clearly label every YES and NO decision branch.
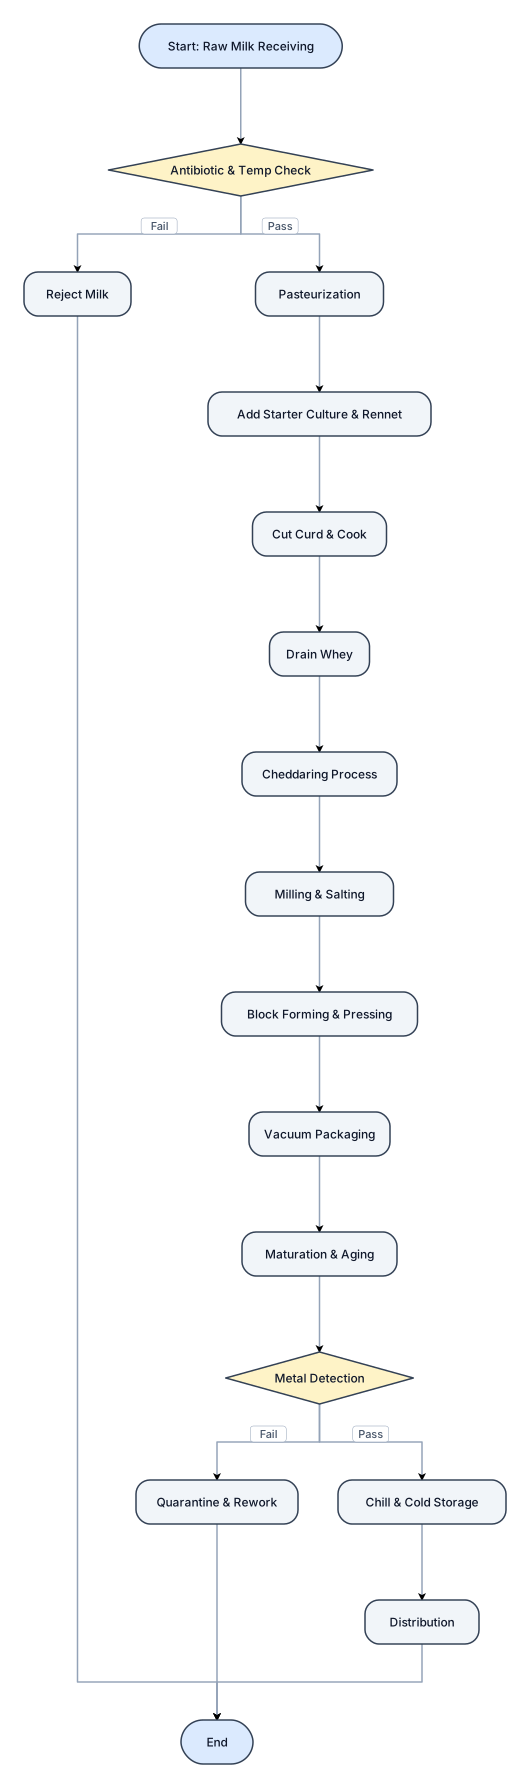
A flowchart of a Chadder Cheese HAcCP

A flowchart for chaddef cheese HACCP
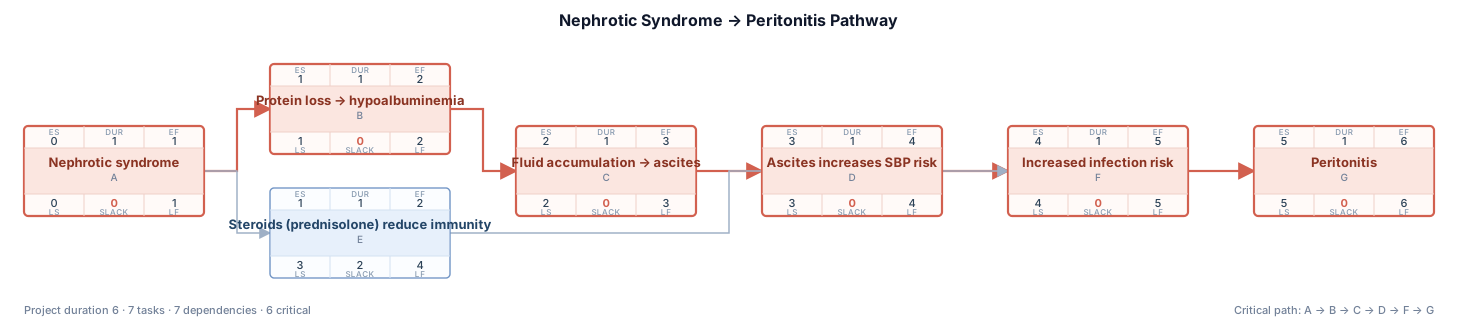
* في nephrotic syndrome يحدث: 1. فقدان بروتينات يؤدي إلى hypoalbuminemia 2. تجمع سوائل في البطن → ascites 3. وجود ascites يزيد خطر spontaneous bacterial peritonitis 4. استخدام steroids (prednisolone) قد يقلل المناعة ويزيد خطر العدوى end: peritonitis
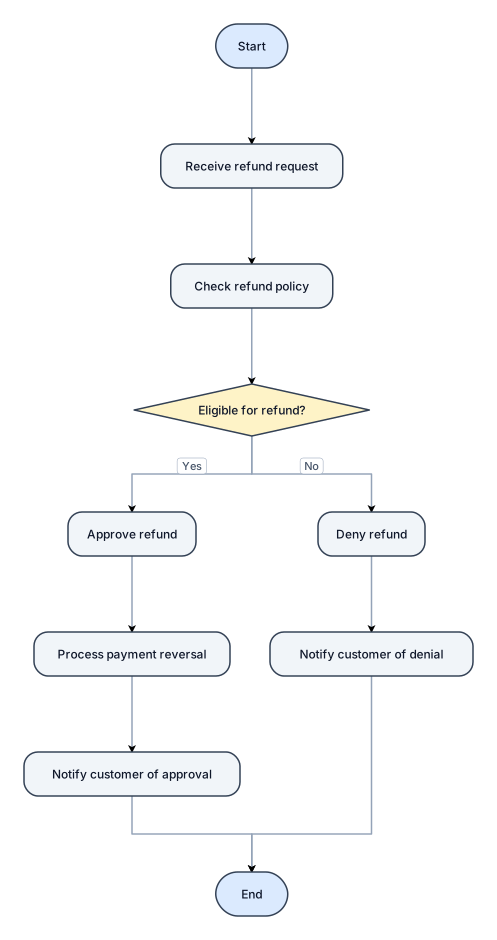
A flowchart for handling a customer refund request, with approve and deny paths
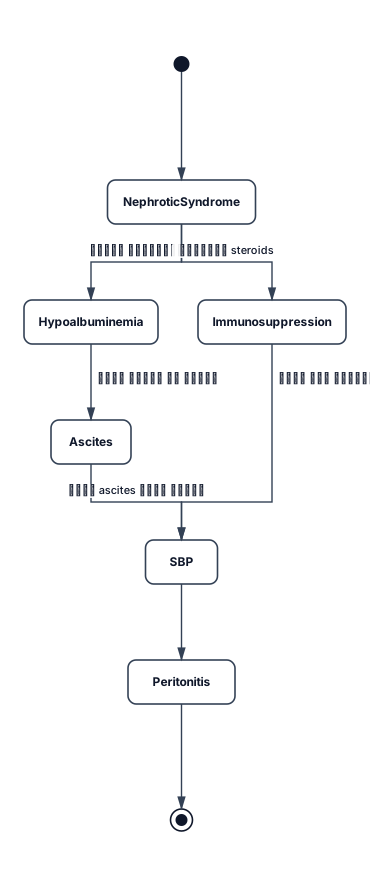
* في nephrotic syndrome يحدث: 1. فقدان بروتينات يؤدي إلى hypoalbuminemia 2. تجمع سوائل في البطن → ascites 3. وجود ascites يزيد خطر spontaneous bacterial peritonitis 4. استخدام steroids (prednisolone) قد يقلل المناعة ويزيد خطر العدوى end: peritonitis
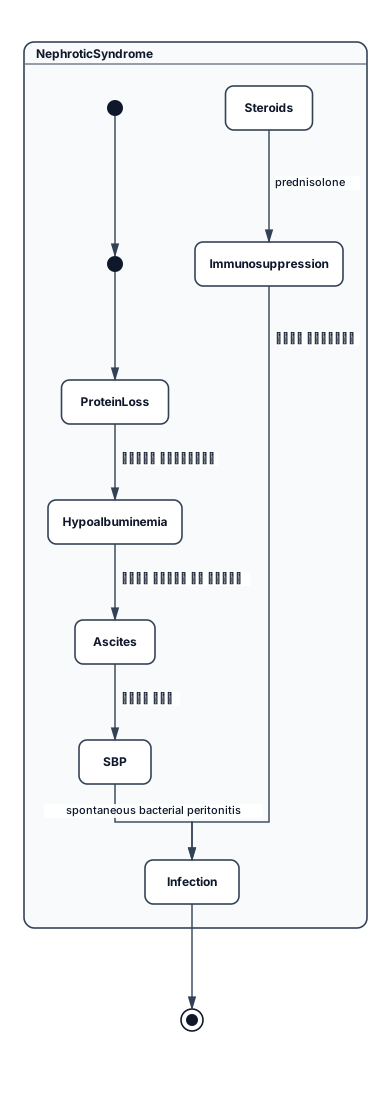
* في nephrotic syndrome يحدث: 1. فقدان بروتينات يؤدي إلى hypoalbuminemia 2. تجمع سوائل في البطن → ascites 3. وجود ascites يزيد خطر spontaneous bacterial peritonitis 4. استخدام steroids (prednisolone) قد يقلل المناعة ويزيد خطر العدوى
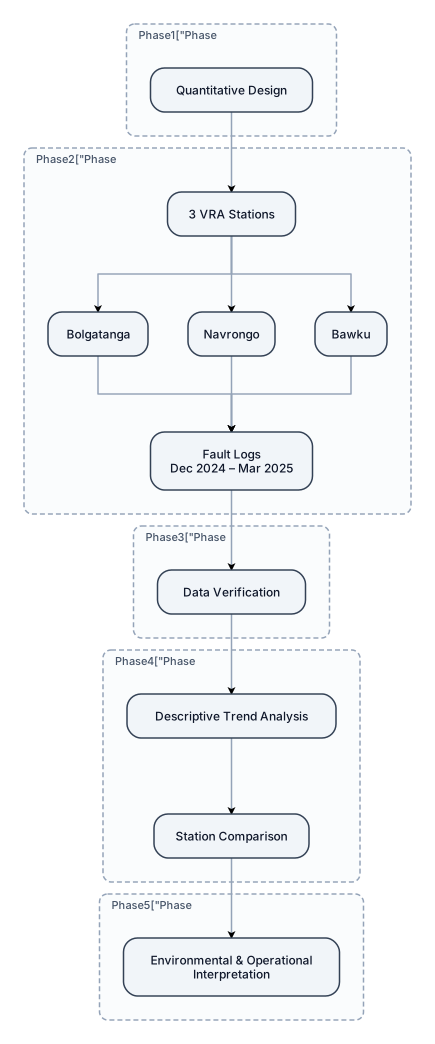
Quantitative Design → 3 VRA Stations (Bolgatanga, Navrongo, Bawku) → Fault Logs (Dec 2024–Mar 2025) → Data Verification → Descriptive Trend Analysis → Station Comparison → Environmental & Operational Interpretation. design it for academic conference paper
Focused examples and prompt ideas
Start with the complete visitor wall above, then use these focused collections when you want a narrower subject and more prompt context.
The first curated collection is being prepared.