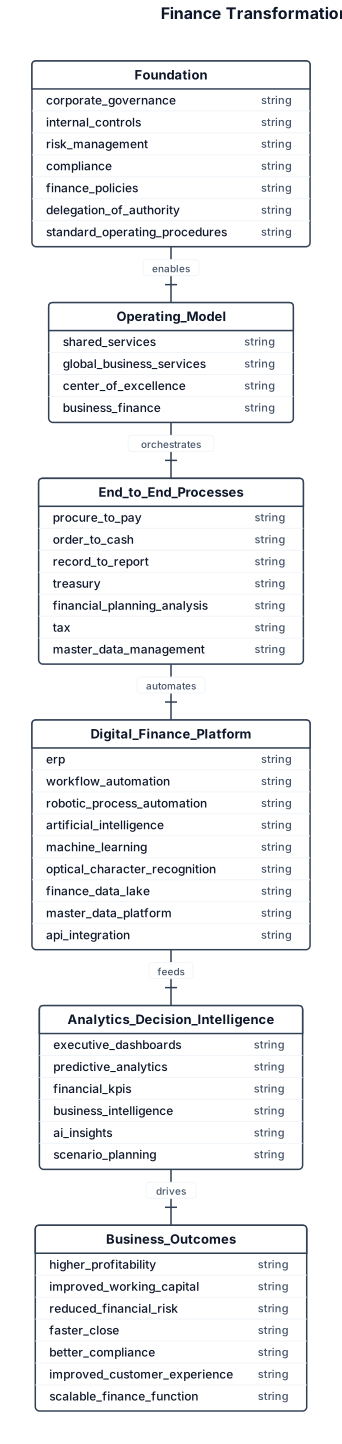
Create a world-class consulting style Finance Transformation Framework similar to the visual quality used by Deloitte, Accenture, PwC, EY and KPMG presentations. This is NOT a flowchart. Design it as a premium executive infographic with a modern business consulting style. Use a layered architecture from bottom to top. Layer 1 (Foundation) Corporate Governance Internal Controls Risk Management Compliance Finance Policies Delegation of Authority Standard Operating Procedures Layer 2 Finance Operating Model Shared Services Global Business Services Center of Excellence Business Finance Layer 3 End-to-End Finance Processes Procure-to-Pay (P2P) Order-to-Cash (O2C) Record-to-Report (R2R) Treasury Financial Planning & Analysis Tax Master Data Management Layer 4 Digital Finance Platform ERP Workflow Automation Robotic Process Automation Artificial Intelligence Machine Learning Optical Character Recognition Finance Data Lake Master Data Platform API Integration Layer 5 Analytics & Decision Intelligence Executive Dashboards Predictive Analytics Financial KPIs Business Intelligence AI Insights Scenario Planning Top Layer Business Outcomes Higher Profitability Improved Working Capital Reduced Financial Risk Faster Close Better Compliance Improved Customer Experience Scalable Finance Function Design requirements Use rounded modern rectangles. Use premium consulting colors. Use subtle gradients. Use clean typography. Use professional business icons. Maintain generous white space. No clipart. No cartoon style. No shadows. Minimal text. Balanced composition. Presentation quality suitable for a Fortune 500 CFO presentation. The final diagram should look like a proprietary consulting framework rather than a software architecture.
Diagram Examples from Real Visitor Prompts
Browse eligible diagrams shared by FreeDiagram visitors, inspect the exact prompts, and build your own version.
Browse 937 real creationsMain diagram studio
Showing 481–504 of 577. No stock examples or system defaults. Choose a tool, study a real result, then reopen its prompt as your starting point.
![Main diagram studio: [8/12, 2:00 AM] Kajuly: One of the most studied examples of inter-organ crosstalk is the gut–brain axis. This term describes the two-way communication](https://psvtykrtciekraoilfux.supabase.co/storage/v1/object/public/gallery-assets/freediagram/feed/38d1ac37-d3e9-4902-98a8-cc943e5a6dab.svg)
[8/12, 2:00 AM] Kajuly: One of the most studied examples of inter-organ crosstalk is the gut–brain axis. This term describes the two-way communication between the gastrointestinal tract and the brain. The gut contains trillions of microorganisms, collectively called the gut microbiota. These microorganisms are involved in digestion, metabolism, immune regulation, and the production of biologically active molecules. The gut can communicate with the brain through several pathways: Gut microbiota → microbial metabolites → blood → brain Gut → immune system → inflammatory signals → brain Gut → enteric nervous system → vagus nerve → brain Microorganisms can produce substances such as short-chain fatty acids (SCFAs), which are produced when certain bacteria break down dietary fiber. These molecules can influence intestinal cells, immune responses, metabolism, and potentially brain function. The communication also works in the opposite direction. The brain can influence the gut through the autonomic nervous system. Stress, neurological disease, medications, and changes in nervous system function can alter intestinal movement, secretion, and other gastrointestinal functions. An imbalance in the gut microbiota is called dysbiosis. Dysbiosis has been investigated in several neurodegenerative diseases, including ALS, FTD, Lewy body diseases, and MSA. However, finding differences in the microbiome does not prove that these differences cause neurodegeneration. Diet, medication, age, physical activity, constipation, and the disease itself can also change the microbiome. Generate a clean text free image with no description and spelling errors [8/12, 2:00 AM] Kajuly: add no extra info too
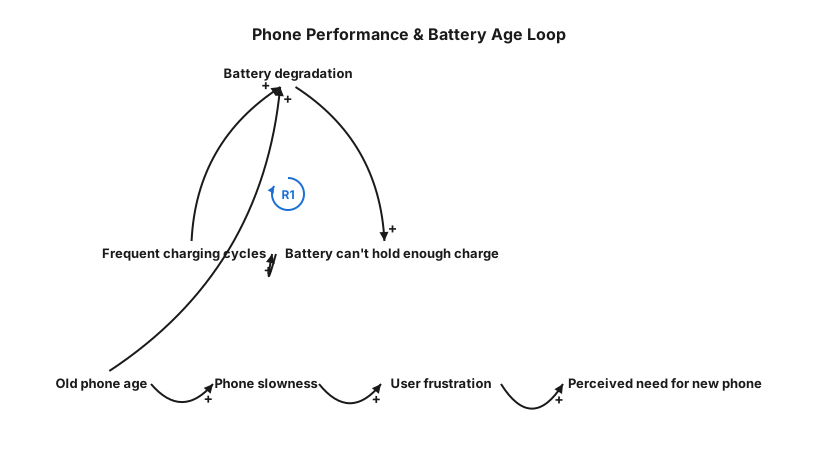
for the issue "My phone is too slow, and its battery can’t hold enough charge because it is old." We’ll use a tool called an annotated causal loop diagram to explore and understand the breadth of the problem at the system level, expanding the system boundary as needed and ensuring that our solution addresses leverage points for improvement. Because the diagram is two dimensional, it can be more effective than text for communicating for a complex, loopy story. Identify one specific aspect of the problem to solve. Choose a central variable that represents that specific aspect of the problem. (1 mark) Add 1-2 affecting variables and link them to the central variable. (1 mark) Add 1-2 affected variables and link them to the central variable. (1 mark) Add 1-2 links from the affected variables to the affecting variables. (1 mark) i wanted it created to be as clear as possible with no overlap
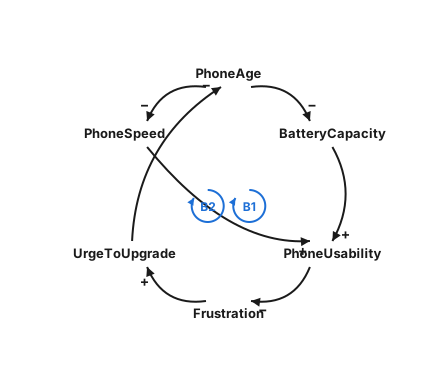
for the issue "My phone is too slow, and its battery can’t hold enough charge because it is old." We’ll use a tool called an annotated causal loop diagram to explore and understand the breadth of the problem at the system level, expanding the system boundary as needed and ensuring that our solution addresses leverage points for improvement. Because the diagram is two dimensional, it can be more effective than text for communicating for a complex, loopy story. Identify one specific aspect of the problem to solve. Choose a central variable that represents that specific aspect of the problem. (1 mark) Add 1-2 affecting variables and link them to the central variable. (1 mark) Add 1-2 affected variables and link them to the central variable. (1 mark) Add 1-2 links from the affected variables to the affecting variables. (1 mark)
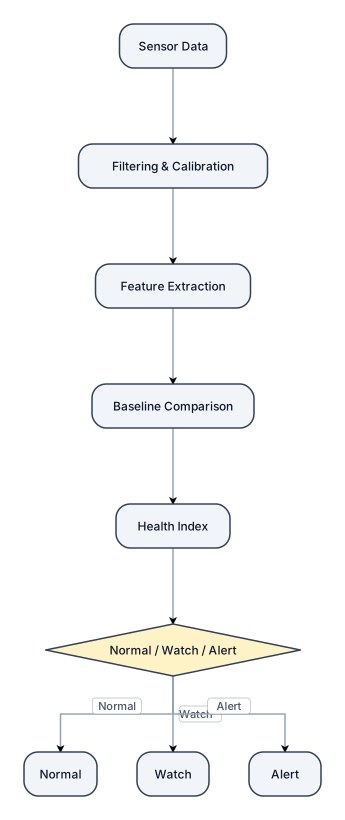
Sensor Data ↓ Filtering & Calibration ↓ Feature Extraction ↓ Baseline Comparison ↓ Health Index ↓ Normal / Watch / Alert
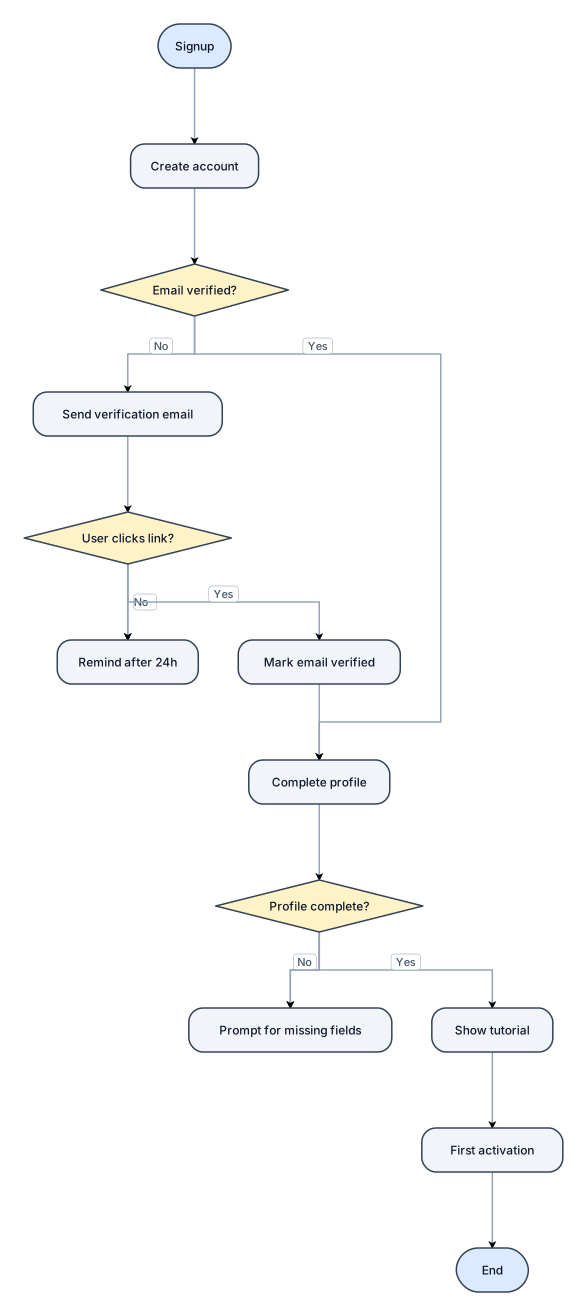
Sensor Data ↓ Filtering & Calibration ↓ Feature Extraction ↓ Baseline Comparison ↓ Health Index ↓ Normal / Watch / AlertA flowchart of a new-user onboarding flow from signup to first activation, with a verification branch
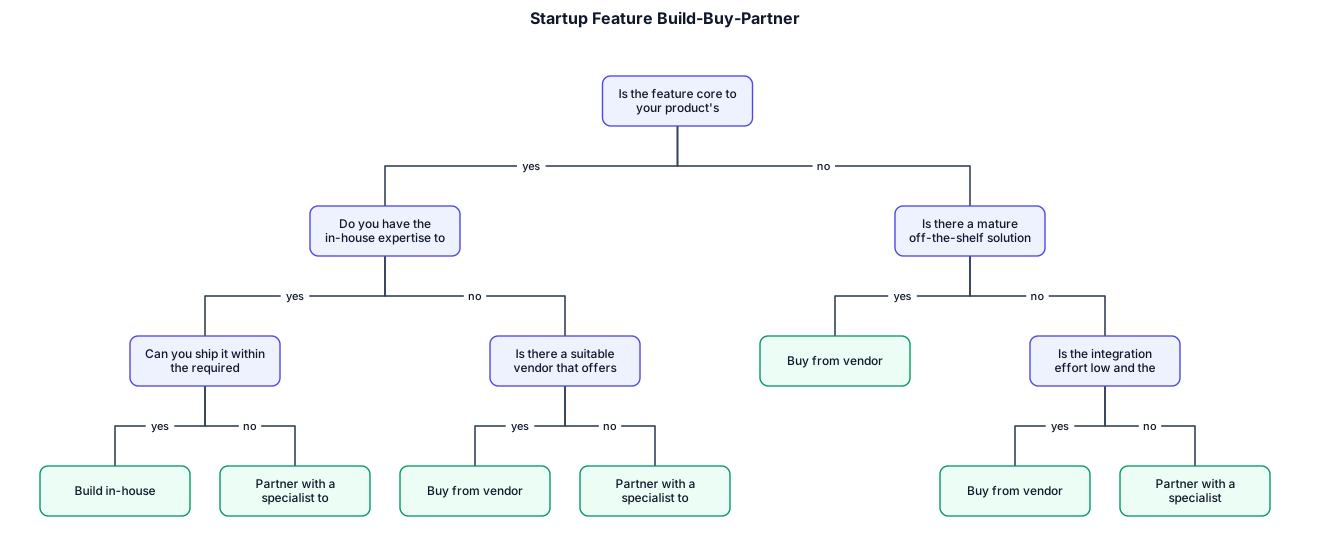
230 V / 12 V TRANSFORMER │ ┌─────────────────┼─────────────────┐ ↓ ↓ ↓ Temperature Current Vibration Sensor Sensor Sensor │ │ │ Ambient Sensor │ │ │ │ │ └─────────────────┼─────────────────┘ ↓ ESP32 ↓ Signal Processing ↓ ┌──────────────────┼─────────────────┐ ↓ ↓ ↓ Temperature Load % Vibration Rise Analysis Analysis RMS/FFT └──────────────────┼─────────────────┘ ↓ Sensor Fusion ↓ HEALTH INDEX ↓ Normal / Watch / Alert ↓ Wi-Fi ↓ ThingSpeak ↓ Dashboard ↓ Staff Monitoring A decision tree for whether a startup should build, buy, or partner for a new feature
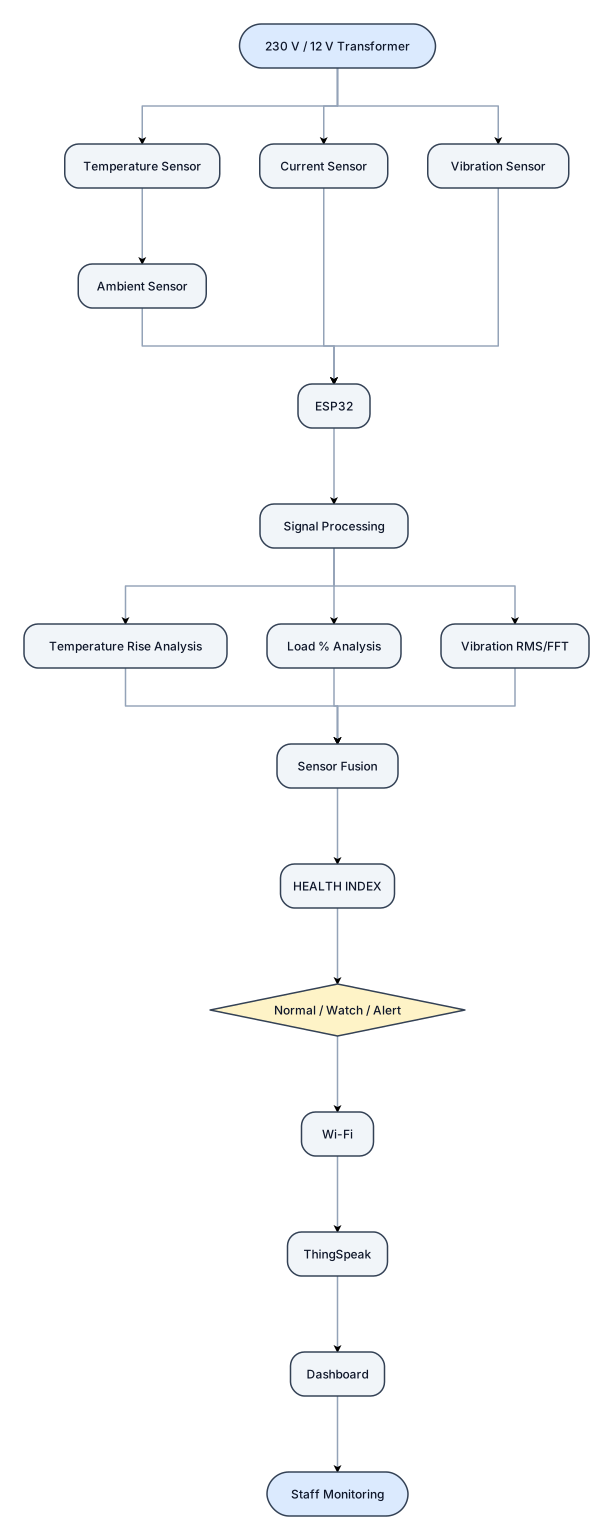
230 V / 12 V TRANSFORMER │ ┌─────────────────┼─────────────────┐ ↓ ↓ ↓ Temperature Current Vibration Sensor Sensor Sensor │ │ │ Ambient Sensor │ │ │ │ │ └─────────────────┼─────────────────┘ ↓ ESP32 ↓ Signal Processing ↓ ┌──────────────────┼─────────────────┐ ↓ ↓ ↓ Temperature Load % Vibration Rise Analysis Analysis RMS/FFT └──────────────────┼─────────────────┘ ↓ Sensor Fusion ↓ HEALTH INDEX ↓ Normal / Watch / Alert ↓ Wi-Fi ↓ ThingSpeak ↓ Dashboard ↓ Staff MonitoringA flowchart of a new-user onboarding flow from signup to first activation, with a verification branch
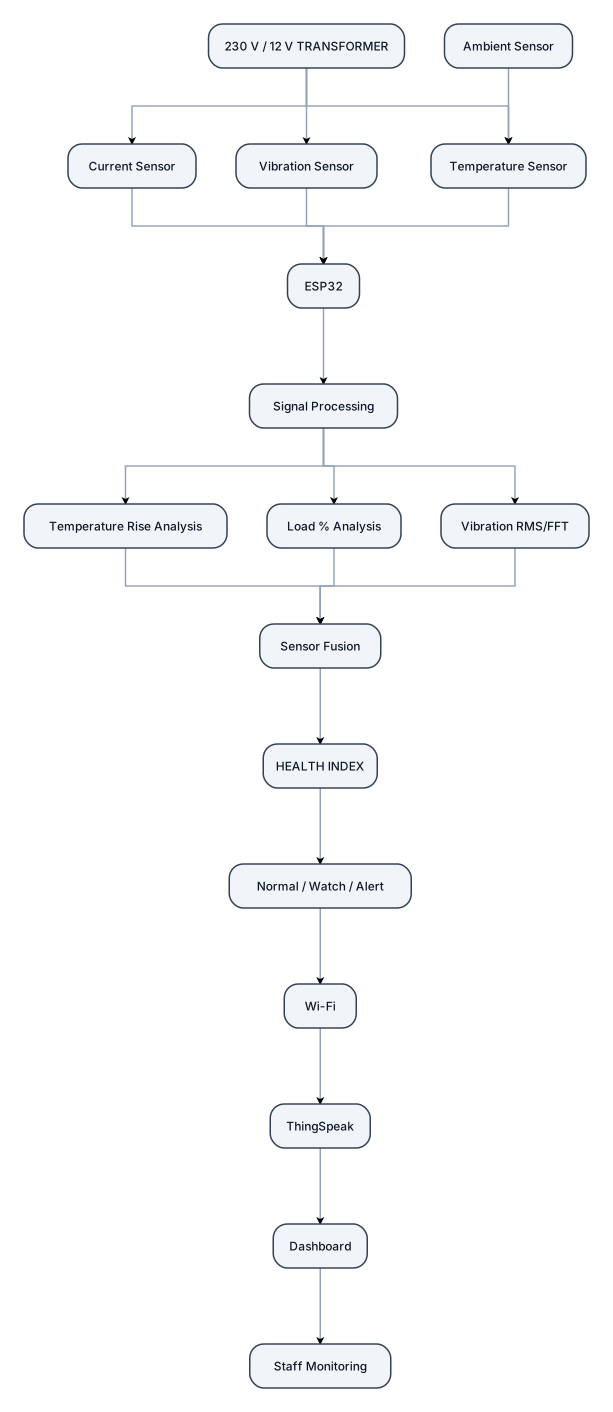
230 V / 12 V TRANSFORMER │ ┌─────────────────┼─────────────────┐ ↓ ↓ ↓ Temperature Current Vibration Sensor Sensor Sensor │ │ │ Ambient Sensor │ │ │ │ │ └─────────────────┼─────────────────┘ ↓ ESP32 ↓ Signal Processing ↓ ┌──────────────────┼─────────────────┐ ↓ ↓ ↓ Temperature Load % Vibration Rise Analysis Analysis RMS/FFT └──────────────────┼─────────────────┘ ↓ Sensor Fusion ↓ HEALTH INDEX ↓ Normal / Watch / Alert ↓ Wi-Fi ↓ ThingSpeak ↓ Dashboard ↓ Staff Monitoring
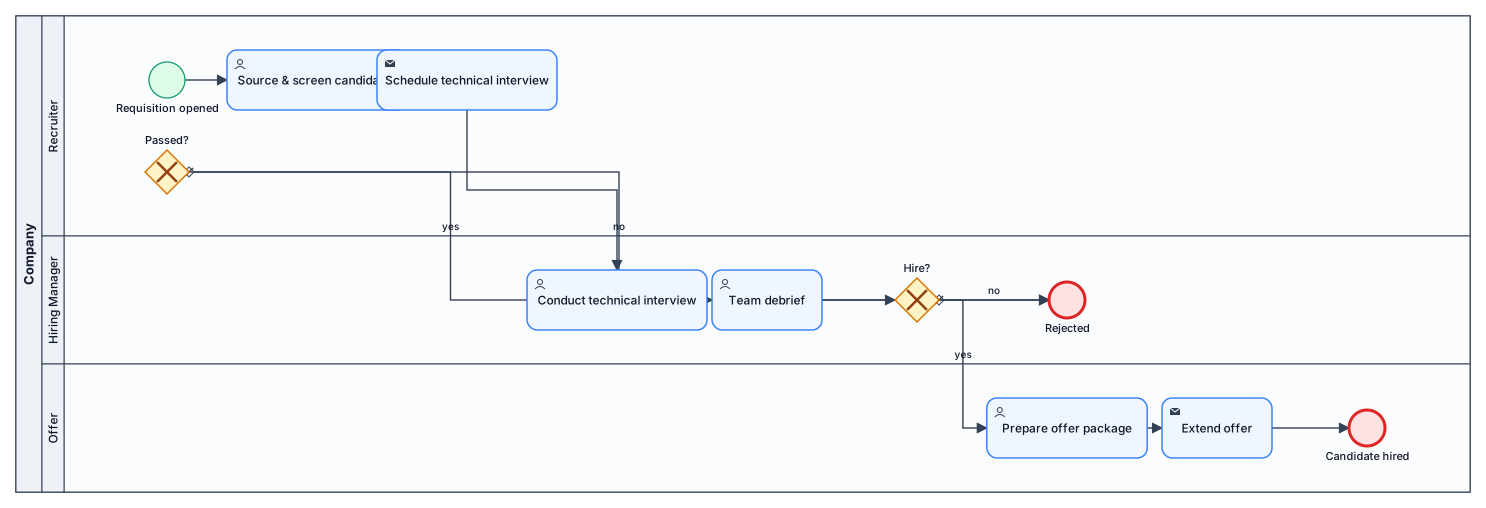
A BPMN diagram of a tech hiring pipeline across recruiter, hiring manager, and offer lanes
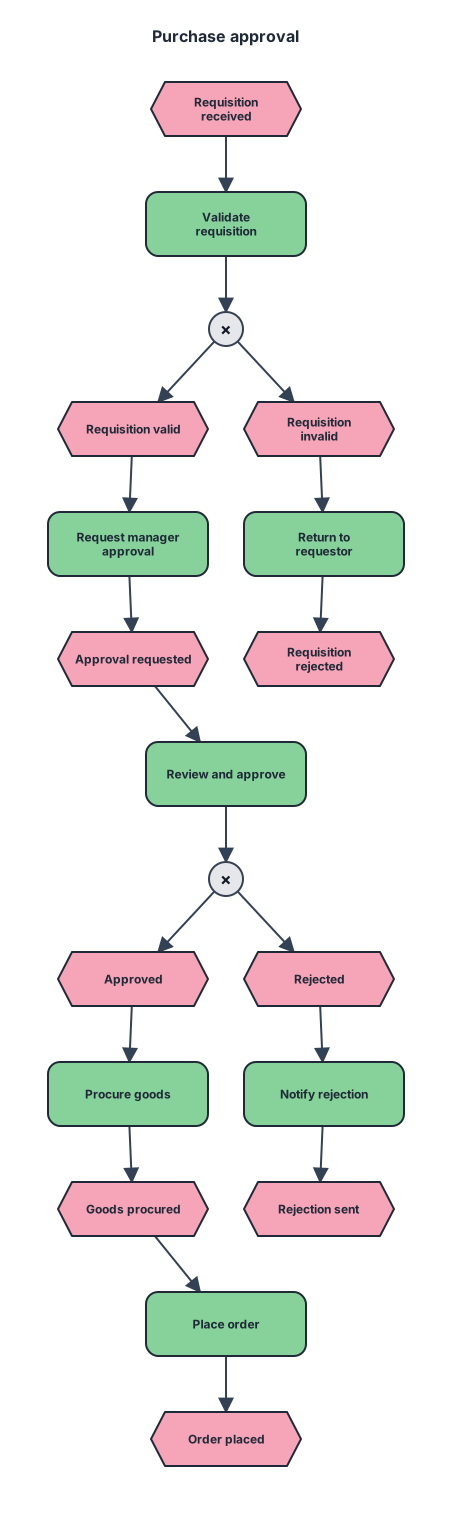
An event-driven process chain for purchase approval from requisition received through manager approval, procurement, and order placed
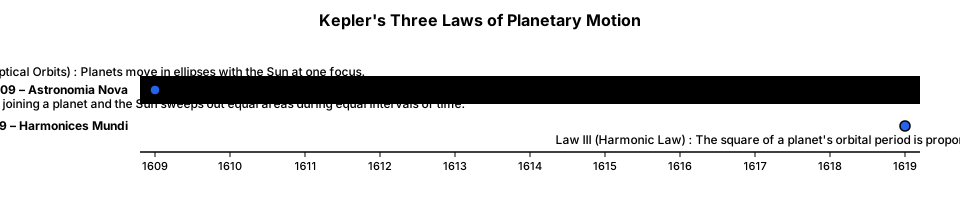
kepler the scientists 3 laws
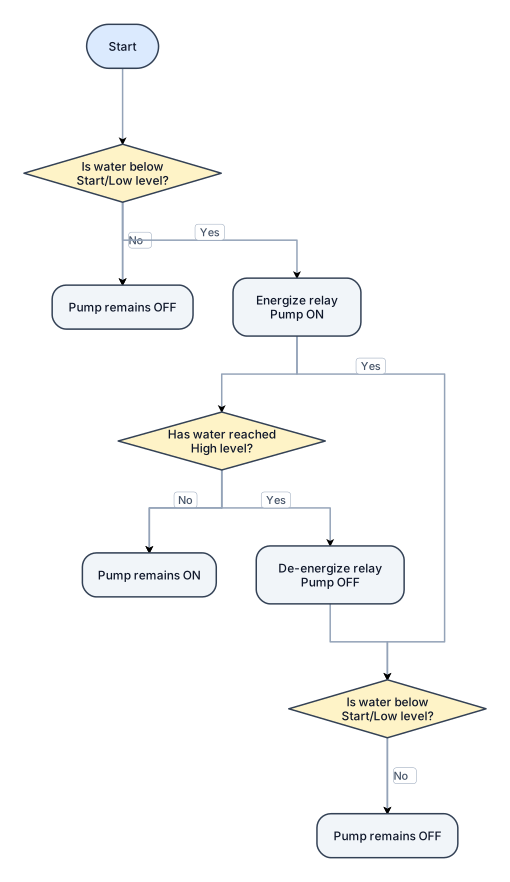
The circuit consists of a 230 V, 50 Hz AC supply, fuse, relay, pump motor, resistor (R), capacitor (C), and three water-level sensing points: Low Level, Start Level, and High Level. Create the flowchart showing the operating sequence: Start → Check water level → Is water below the start/low level? → If YES, energize the relay and switch ON the pump motor → Continue monitoring the water level → Has the water reached the high level? → If NO, keep the pump ON → If YES, de-energize the relay and switch OFF the pump → Continue monitoring the water level → Repeat. Include the following conditions: Water below Start/Low Level: Pump ON. Water between Start and High Level: Pump remains ON while filling. Water reaches High Level: Pump OFF. After the pump turns OFF, continuously monitor the water level. When the water level falls below the required start level again, turn the pump ON. Use standard flowchart symbols: Oval: Start/End Diamond: Decision Rectangle: Pump/relay operation Arrows: Direction of operation Make the final flowchart simple, professional, easy to understand, and suitable for an electrical engineering/college project report.
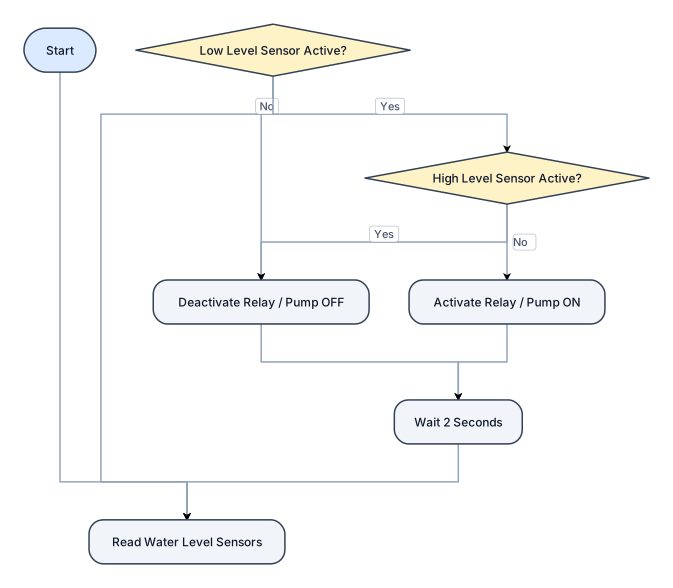
a flowchart for an automatic pump control with water level sensors and relay with 230v ac supply
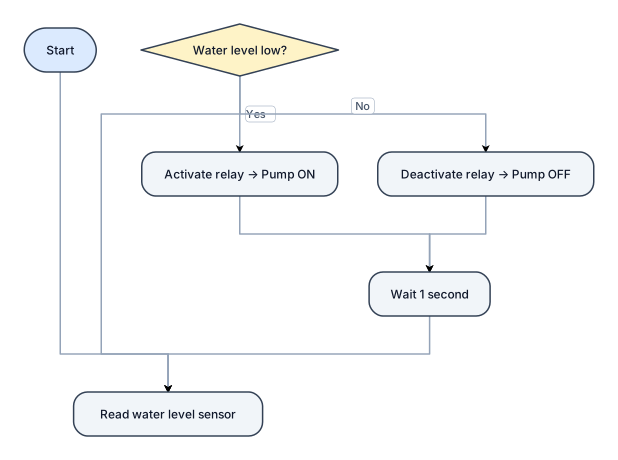
design a flowchart of an automatic pump control with water level sensor with a relay in it
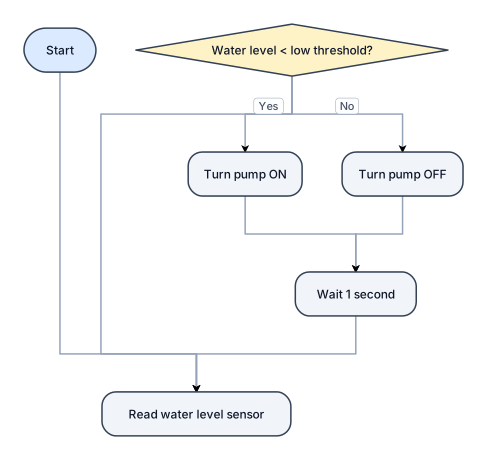
design a flowchart of an automatic pump control with water level sensor
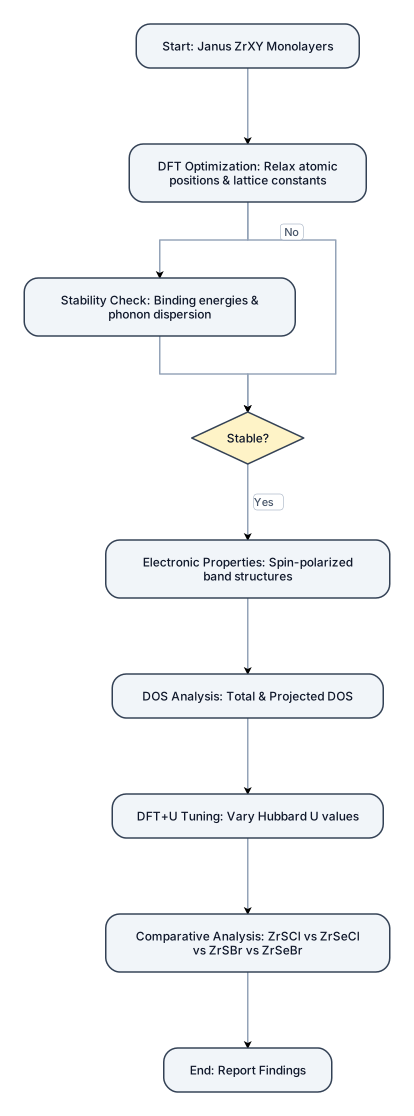
⚛️ Crystal Optimization: Optimize the atomic structures of Janus ZrXY (X = S, Se; Y = Cl, Br) monolayers using Density Functional Theory (DFT). 🧩 Structural Stability: Evaluate binding energies, lattice constants, and phonon dispersion relations to confirm dynamic and mechanical stability. 💡 Electronic Properties: Investigate spin‑polarized electronic band structures to determine metallic or semiconducting behavior. 📊 Density of States (DOS): Analyze total and projected DOS to identify contributions from Zr‑4d orbitals and chalcogen/halogen p‑orbitals. 🔬 Electronic Phase Tuning via DFT+U: Study the effect of varying Hubbard U values on band gaps and spin‑resolved properties. 📈 Comparative Analysis: Compare ZrSCl, ZrSeCl, ZrSBr, and ZrSeBr systematically to highlight the influence of chalcogen and halogen substitution.
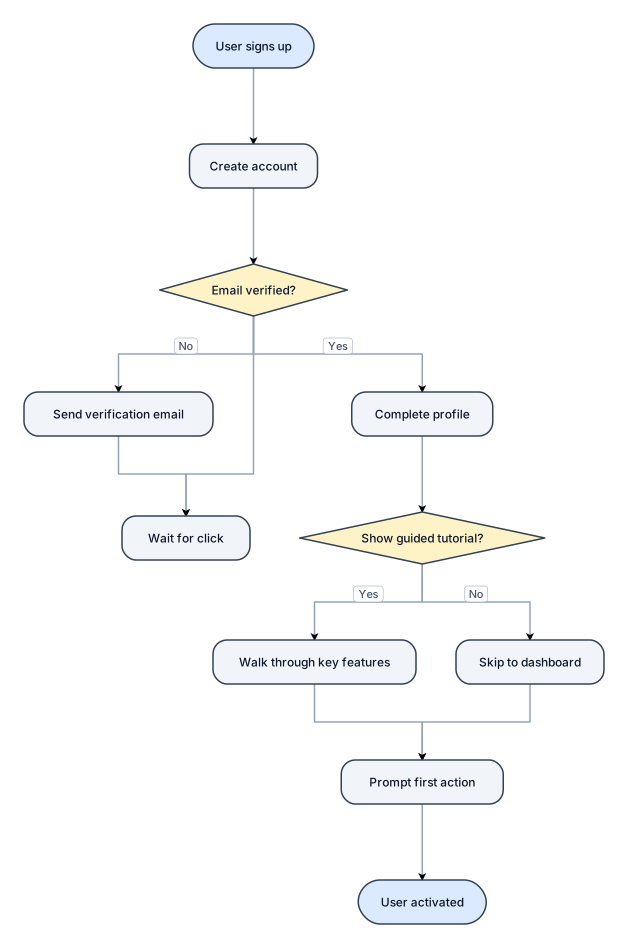
A flowchart of a new-user onboarding flow from signup to first activation, with a verification branch
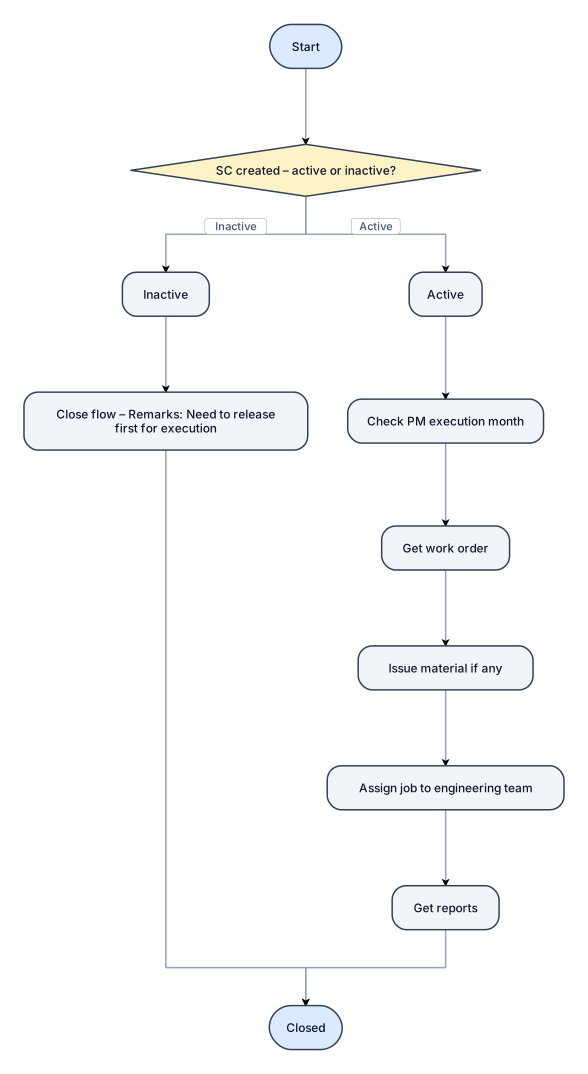
SC created look for active or inactive. If inactive close the flow with remarks need, to release first for executiin. Else check PM execution month, get work order, issue material if any, assign job to engineering team, get reports. Closed
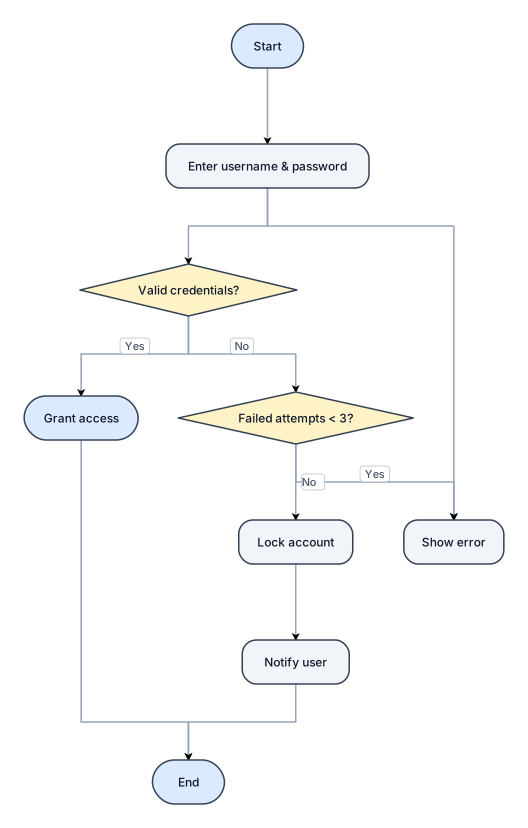
Create a flowchart for a user login system with authentication, password validation, failed-attempt checking, and account locking after 3 failed attempts.

Create a professional block diagram for my college project: "WiFi Penetration Testing and Vulnerability Assessment Tool" The diagram should represent the current system architecture described below. Start with: Security Auditor / User ↓ CLI / Lightweight Dashboard ↓ Reconnaissance Module The Reconnaissance Module performs: - Scan nearby WiFi access points - Identify SSIDs - Identify channels - Identify encryption types ↓ Vulnerability Analysis Module The Vulnerability Analysis Module performs: - Analyze encryption - Detect WPS status - Detect default SSID/configuration - Identify WiFi vulnerabilities After vulnerability analysis, show three parallel modules: 1. Handshake Capture Module - Capture WPA/WPA2 four-way handshake 2. Password Strength Testing Module - Perform authorized password-strength testing 3. Deauthentication Testing Module - Perform controlled deauthentication resilience testing All three modules should connect to: Reporting Module - Compile vulnerability findings - Assign severity levels - Add remediation recommendations - Generate PDF/HTML report Finally: Reporting Module ↓ Vulnerability Assessment Report Use rectangular blocks with arrows showing the direction of data/workflow. Arrange the diagram clearly from top to bottom. Keep it simple, clean, professional, and suitable for a BSc Artificial Intelligence project presentation. Do not add: - Login - Registration - Database - Admin module - Cloud module - Machine learning module Testing must be shown as restricted to authorized WiFi networks.
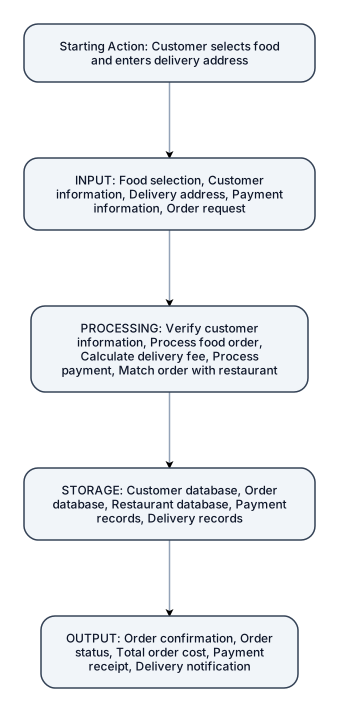
Create a simple vertical system model for an Online Food Delivery System. Follow this exact order: Starting Action → INPUT → PROCESSING → STORAGE → OUTPUT. Starting Action: Customer selects food and enters delivery address. INPUT: Food selection, Customer information, Delivery address, Payment information, Order request. PROCESSING: Verify customer information, Process food order, Calculate delivery fee, Process payment, Match order with restaurant. STORAGE: Customer database, Order database, Restaurant database, Payment records, Delivery records. OUTPUT: Order confirmation, Order status, Total order cost, Payment receipt, Delivery notification. Use clear rectangular boxes, downward arrows, simple academic design, readable labels, and no unnecessary decorations.
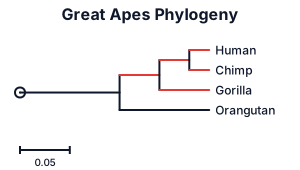
A phylogenetic tree of the great apes showing humans, chimps, gorillas, and orangutans
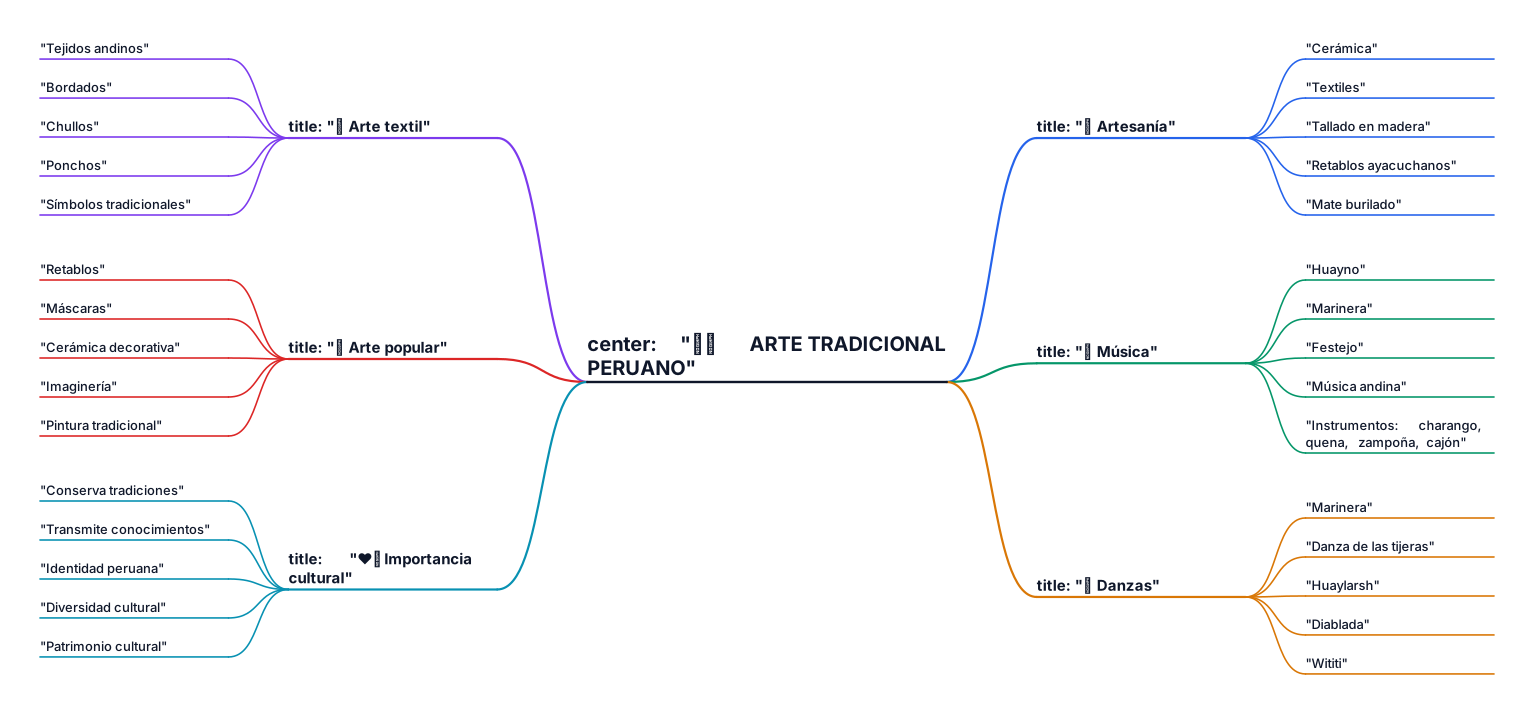
Claro. Este prompt está pensado para pegarlo directamente en una IA de texto → mapa mental, con información resumida y aspecto de trabajo escolar: Crea un mapa mental sobre el Arte Tradicional Peruano, en una sola hoja, con una estructura clara, ordenada y fácil de leer. Tema central: 🇵🇪 ARTE TRADICIONAL PERUANO Desde el tema central, crea 6 ramas principales: 1. Artesanía - Cerámica - Textiles - Tallado en madera - Retablos ayacuchanos - Mate burilado 2. Música - Huayno - Marinera - Festejo - Música andina - Instrumentos tradicionales: charango, quena, zampoña y cajón 3. Danzas - Marinera - Danza de las tijeras - Huaylarsh - Diablada - Wititi 4. Arte textil - Tejidos andinos - Bordados - Chullos - Ponchos - Diseños con símbolos tradicionales 5. Arte popular - Retablos - Máscaras - Cerámica decorativa - Imaginería - Pintura tradicional 6. Importancia cultural - Conserva las tradiciones - Transmite conocimientos entre generaciones - Representa la identidad peruana - Refleja la diversidad cultural - Fortalece el patrimonio cultural Diseño: estilo escolar, limpio y colorido, pero sin apariencia excesivamente profesional ni de presentación empresarial. Utiliza pequeños dibujos o íconos relacionados con cada rama. Usa poco texto por cada nodo, palabras clave y conexiones visibles. Coloca el título en el centro y distribuye las ramas alrededor de manera equilibrada. Formato: hoja A4 horizontal, una sola página, alta legibilidad, títulos grandes y texto breve. No crear diapositivas ni varias páginas.
Focused examples and prompt ideas
Start with the complete visitor wall above, then use these focused collections when you want a narrower subject and more prompt context.
The first curated collection is being prepared.