
“Crea una infografía ilustrada y académica sobre los tipos de mercados industriales. Incluye 6 categorías: mercado de productores, mercado de revendedores, mercado gubernamental, mercado de servicios, mercado agroindustrial y mercado internacional. Representa cada tipo con ilustraciones o íconos relacionados, por ejemplo fábricas, distribuidores, gobierno, hoteles, agricultura y comercio internacional. Usa un diseño moderno, limpio, profesional y colorido, con poco texto, títulos claramente visibles y formato horizontal para insertar en un documento de Word.”
NODE ARCHIVE · REAL DIAGRAM BRIEFS
Diagram Examples from Real Visitor Prompts
Browse eligible diagrams shared by FreeDiagram visitors, inspect the exact prompts, and build your own version.
Browse 3277 real creationsCOMMUNITY OUTPUTS · EXACT PROMPTS
Main diagram studio
Showing 529–552 of 1260. No stock examples or system defaults. Choose a tool, study a real result, then reopen its prompt as your starting point.

Hazme una imagen ilustrativa sobre los tipos de mercados industriales

Hazme un gráfico sobre los tipos de mercados industriales
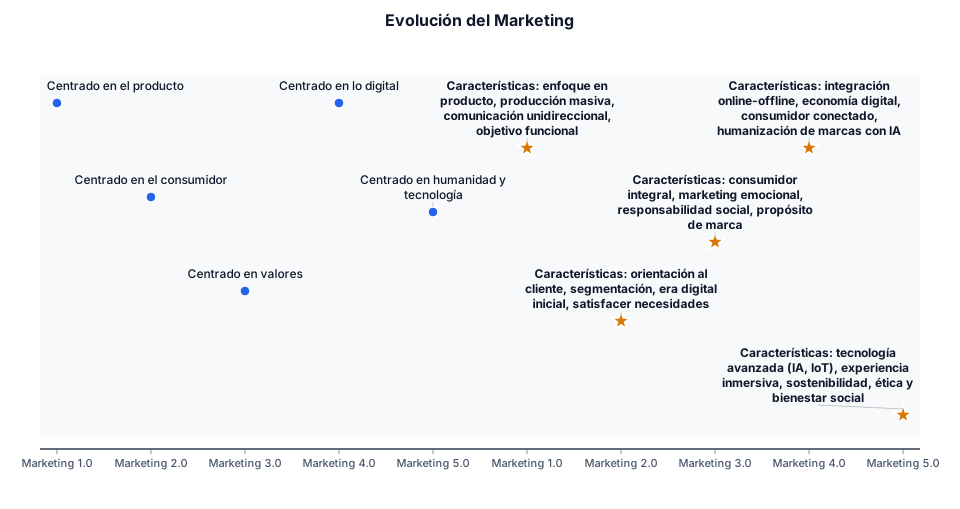
Haz una línea de tiempo de la evolución del marketing Marketing 1.0➡️ marketing 2.0 ➡️ marketing 3.0➡️ marketing 4.0 ➡️ marketing 5.0 Explicando por cómo se caracteriza cada uno y poniendo sus características enumeradas
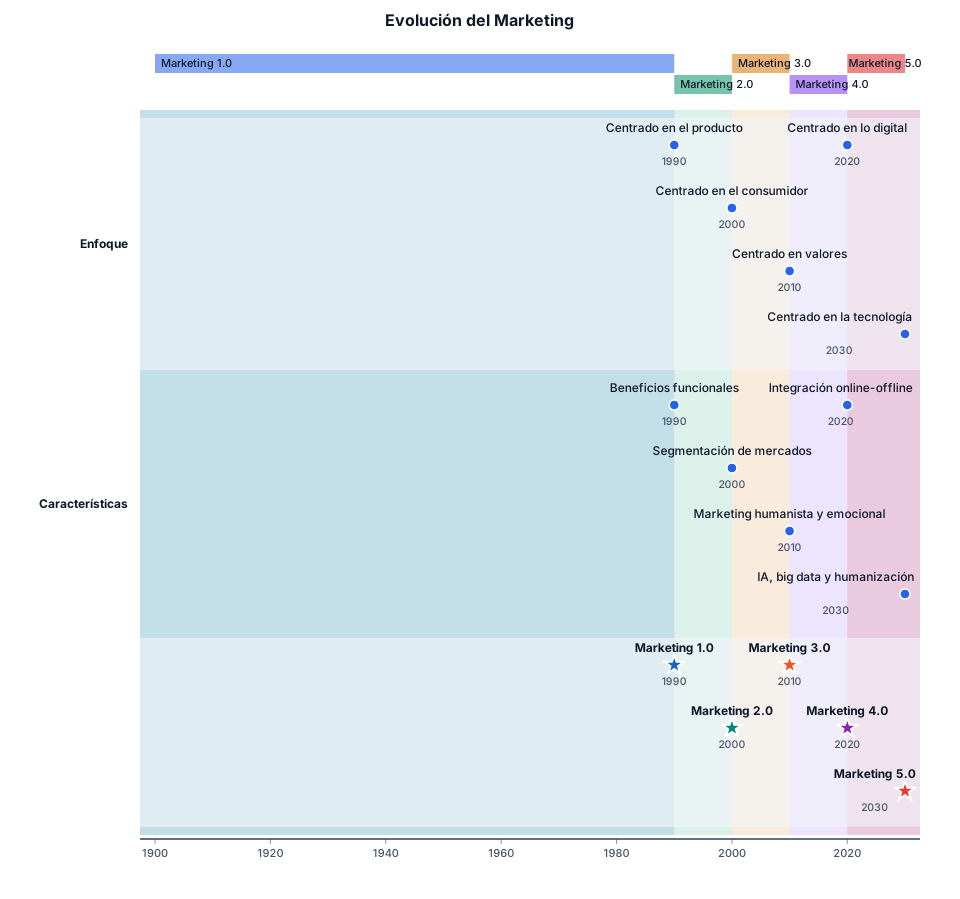
Haz una línea de tiempo de la evolución del marketing Marketing 1.0➡️ marketing 2.0 ➡️ marketing 3.0➡️ marketing 4.0 ➡️ marketing 5.0
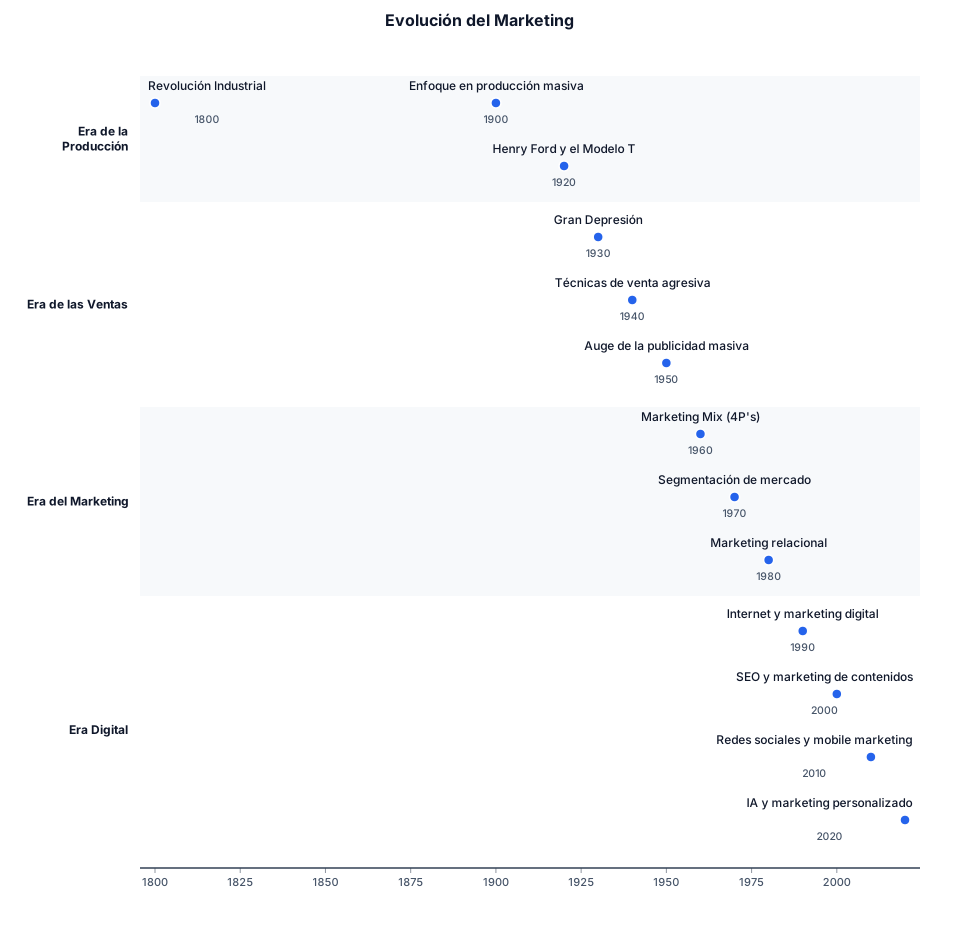
Haz una línea de tiempo de la evolución del marketing
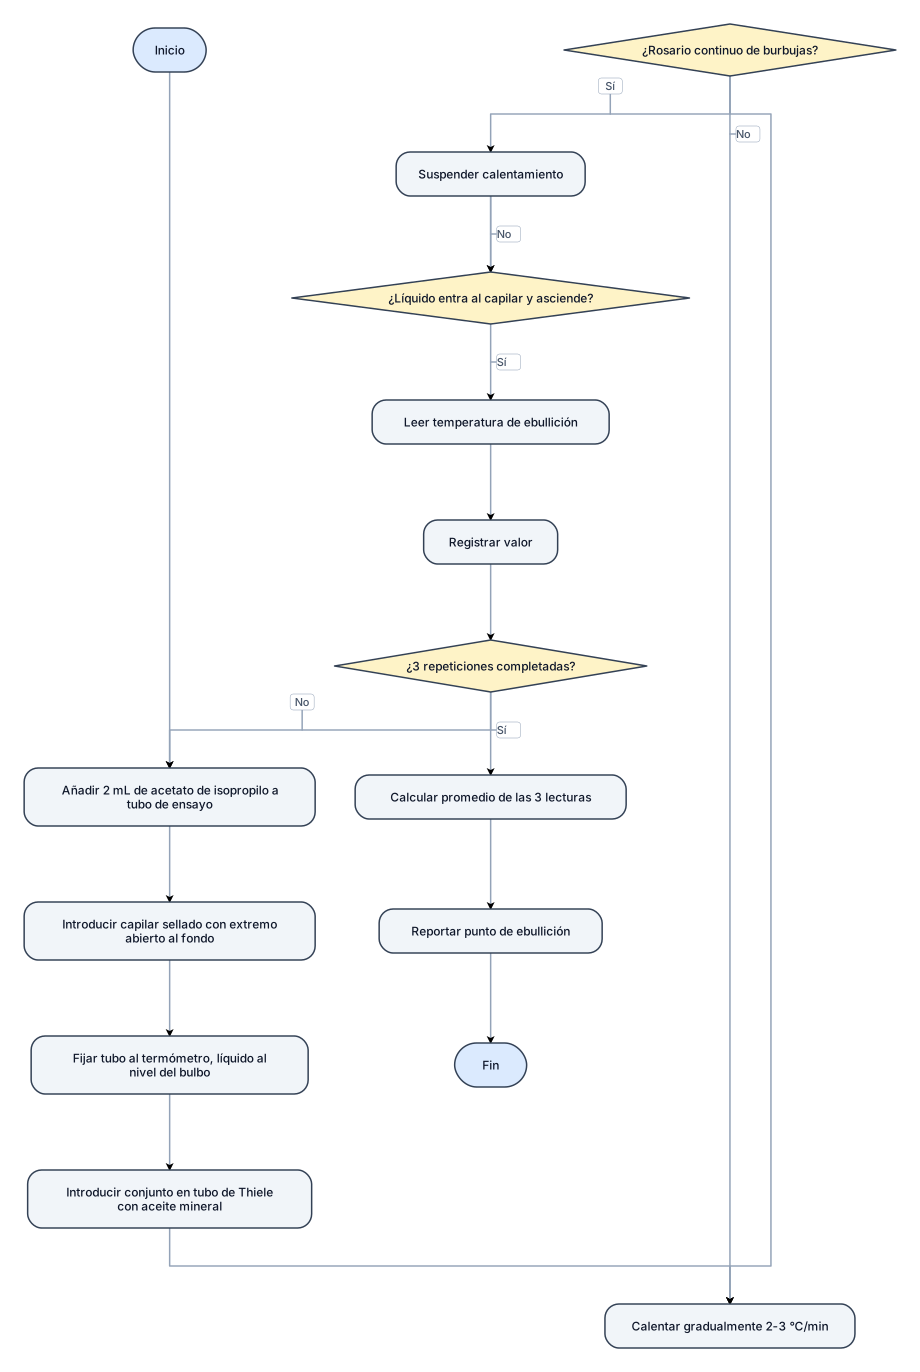
Diagarma de flujo para: el punto de ebullición A un tubo de ensayo pequeño se añaden 2 mL de acetato de isopropilo, se introduce un capilar sellado por uno de sus extremos de modo que el extremo abierto toque el fondo del tubo y luego se fija al termómetro procurando que la columna del líquido quede al nivel del bulbo del termómetro. El conjunto se introduce en el tubo de Thiele con aceite mineral y se empieza el calentamiento. Se calienta gradualmente (2-3 °C/min) hasta que del capilar se desprenda un rosario continuo de burbujas. En seguida se suspende el calentamiento y en el instante en que el líquido entre por el capilar y empiece a ascender se lee la temperatura de ebullición.[7] haga con 3 repeticiones .Determine el punto de ebullición
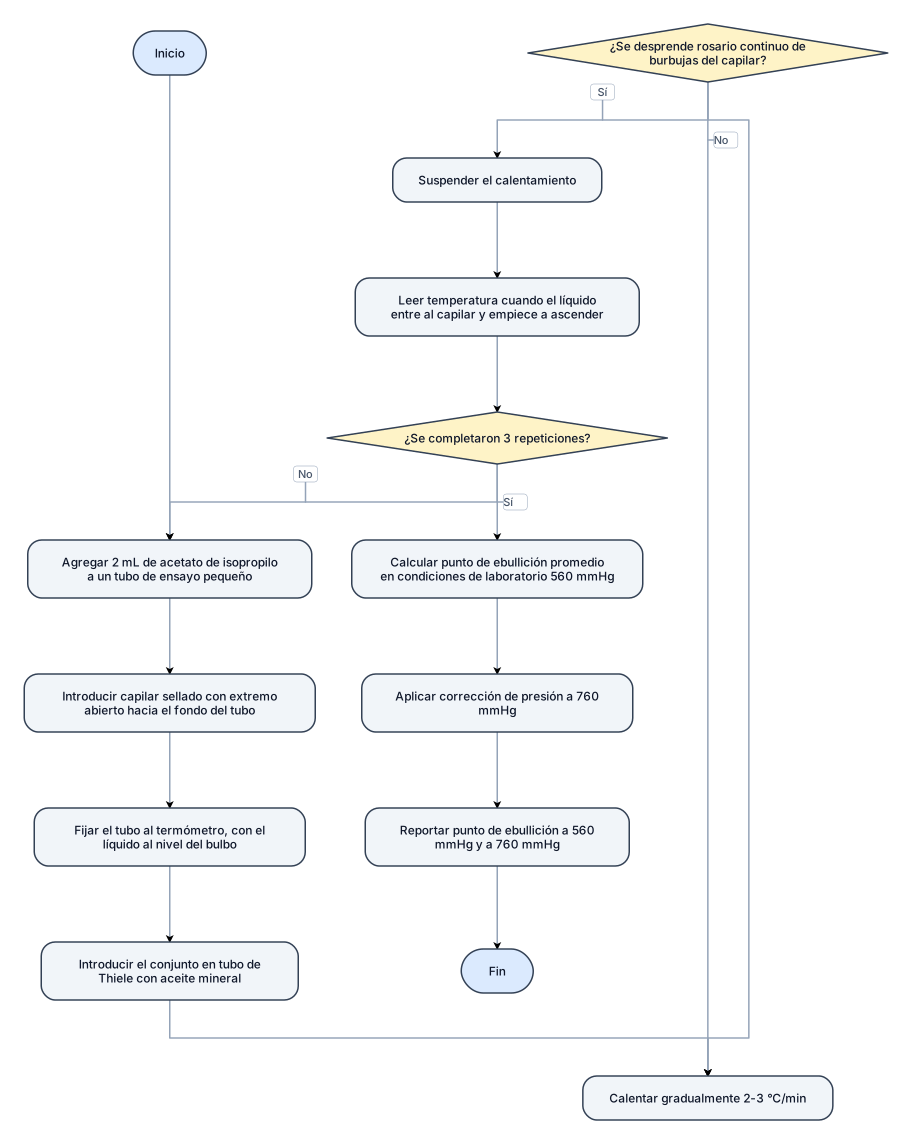
Diagarma de flujo para: el punto de ebullición A un tubo de ensayo pequeño se añaden 2 mL de acetato de isopropilo, se introduce un capilar sellado por uno de sus extremos de modo que el extremo abierto toque el fondo del tubo y luego se fija al termómetro procurando que la columna del líquido quede al nivel del bulbo del termómetro. El conjunto se introduce en el tubo de Thiele con aceite mineral y se empieza el calentamiento. Se calienta gradualmente (2-3 °C/min) hasta que del capilar se desprenda un rosario continuo de burbujas. En seguida se suspende el calentamiento y en el instante en que el líquido entre por el capilar y empiece a ascender se lee la temperatura de ebullición.[7] Determine el punto de ebullición en condiciones del laboratorio para el acetato de isopropilo con 3 repeticiones. reporte el punto de ebullición a condiciones de laboratorio (560 mmHg) y a condiciones estándar (760 mmHg) con las respectivas correcciones
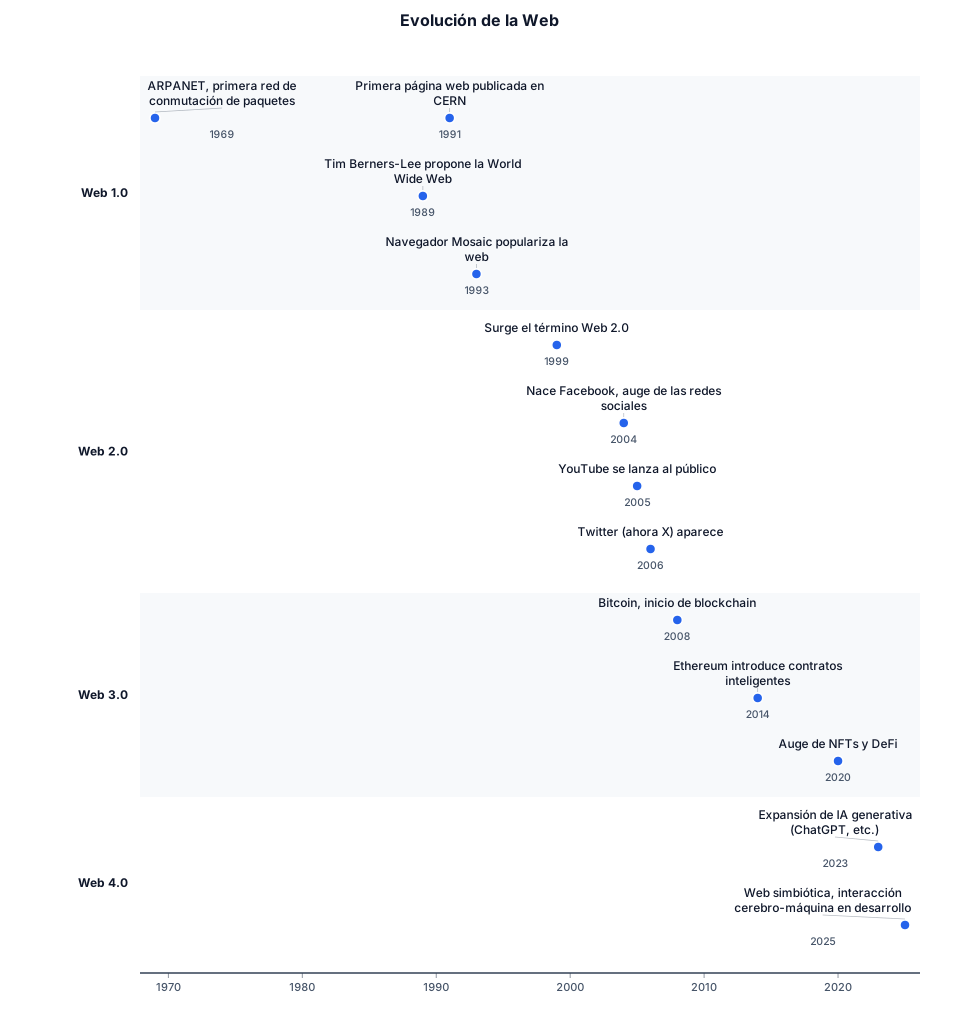
LINEA DE TIEMPO HACERCA DEL INTERNET EVOLUCION DE LA WEB
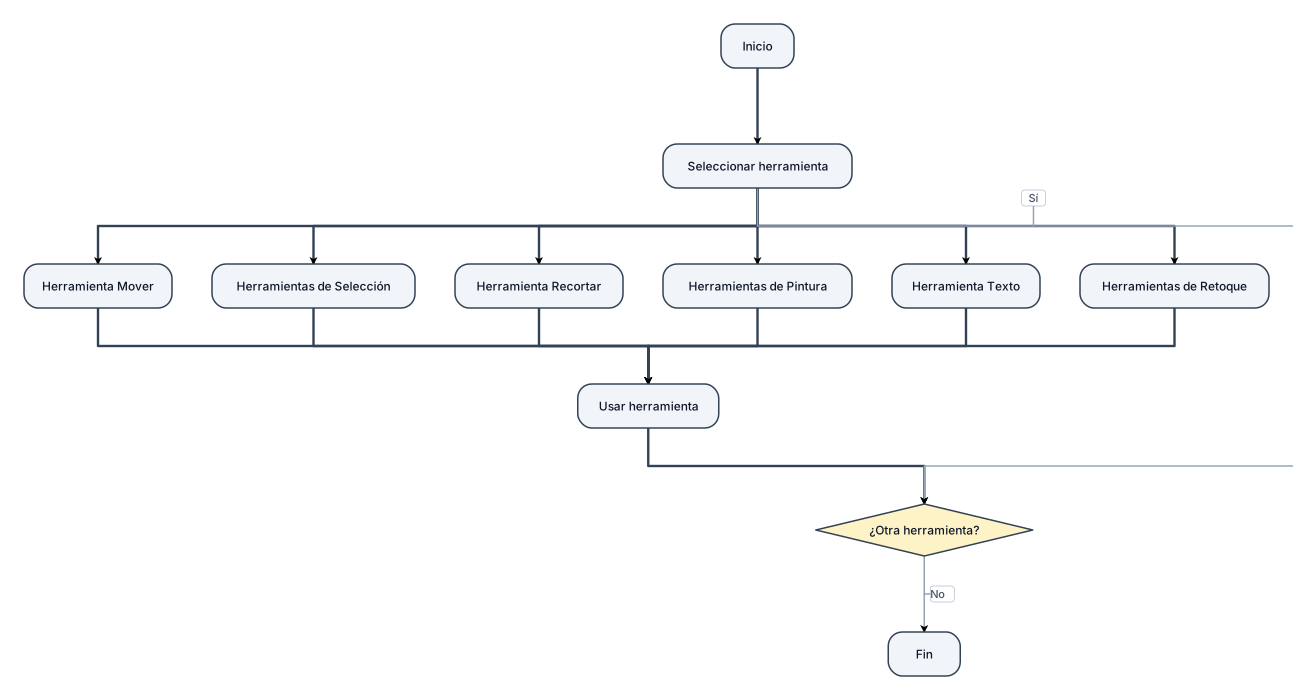
Un diagrama de flujo sobre las herramientas de photoshop
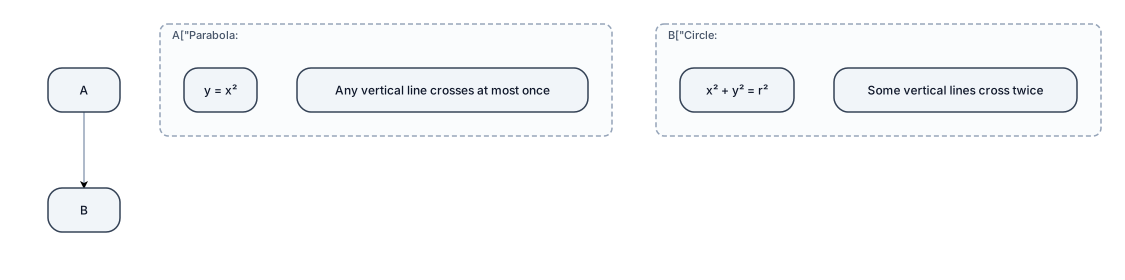
Image Suggestion: Include a graph showing a parabola (passes vertical line test) and a circle (fails vertical line test).

Create a clean visual explaining the content creation process: Idea → Research → Script → Recording → Editing → Upload → Audience Use simple icons and a modern professional style.
draw a good modern list for this Python · PyTorch · Hugging Face · Kafka · Spark/Flink · FastAPI · PostgreSQL/PostGIS · Redis · OpenSearch · MinIO · React · MapLibre GL
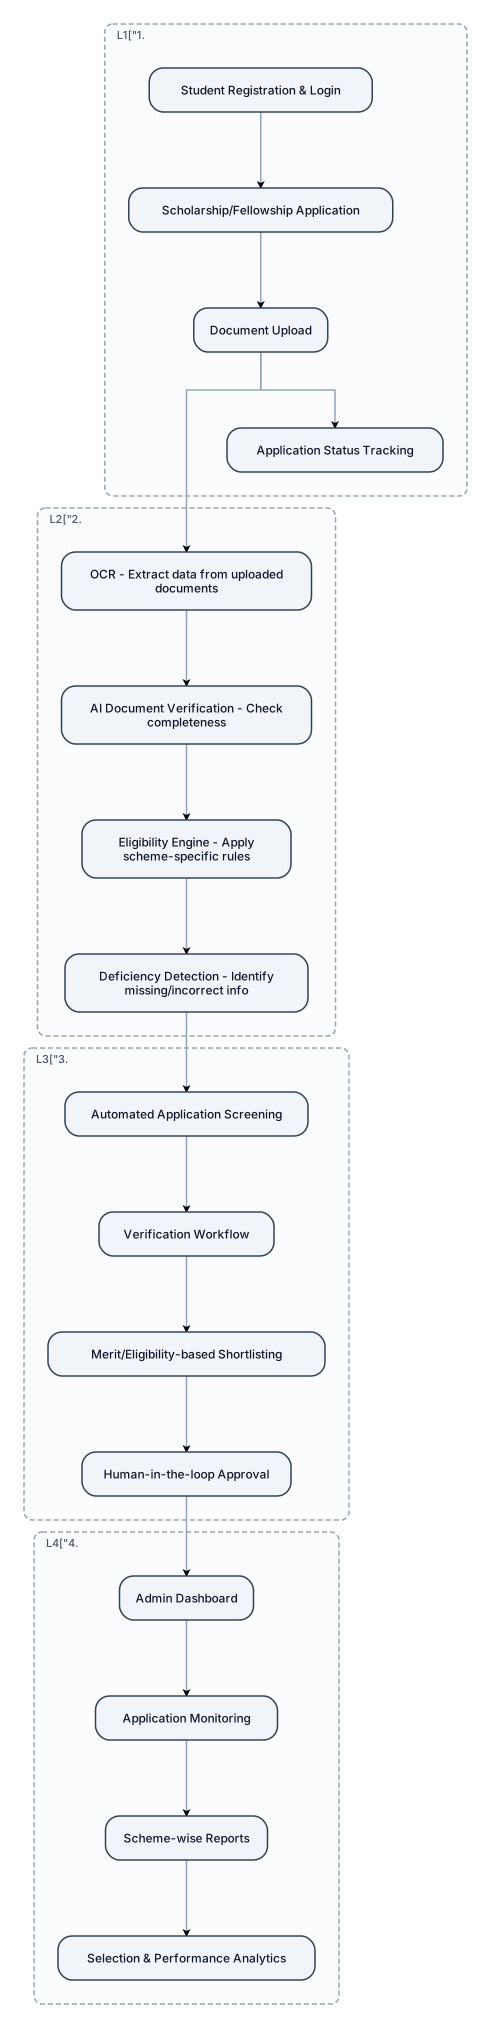
1. User & Application Layer Student Registration & Login Scholarship/Fellowship Application Document Upload Application Status Tracking ⬇️ 2. AI & Verification Layer OCR → Extract data from uploaded documents AI Document Verification → Check document completeness Eligibility Engine → Apply scheme-specific rules Deficiency Detection → Identify missing/incorrect information ⬇️ 3. Workflow & Selection Layer Automated Application Screening Verification Workflow Merit/Eligibility-based Shortlisting Human-in-the-loop Approval ⬇️ 4. Admin & Analytics Layer Admin Dashboard Application Monitoring Scheme-wise Reports Selection & Performance Analytics Make a proper diagram for SIH
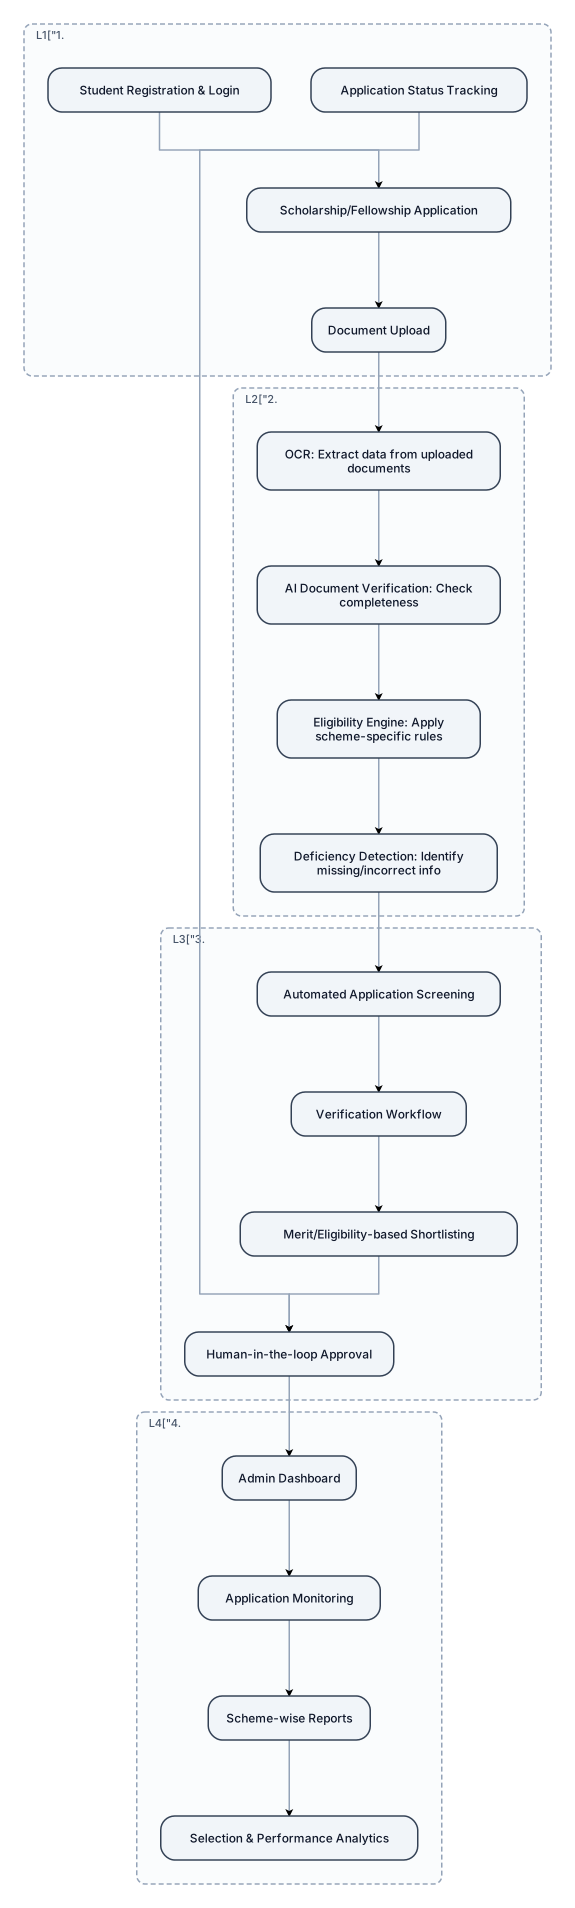
1. User & Application Layer Student Registration & Login Scholarship/Fellowship Application Document Upload Application Status Tracking ⬇️ 2. AI & Verification Layer OCR → Extract data from uploaded documents AI Document Verification → Check document completeness Eligibility Engine → Apply scheme-specific rules Deficiency Detection → Identify missing/incorrect information ⬇️ 3. Workflow & Selection Layer Automated Application Screening Verification Workflow Merit/Eligibility-based Shortlisting Human-in-the-loop Approval ⬇️ 4. Admin & Analytics Layer Admin Dashboard Application Monitoring Scheme-wise Reports Selection & Performance Analytics
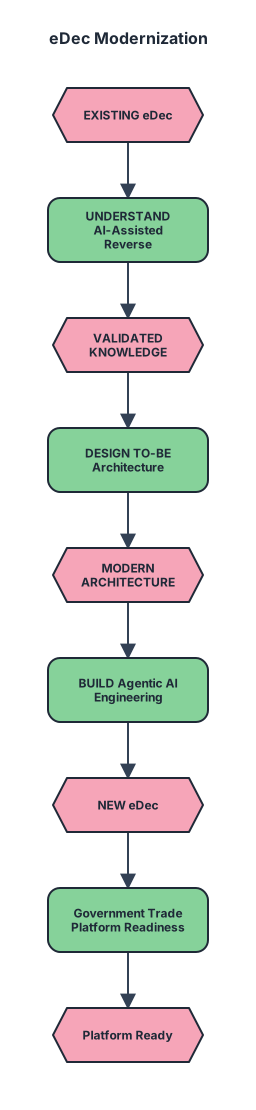
An event-driven process chain for process bellow: Use exactly these 8 steps in this order: 1. EXISTING eDec 2. UNDERSTAND AI-Assisted Reverse Engineering 3. VALIDATED KNOWLEDGE 4. DESIGN TO-BE Architecture 5. MODERN ARCHITECTURE 6. BUILD Agentic AI Engineering 7. NEW eDec 8. Government Trade Platform Readiness
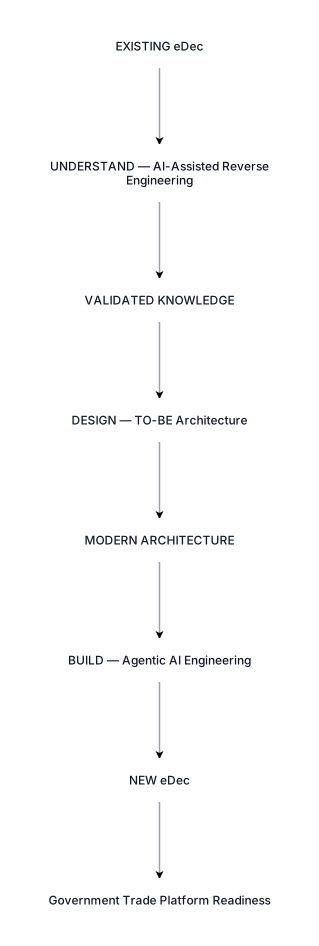
Create a vertical process flowchart titled "Transformasi eDec". EXISTING eDec ↓ UNDERSTAND — AI-Assisted Reverse Engineering ↓ VALIDATED KNOWLEDGE ↓ DESIGN — TO-BE Architecture ↓ MODERN ARCHITECTURE ↓ BUILD — Agentic AI Engineering ↓ NEW eDec ↓ Government Trade Platform Readiness Style: professional corporate presentation, light grey background, white cards with soft shadows and no borders, dark purple arrows, modern minimal design, circular gradient icons on the left of each card, white icons, clean typography. Put "Transformasi eDec" below the diagram.

Buat flowchart vertikal formal untuk bagian “3.1.3 Tahap Penelitian” skripsi dengan judul “Analisis Sentimen Komentar TikTok Terhadap Kebakaran Hutan di Kalimantan Utara Menggunakan Random Forest dan Decision Tree”. Gunakan bentuk flowchart akademik seperti diagram penelitian pada skripsi, dengan kotak proses, panah dari atas ke bawah, dan tata letak rapi.

Create a publication-quality academic system architecture diagram for a research paper titled "Mahabharata-Sabha Parva: A Trilingual Knowledge Graph of Characters, Events, and Ethical Dilemmas from an Indian Epic". Show three parallel input corpora: Sanskrit, Telugu, and English. Then show the following architectural layers in order: 1. Input Layer: Sanskrit Corpus, Telugu Corpus, English Corpus 2. Preprocessing Layer: OCR, text cleaning, normalization, sentence segmentation 3. Character Normalization Layer: multilingual character alias canonicalization 4. Extraction Layer: character/entity extraction, relation extraction, event extraction 5. Annotation Layer: narrative events and ethical dilemmas 6. Knowledge Graph Layer: unified trilingual knowledge graph containing characters, events, relations, and ethical dilemmas 7. Validation Layer: cross-lingual edge consistency, source-evidence traceability, and known-answer validation 8. Output Layer: validated trilingual knowledge graph, six major narrative events, twelve ethical dilemmas, and a foundation for computational reasoning over ethical decision-making. Use a clean academic architecture layout, clearly separated layers, rectangular components, directional arrows showing data flow, white background, minimal professional styling, readable text, no decorative elements, and no unnecessary icons. Make it suitable as a figure in a Q1 journal research paper.

Buat flowchart vertikal sederhana untuk Gambar 3.1 Tahap Penelitian skripsi. Gunakan warna hitam putih, latar putih, kotak persegi panjang sederhana, garis dan panah hitam, tanpa ikon, tanpa dekorasi, tanpa warna. Tahapan: Mulai → Studi Literatur → Identifikasi Masalah dan Variabel → Pengumpulan 500 Komentar TikTok → Pelabelan Sentimen Positif, Negatif, Netral → Text Preprocessing (Cleaning, Case Folding, Tokenizing, Stopword Removal, Stemming) → Pembobotan TF-IDF → Pembagian Dataset → Pelatihan Random Forest dan Decision Tree → Pengujian Model → Evaluasi (Accuracy, Precision, Recall, F1-Score) → Analisis Perbandingan Hasil → Implementasi Website → Notifikasi → Selesai. Jangan gunakan SMOTE. Tampilan formal dan cocok untuk skripsi.
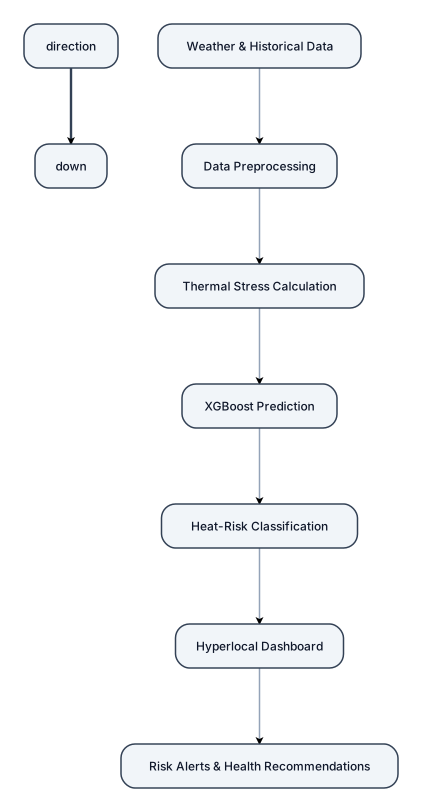
Create a flowchart for HeatGuard AI: Weather & Historical Data → Data Preprocessing → Thermal Stress Calculation → XGBoost Prediction → Heat-Risk Classification → Hyperlocal Dashboard → Risk Alerts & Health Recommendations
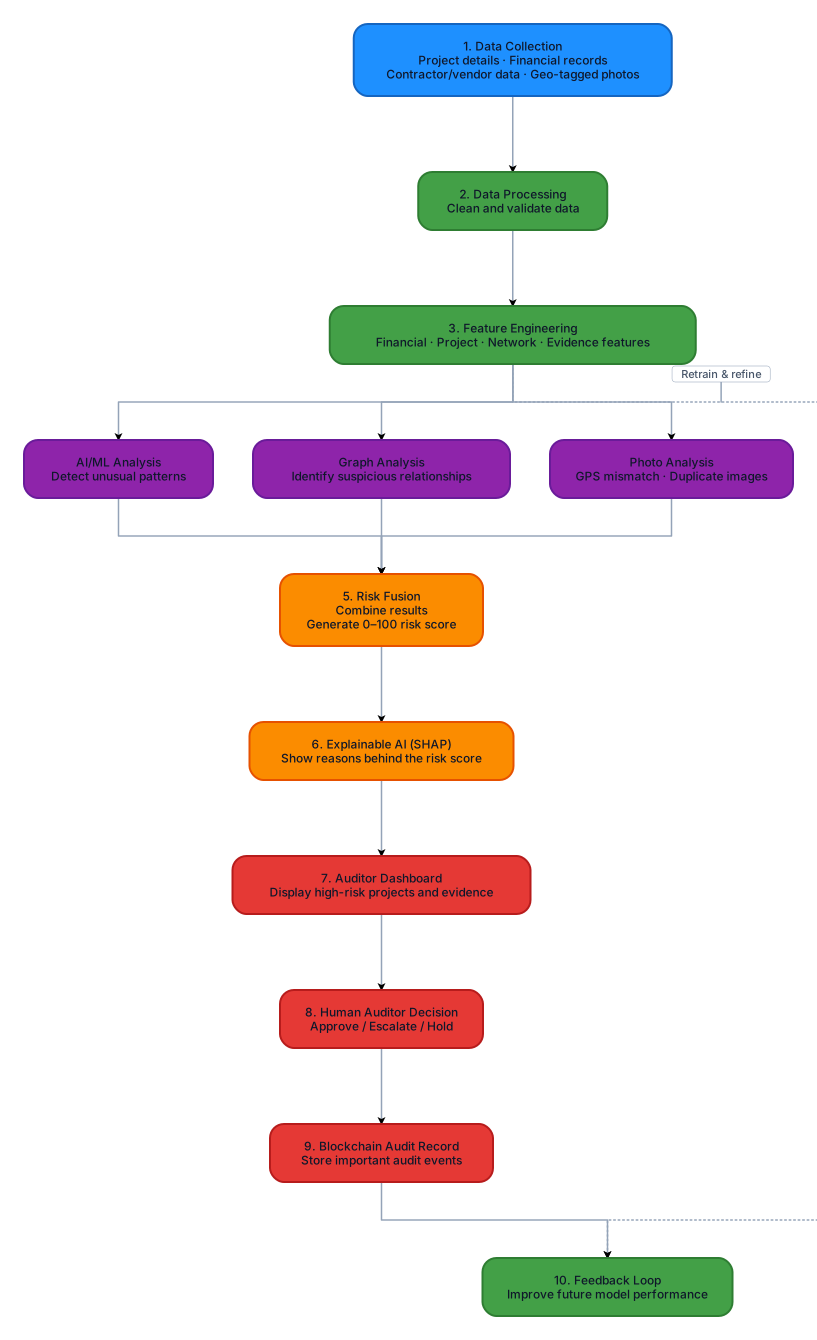
Create a professional, colourful, and easy-to-understand methodology flowchart for my Smart India Hackathon project VIGIL-AI – AI-Powered MPLADS Fraud Detection & Audit System. Title: VIGIL-AI Methodology / Process Flow Create a top-to-bottom flowchart with these important steps: 1. Data Collection - Project details - Financial records - Contractor/vendor data - Geo-tagged photos 2. Data Processing - Clean and validate data 3. Feature Engineering - Financial, project, network, and evidence features 4. Parallel Detection - AI/ML Analysis: detect unusual patterns - Graph Analysis: identify suspicious relationships - Photo Analysis: check GPS mismatch and duplicate images 5. Risk Fusion - Combine results - Generate 0–100 risk score 6. Explainable AI (SHAP) - Show reasons behind the risk score 7. Auditor Dashboard - Display high-risk projects and evidence 8. Human Auditor Decision - Approve / Escalate / Hold 9. Blockchain Audit Record - Store important audit events 10. Feedback Loop - Improve future model performance Design requirements: - Use a clean, modern hackathon presentation style. - Use rounded boxes and clear arrows. - Use colours: blue for data, green for processing, purple for AI, orange for risk analysis, and red for auditing. - Keep only important points; avoid long paragraphs. - Show AI detection as three parallel branches. - Add the note: “AI Recommends; Auditor Decides.” - Make the flowchart suitable for a PowerPoint slide.
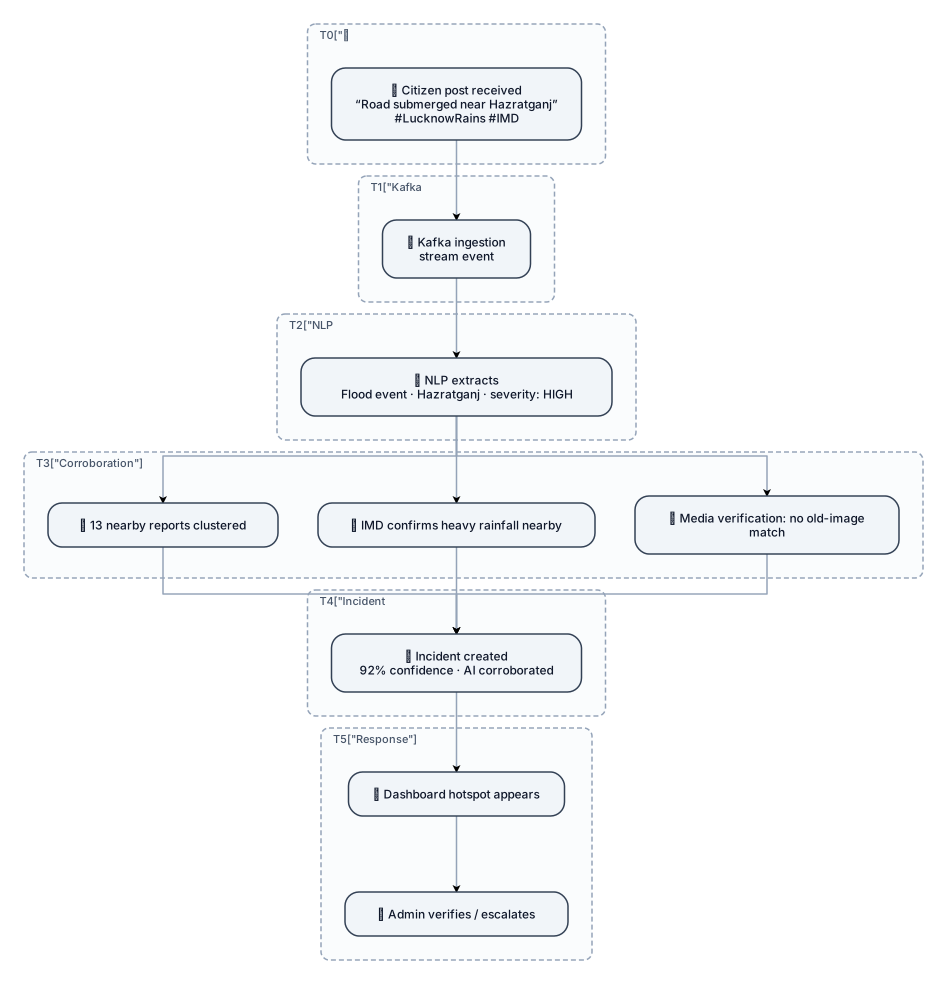
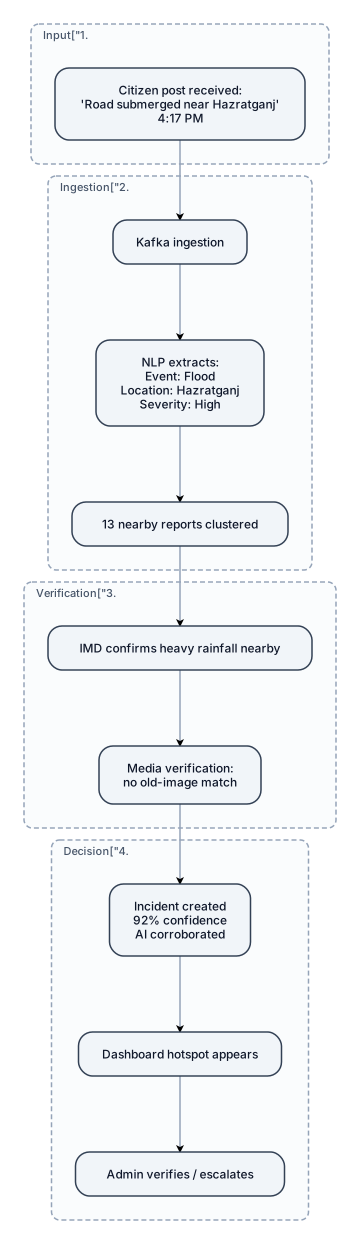
7-SECOND HAZRATGANJ FLOOD STORY (4:17 PM) Citizen post received: "Road submerged near Hazratganj #LucknowRains #IMD" Kafka ingestion NLP extracts: Flood event, Location: Hazratganj, severity: High 13 nearby reports clustered IMD data confirms heavy rainfall nearby Media verification finds no old-image match Incident created with 92% confidence, AI corroborated Dashboard hotspot appears; admin verifies/escalates "Make it look visually engaging and more impressive "
7-SECOND HAZRATGANJ FLOOD STORY (4:17 PM) Citizen post received: "Road submerged near Hazratganj #LucknowRains #IMD" Kafka ingestion NLP extracts: Flood event, Location: Hazratganj, severity: High 13 nearby reports clustered IMD data confirms heavy rainfall nearby Media verification finds no old-image match Incident created with 92% confidence, AI corroborated Dashboard hotspot appears; admin verifies/escalates