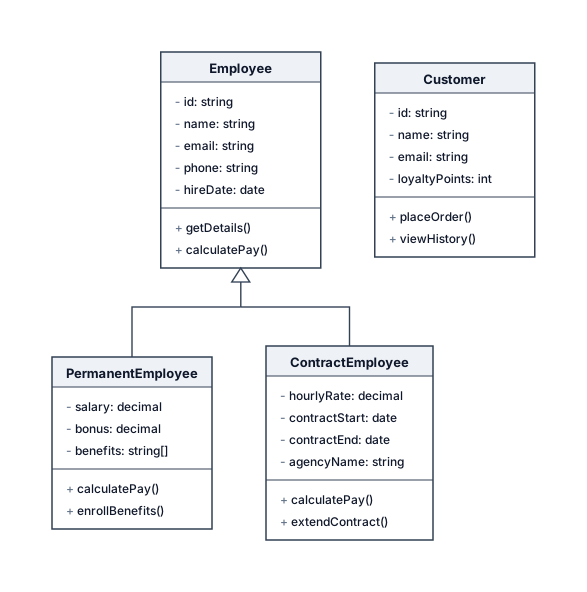
er for the employee manegement syteam and that the permanet costemer and the contact based employe
NODE ARCHIVE · REAL DIAGRAM BRIEFS
Diagram Examples from Real Visitor Prompts
Browse eligible diagrams shared by FreeDiagram visitors, inspect the exact prompts, and build your own version.
Browse 987 real creationsCOMMUNITY OUTPUTS · EXACT PROMPTS
Main diagram studio
Showing 553–576 of 589. No stock examples or system defaults. Choose a tool, study a real result, then reopen its prompt as your starting point.
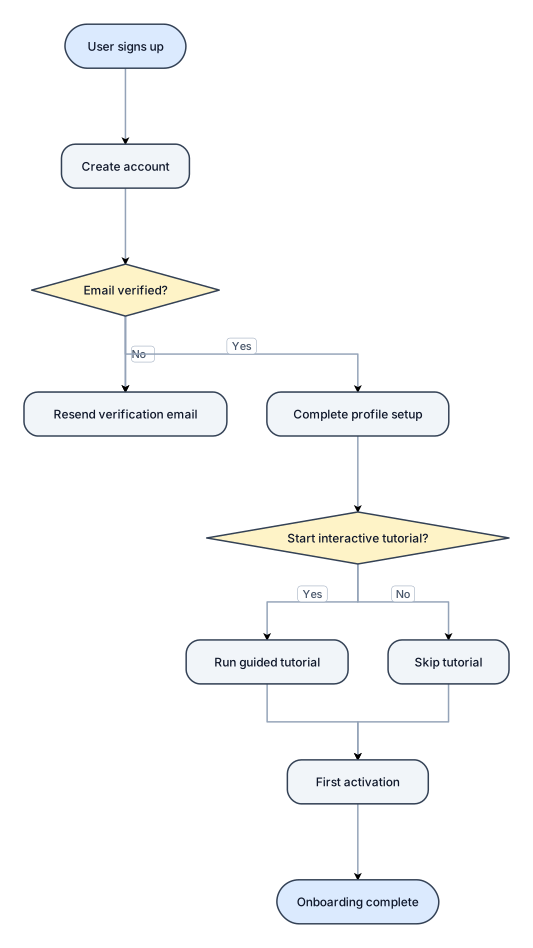
A flowchart of a new-user onboarding flow from signup to first activation, with a verification branch
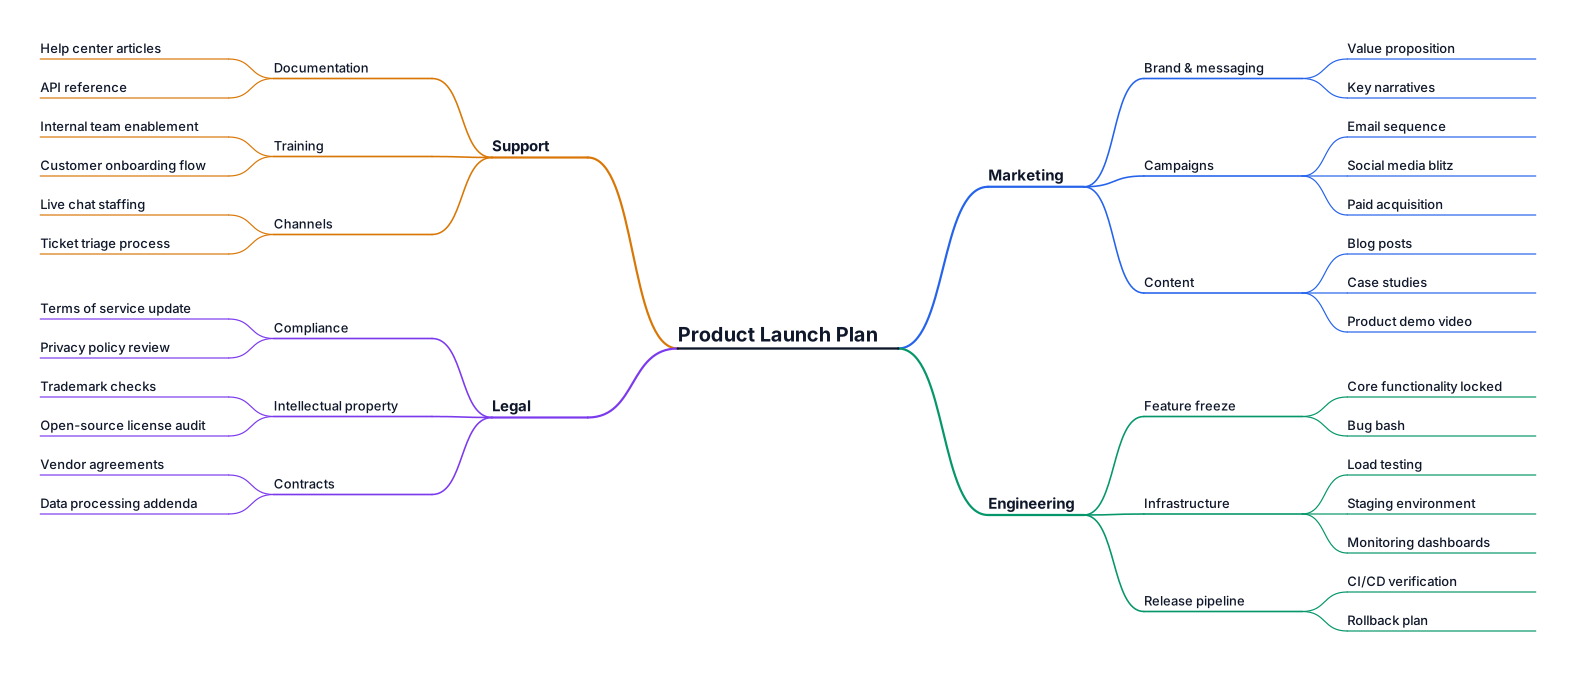
A mind map for planning a product launch, branching into marketing, engineering, support, and legal
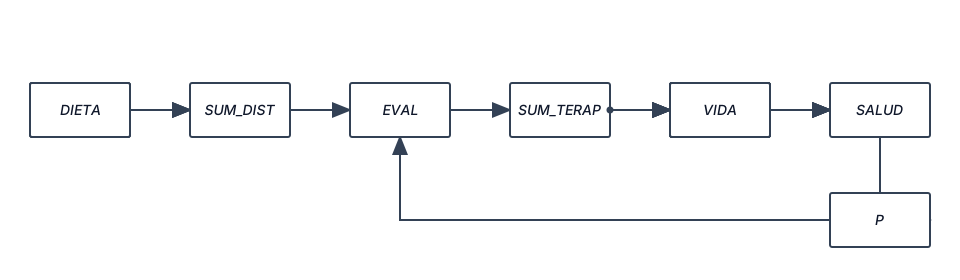
me lo hces diagrama de bloque el tema es medicina natural detallado y con conceptos
me lo hces diagrama de bloque el tema es medicina natural
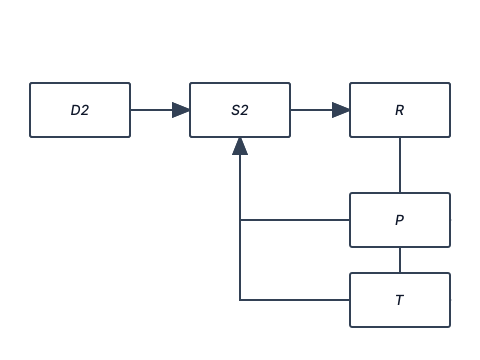
me lo hces diagrama de bloque que se trate de medicina natural
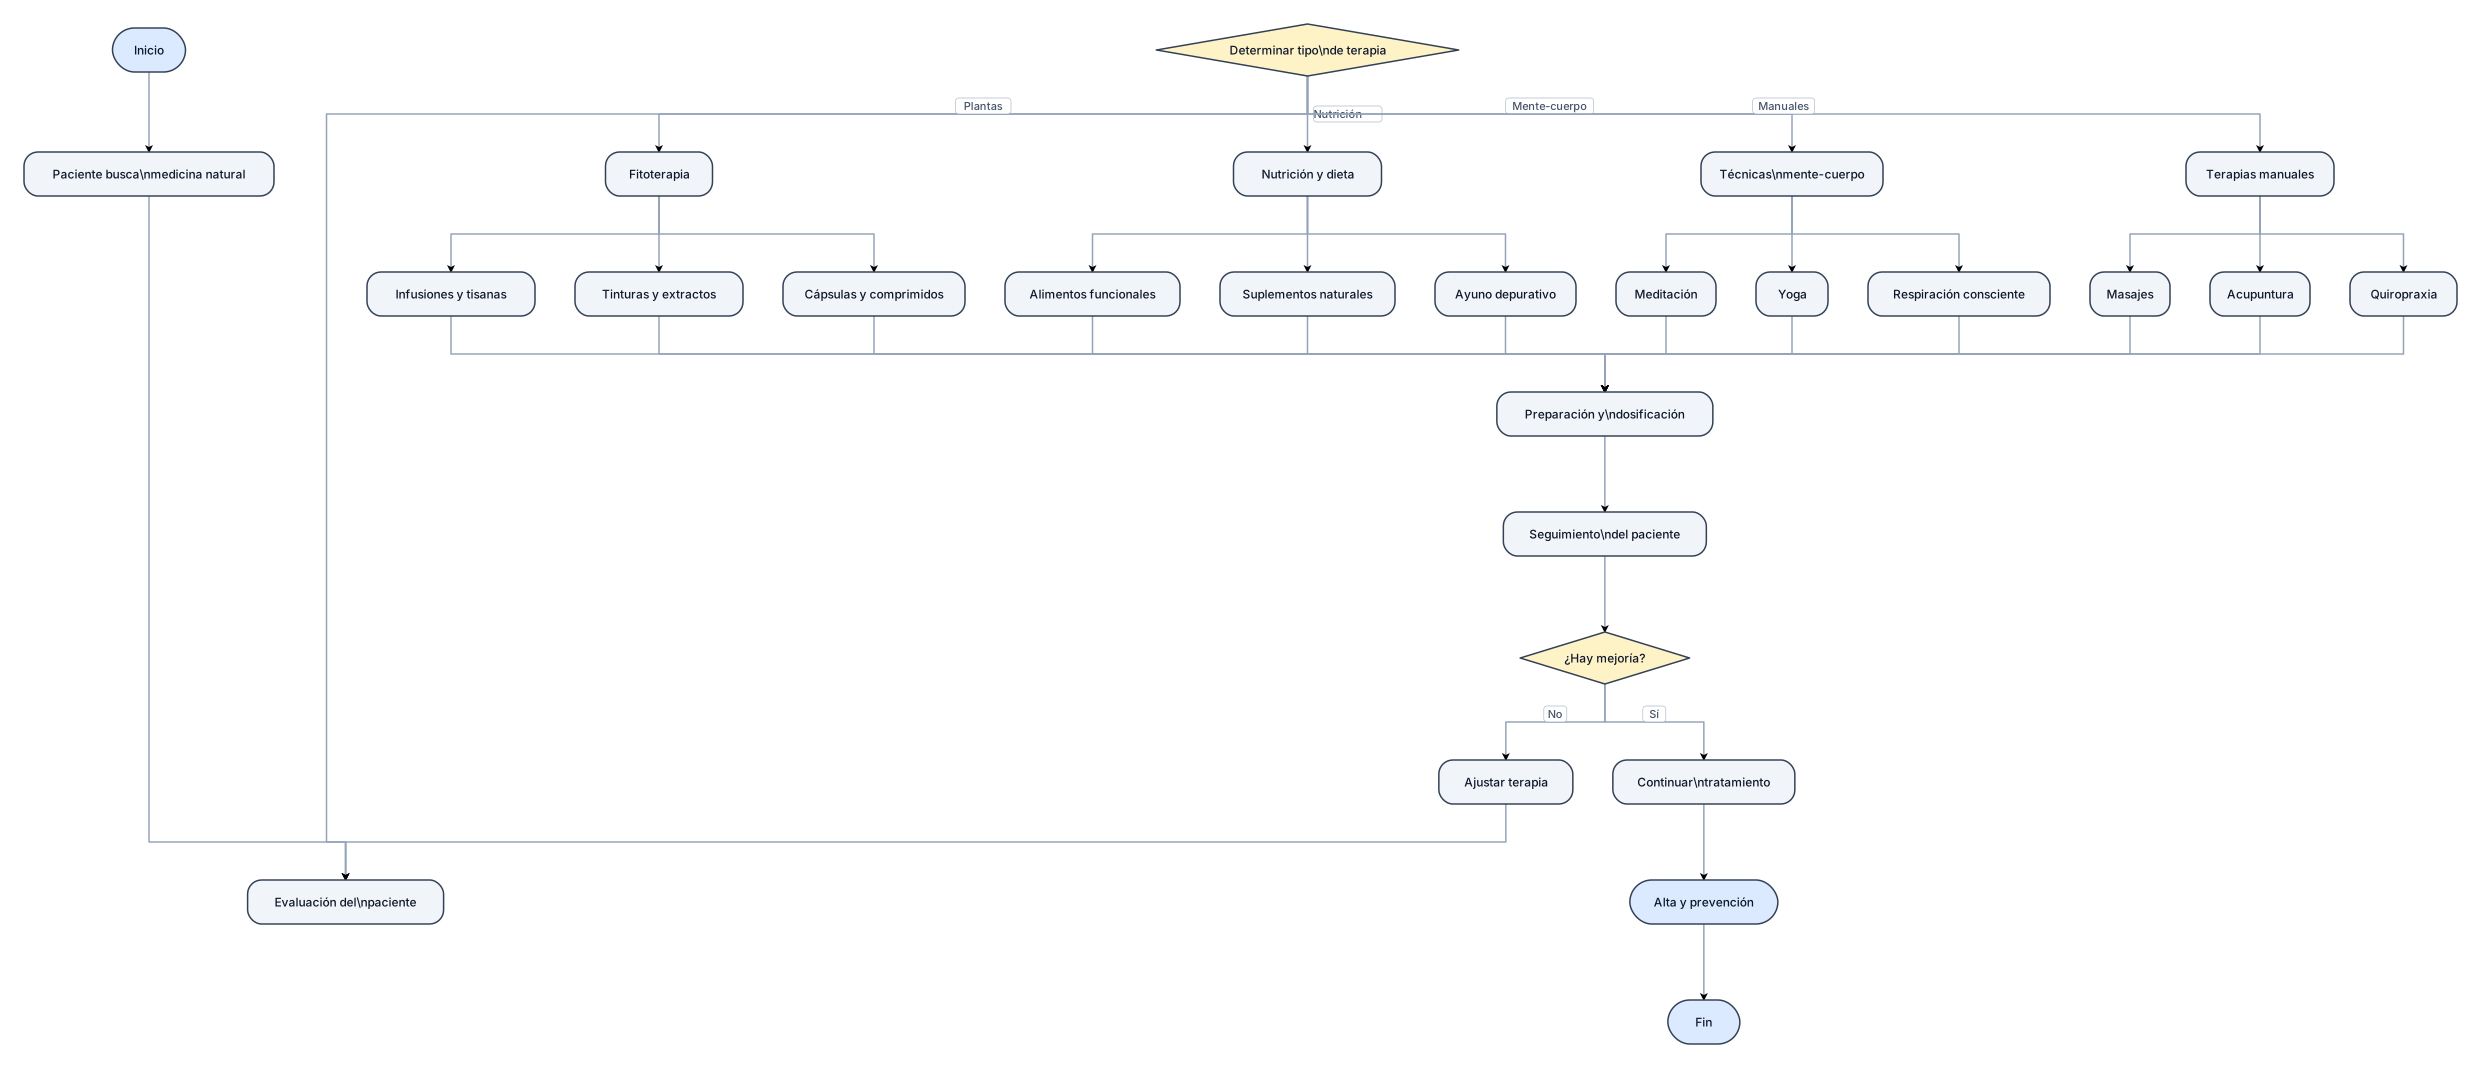
me lo hces diagrama de flujo que se trate de medicina natural
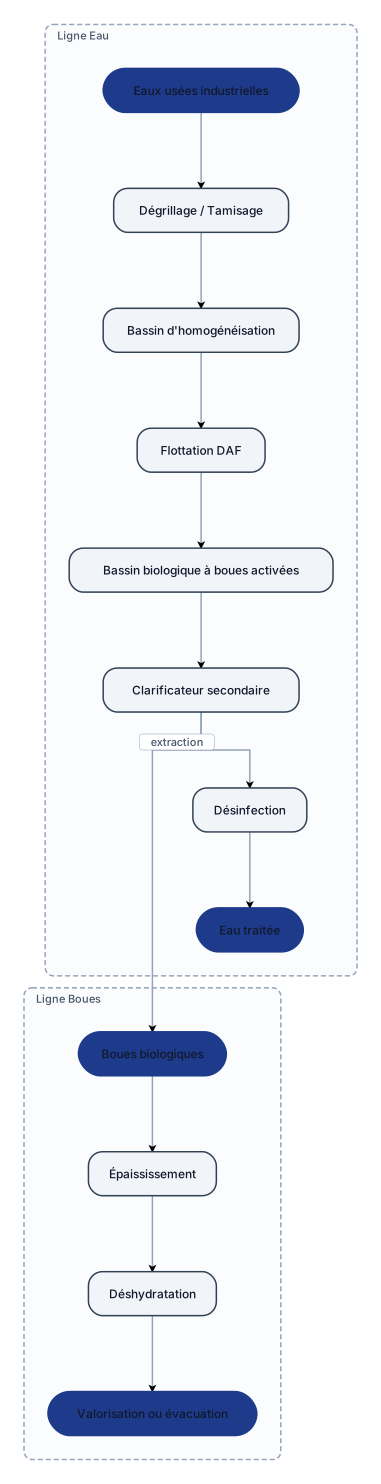
Créer un synoptique professionnel d'une STEP industrielle agroalimentaire (industrie laitière). Titre : STEP industrielle agroalimentaire – Traitement des eaux usées Ligne eau : Eaux usées industrielles ↓ Dégrillage / Tamisage (élimination des déchets grossiers) ↓ Bassin d'homogénéisation (régulation du débit et de la charge polluante) ↓ Flottation DAF (élimination des graisses et matières en suspension) ↓ Bassin biologique à boues activées (oxydation de la matière organique) ↓ Clarificateur secondaire (séparation eau-boues) ↓ Désinfection ↓ Eau traitée (rejet ou réutilisation) Ajouter une ligne boues : Boues biologiques ↓ Épaississement ↓ Déshydratation ↓ Valorisation ou évacuation Style : diagramme industriel PFD, professionnel, fond blanc, blocs bleus, flèches noires.

Diseña una diapositiva profesional en formato 16:9 para una presentación ejecutiva. El título debe ser "Trayectoria Académica y Profesional". Crea una línea de tiempo vertical moderna, elegante y minimalista, con una línea central y nodos circulares conectados. Utiliza un diseño limpio con colores corporativos. Paleta de colores: Azul oscuro (#1F3A5F) para la línea principal y los títulos. Verde (#2E8B57) para resaltar las experiencias más relevantes relacionadas con Ingeniería Industrial, Producción e Inventarios. Gris claro (#D9D9D9) para las experiencias complementarias. Fondo blanco con detalles sutiles en azul claro. La línea de tiempo debe incluir los siguientes eventos: 2015 Kenzo Jeans Asesor de Ventas Duración: 6 meses Color: Gris Ícono: bolsa de compras. 2015 – 2016 Apoyo en Montajes Eléctricos Proyecto Operativo Color: Gris Ícono: herramientas. 2017 – 2018 SENA Técnico en Mecánica de Maquinaria Industrial Color: Verde Ícono: engranaje. 2019 – 2025 Universidad de Cundinamarca Ingeniería Industrial Color: Verde (destacado) Ícono: birrete universitario. 2024 Multidimensionales S.A.S. Practicante de Control de Procesos Febrero – Agosto Color: Verde (destacado) Ícono: fábrica. 2024 Multidimensionales S.A.S. Analista de Producción Agosto – Octubre Color: Verde (destacado) Ícono: gráfico de producción. 2025 – 2026 Universidad de Cundinamarca Especialización en Marketing Digital Color: Verde Ícono: gráfico de crecimiento o analítica. Diseño visual: Los eventos destacados (Ingeniería Industrial, Multidimensionales y Especialización) deben verse ligeramente más grandes, con un borde verde y una sombra suave para atraer la atención. Los eventos de Kenzo Jeans y Montajes Eléctricos deben mantenerse en gris para indicar que forman parte de la trayectoria, pero no son el foco principal para el cargo. Utiliza una tipografía moderna como Poppins, Aptos o Calibri. Mantén abundante espacio en blanco para una apariencia limpia y ejecutiva.
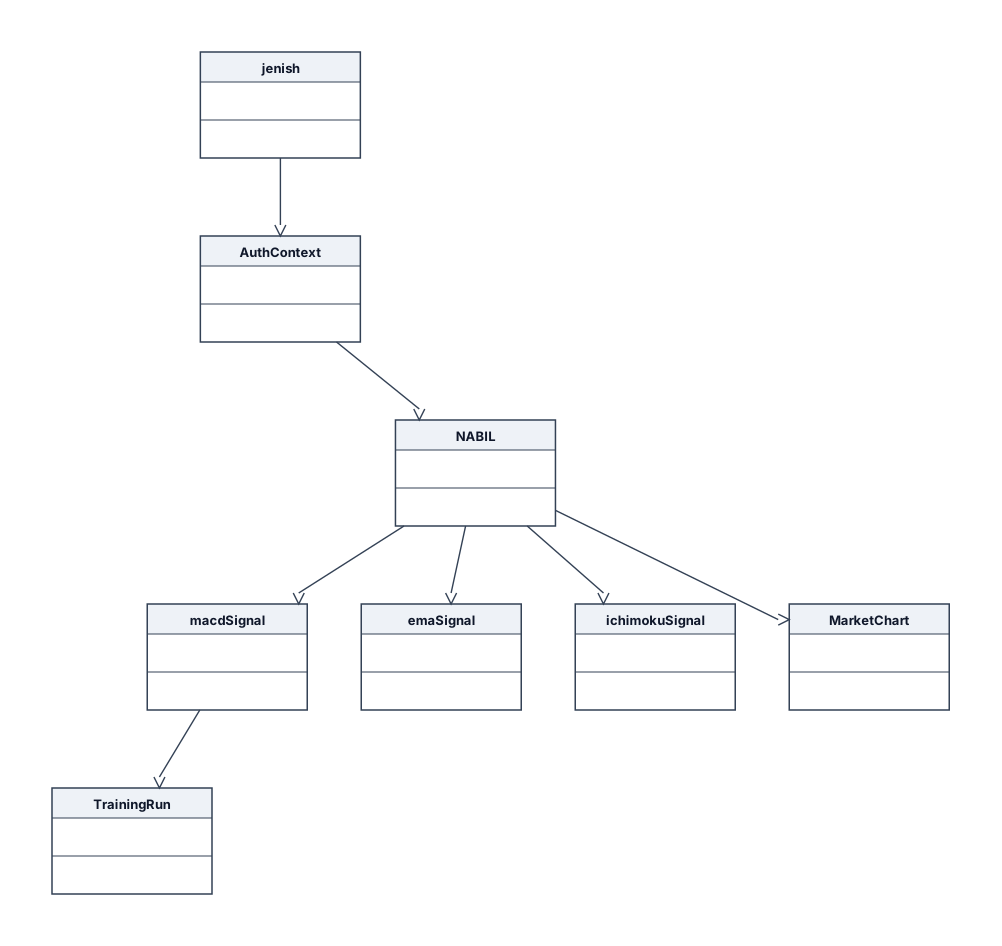
Draw a simple UML Object Diagram for a Trading Signal Prediction System (TSPS). Show a snapshot of the system after a user requests a prediction for the NABIL stock. Arrange the objects from left to right. Include these object instances: User - jenish - fullName = "Jenish" - role = "User" Admin - admin - role = "Admin" Asset - NABIL - price = 512.40 Signals - macdSignal - BUY - confidence = 58.64% - emaSignal - BUY - confidence = 56.95% - ichimokuSignal - SELL - confidence = 40.09% TrainingRun - MACD Model - accuracy = 78% AuthContext - loggedIn = true MarketChart - range = 3 Months Draw these links: jenish → AuthContext AuthContext → NABIL NABIL → macdSignal NABIL → emaSignal NABIL → ichimokuSignal macdSignal → TrainingRun NABIL → MarketChart Keep the diagram simple and high-level. Use object notation (objectName : ClassName). Show only a few important attribute values. Do not include IDs, passwords, tokens, timestamps, JSON objects, or database details. Use a white background, black borders, straight connector lines, and clean spacing.
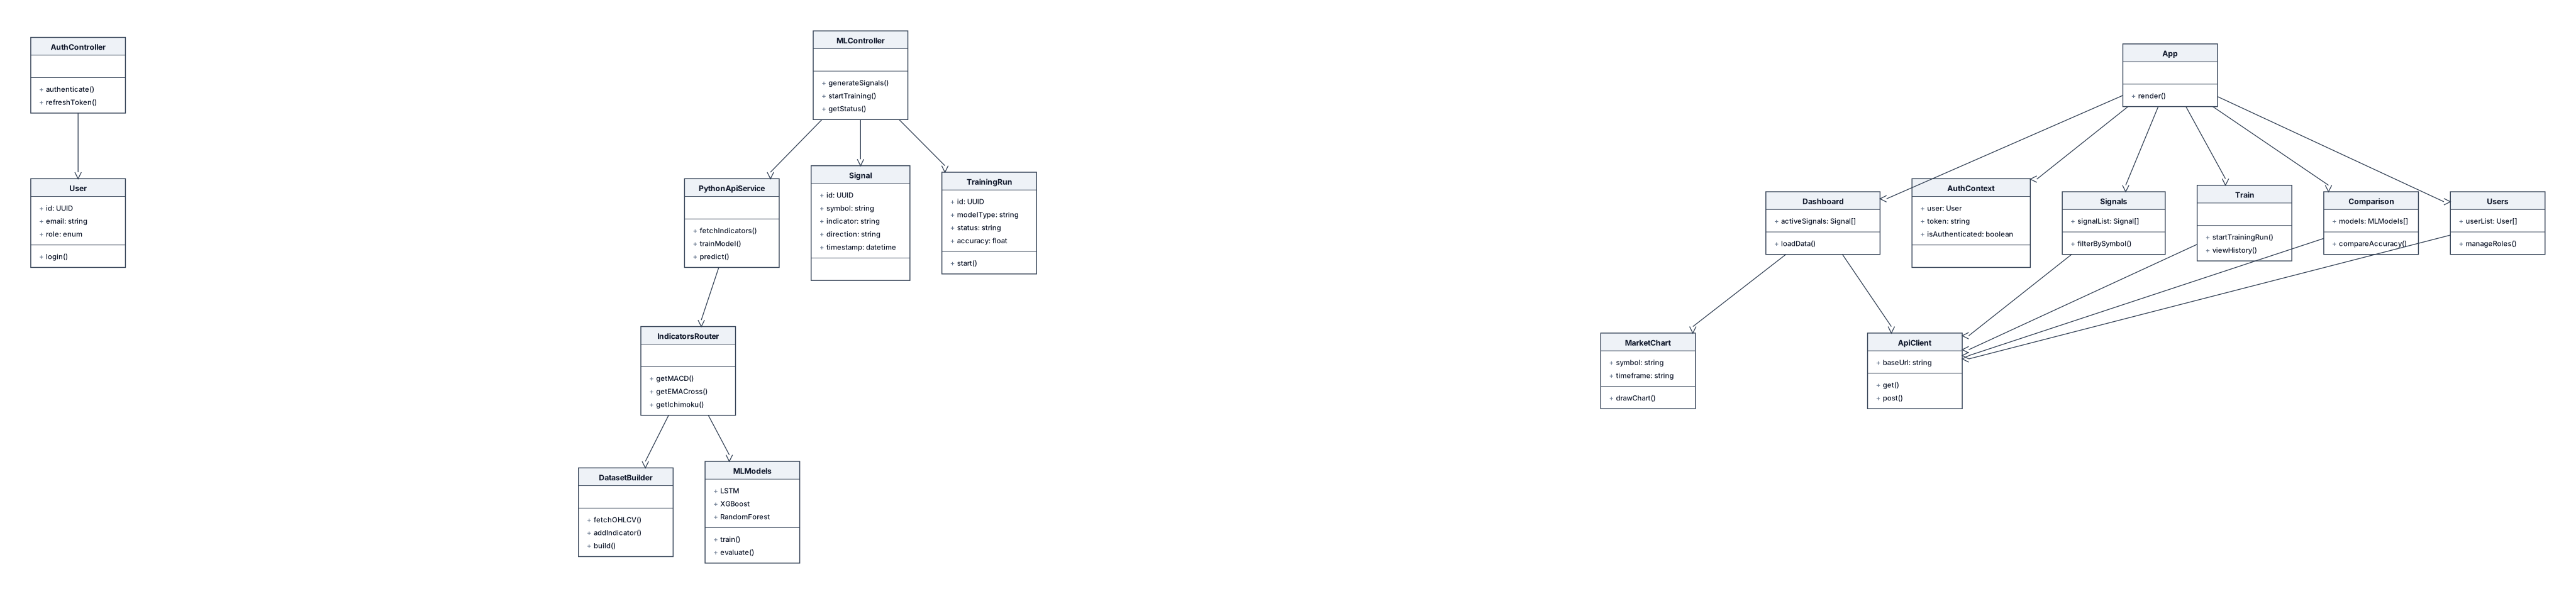
Draw a simple UML Class Diagram for a Trading Signal Prediction System (TSPS). Create three sections: - Backend - Python ML API - Frontend Arrange them horizontally: - Backend on the left - Python ML API in the center - Frontend on the right Use simple UML class boxes with: - Class Name - A few important attributes or methods only Backend Classes: - User - Signal - TrainingRun - AuthController - MLController - PythonApiService Python ML API Classes: - IndicatorsRouter - DatasetBuilder - ML Models Frontend Classes: - App - AuthContext - Dashboard - Signals - Train - Comparison - Users - MarketChart - ApiClient Draw these relationships: Backend: AuthController → User MLController → Signal MLController → TrainingRun MLController → PythonApiService Python ML API: PythonApiService → IndicatorsRouter IndicatorsRouter → DatasetBuilder IndicatorsRouter → ML Models Frontend: App → AuthContext App → Dashboard App → Signals App → Train App → Comparison App → Users Dashboard → MarketChart All Pages → ApiClient Keep the diagram simple and high-level. Do not show every attribute or every method. Use only the main classes and their relationships. Use a white background, black borders, straight connector lines, and clean spacing. i am not using RSI instead the indicators are macd, ema cross and ichimoku cloud
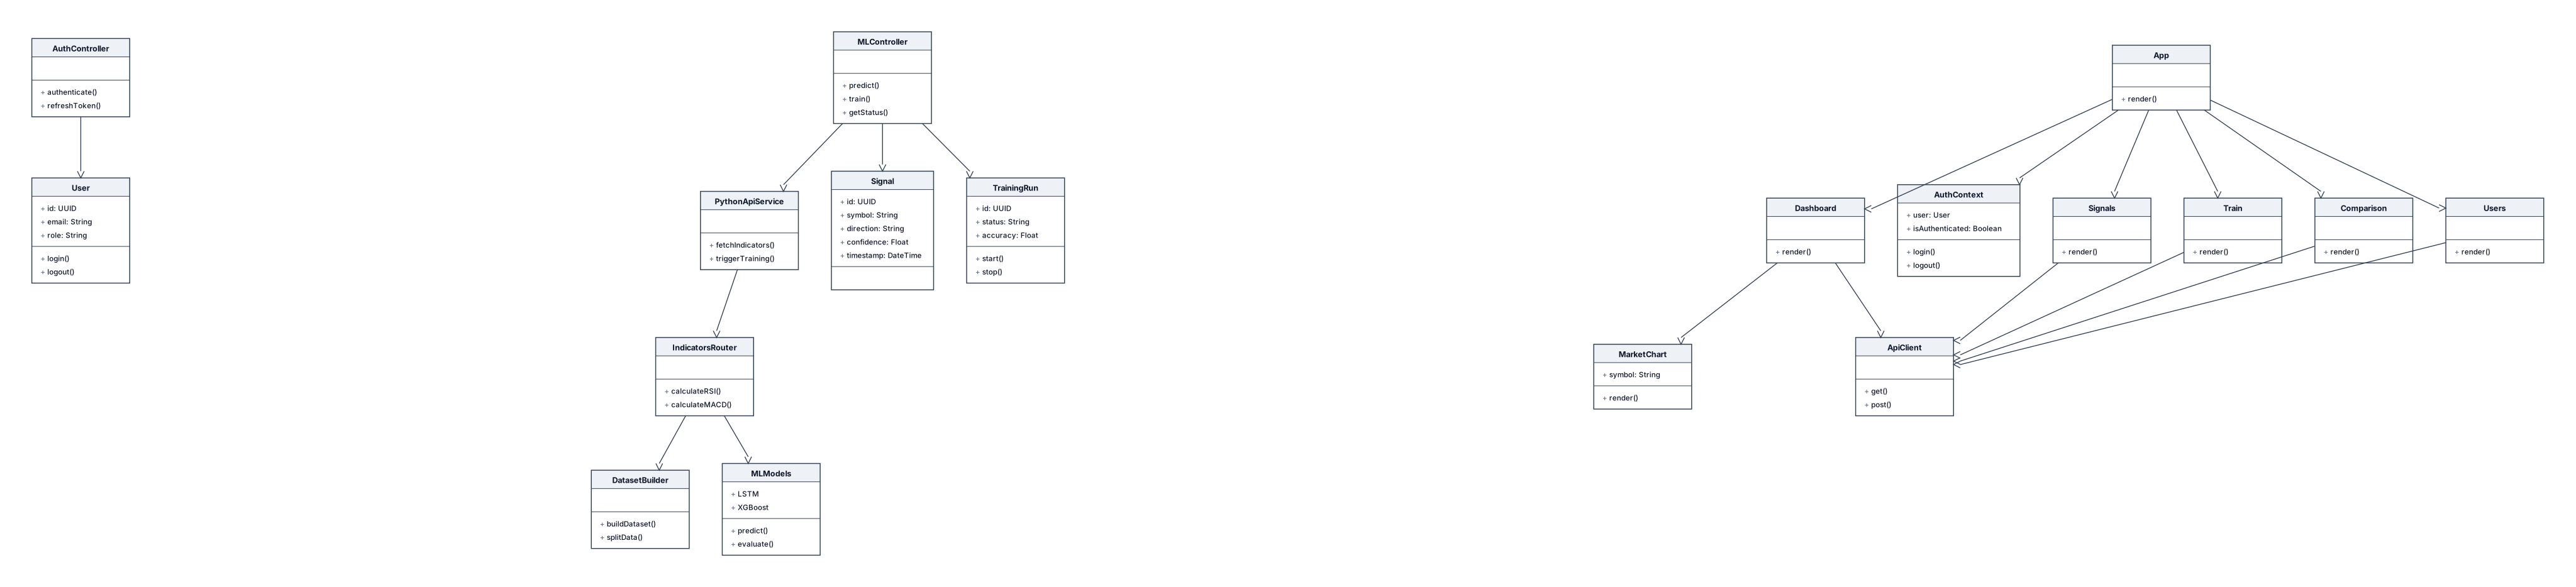
Draw a simple UML Class Diagram for a Trading Signal Prediction System (TSPS). Create three sections: - Backend - Python ML API - Frontend Arrange them horizontally: - Backend on the left - Python ML API in the center - Frontend on the right Use simple UML class boxes with: - Class Name - A few important attributes or methods only Backend Classes: - User - Signal - TrainingRun - AuthController - MLController - PythonApiService Python ML API Classes: - IndicatorsRouter - DatasetBuilder - ML Models Frontend Classes: - App - AuthContext - Dashboard - Signals - Train - Comparison - Users - MarketChart - ApiClient Draw these relationships: Backend: AuthController → User MLController → Signal MLController → TrainingRun MLController → PythonApiService Python ML API: PythonApiService → IndicatorsRouter IndicatorsRouter → DatasetBuilder IndicatorsRouter → ML Models Frontend: App → AuthContext App → Dashboard App → Signals App → Train App → Comparison App → Users Dashboard → MarketChart All Pages → ApiClient Keep the diagram simple and high-level. Do not show every attribute or every method. Use only the main classes and their relationships. Use a white background, black borders, straight connector lines, and clean spacing.
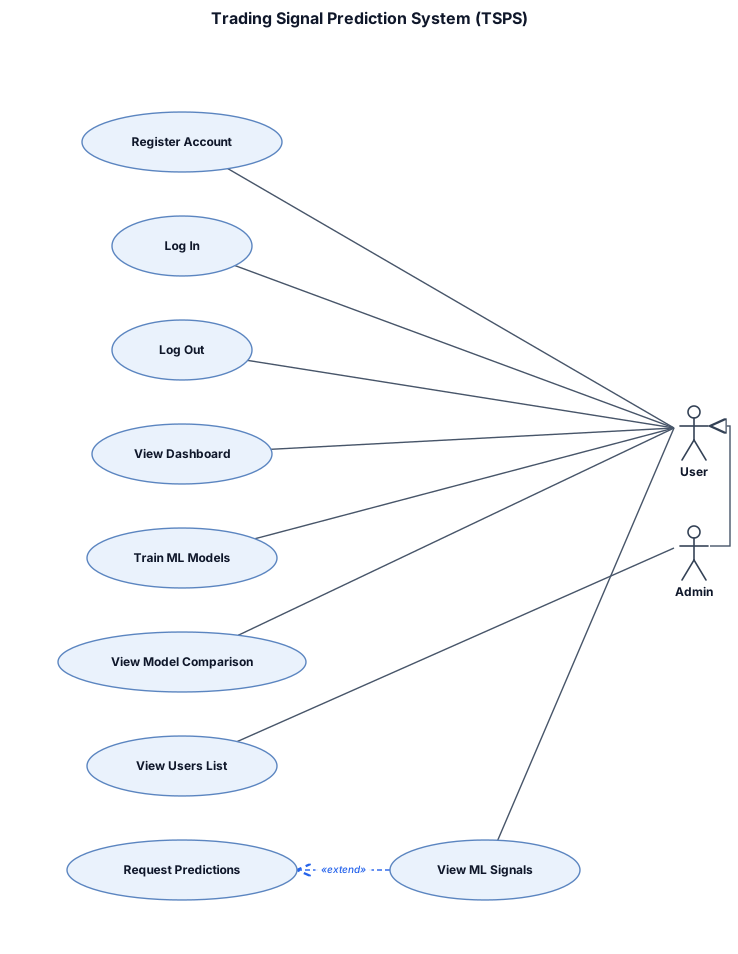
Draw a simple software use case diagram. Create a large rectangle in the center titled: Trading Signal Prediction System (TSPS) Place a stick figure named User on the left. Place a stick figure named Admin on the right. Draw these oval shapes inside the rectangle: Register Account Log In Log Out View Dashboard View ML Signals Request Predictions Train ML Models View Model Comparison View Users List Connect the User to: Register Account Log In Log Out View Dashboard View ML Signals Train ML Models View Model Comparison Connect the Admin to: View Users List Draw a dashed arrow from View ML Signals to Request Predictions. Draw an inheritance arrow from Admin to User. The users should be on the left side the oval entities should be inside a rectangle border
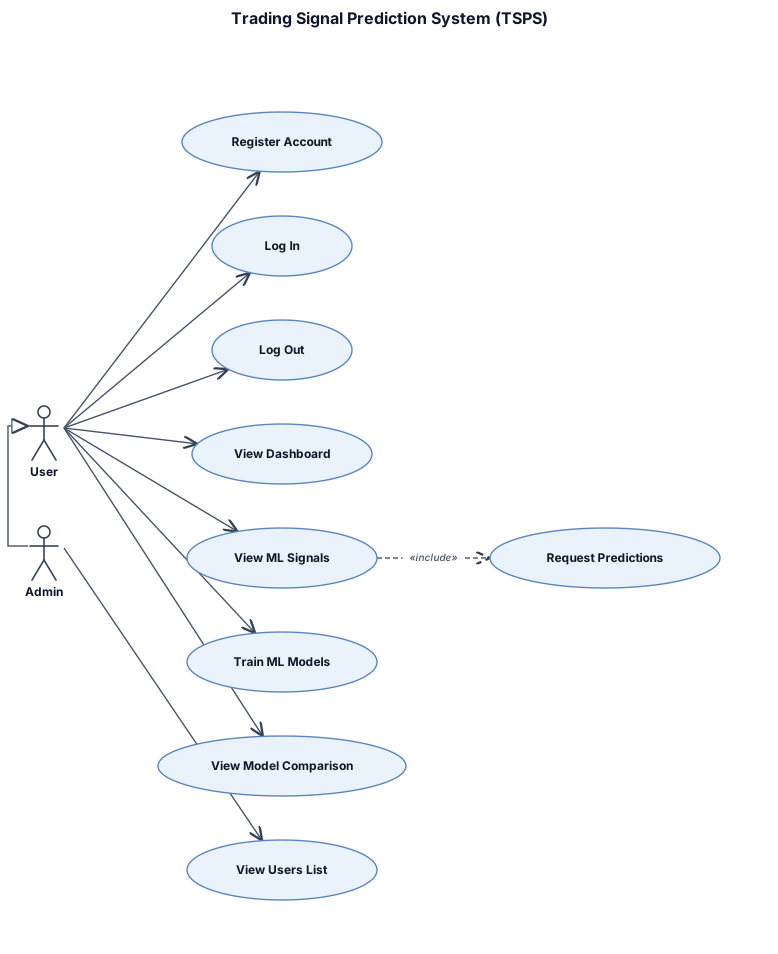
Draw a simple software use case diagram. Create a large rectangle in the center titled: Trading Signal Prediction System (TSPS) Place a stick figure named User on the left. Place a stick figure named Admin on the right. Draw these oval shapes inside the rectangle: Register Account Log In Log Out View Dashboard View ML Signals Request Predictions Train ML Models View Model Comparison View Users List Connect the User to: Register Account Log In Log Out View Dashboard View ML Signals Train ML Models View Model Comparison Connect the Admin to: View Users List Draw a dashed arrow from View ML Signals to Request Predictions. Draw an inheritance arrow from Admin to User. The users should be on the left side
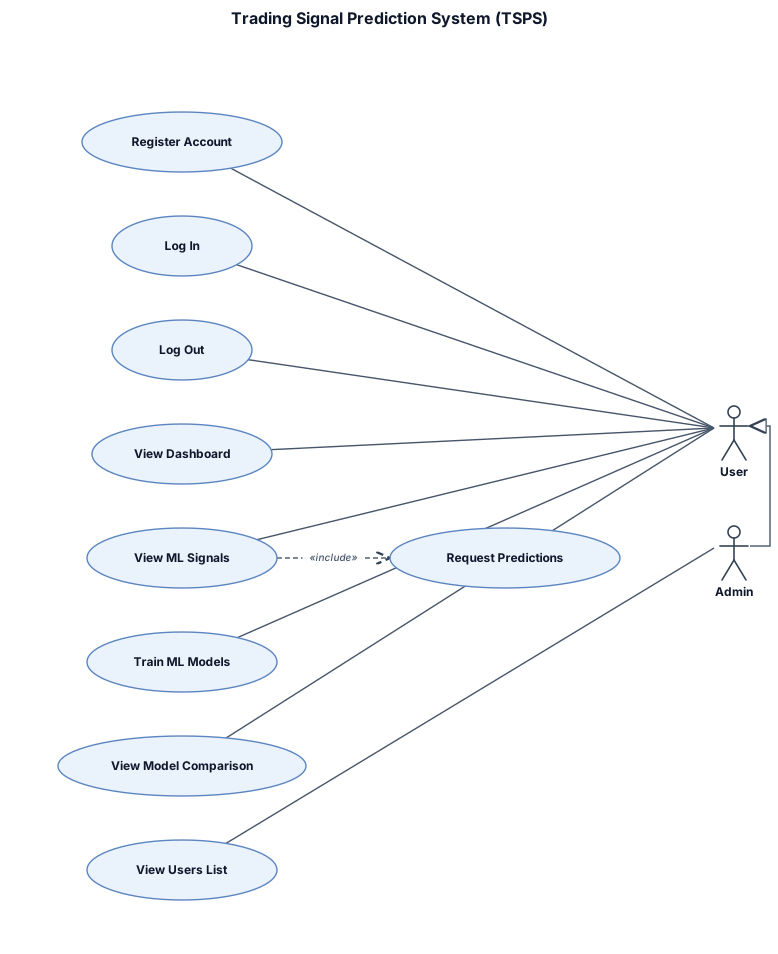
Draw a simple software use case diagram. Create a large rectangle in the center titled: Trading Signal Prediction System (TSPS) Place a stick figure named User on the left. Place a stick figure named Admin on the right. Draw these oval shapes inside the rectangle: Register Account Log In Log Out View Dashboard View ML Signals Request Predictions Train ML Models View Model Comparison View Users List Connect the User to: Register Account Log In Log Out View Dashboard View ML Signals Train ML Models View Model Comparison Connect the Admin to: View Users List Draw a dashed arrow from View ML Signals to Request Predictions. Draw an inheritance arrow from Admin to User. Keep the layout horizontal with clean spacing and no overlapping lines.
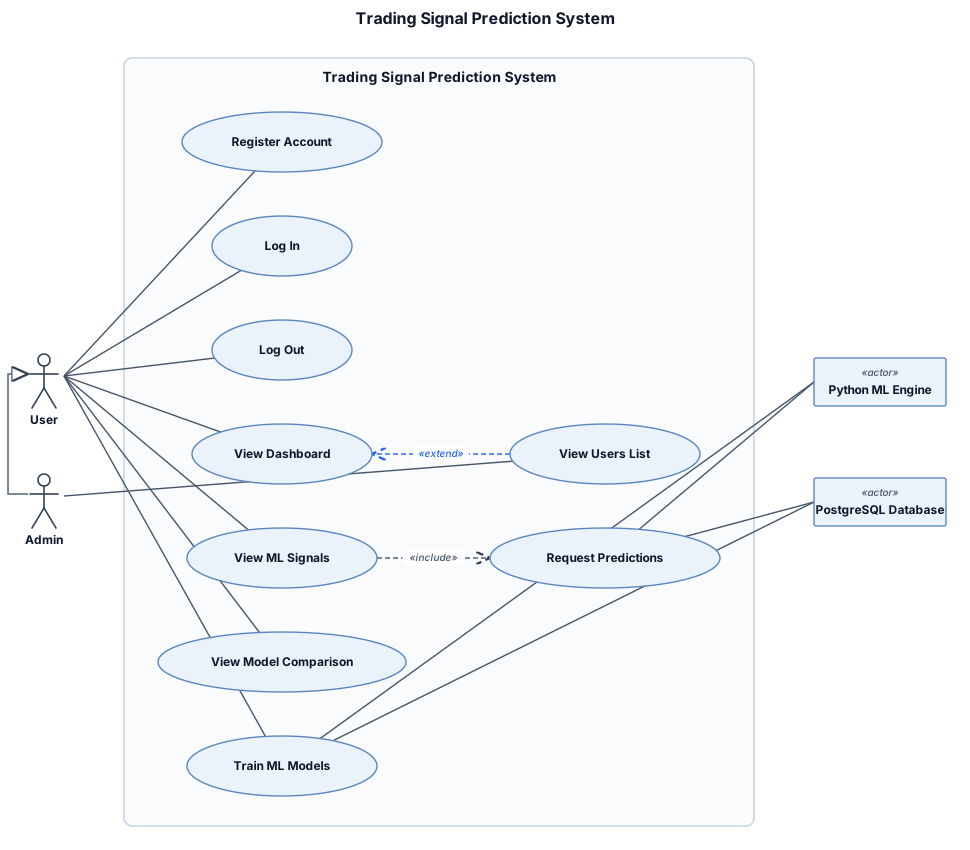
Generate a professional UML Use Case Diagram for a web-based Trading Signal Prediction System (TSPS). use cases inside the system boundary. Actors: 1. User (Primary Actor) 2. Admin (inherits from User) 3. Python ML Engine (Supporting System Actor) 4. PostgreSQL Database (Supporting Actor) Use Cases for User: - Register Account - Log In - Log Out - View Dashboard - View ML Signals - Request Predictions - Train ML Models - View Model Comparison View ML Signals includes: - Request Predictions Admin: - View Users List Relationship: - "View Users List" extends "View Dashboard". - Admin is a specialization (generalization/inheritance) of User. Connect the Python ML Engine to: - Request Predictions - Train ML Models Arrange the diagram horizontally: - Actors on the left and right - System boundary in the center
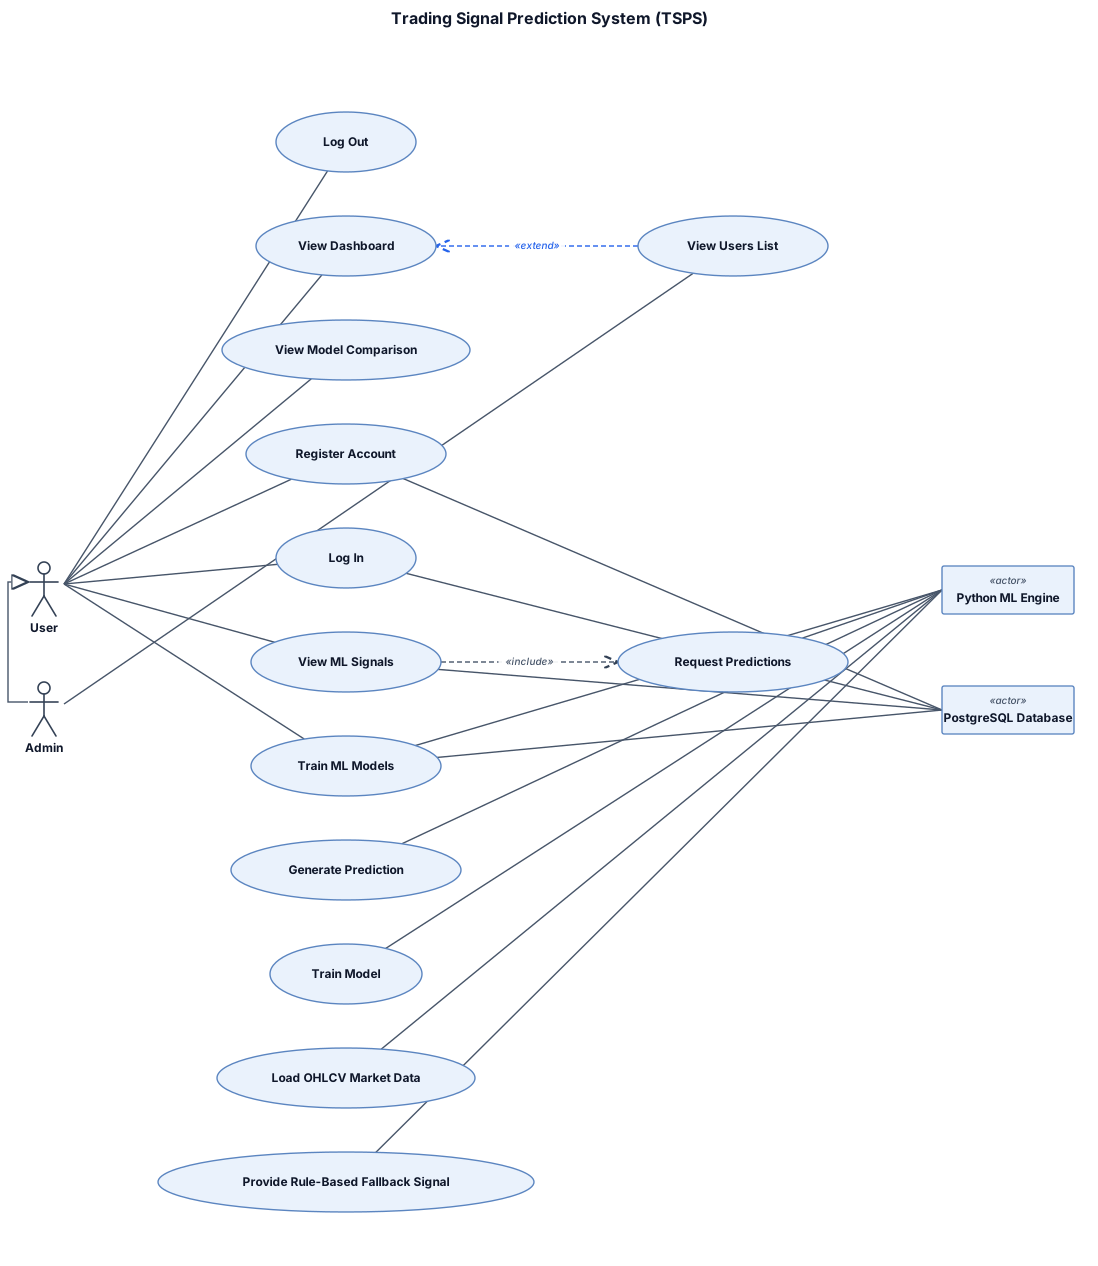
Generate a professionalUse Case Diagram for a web-based Trading Signal Prediction System (TSPS). Actors: 1. User (Primary Actor) 2. Admin (inherits from User) 3. Python ML Engine (Supporting System Actor) 4. PostgreSQL Database (Supporting Actor) Use Cases for User: - Register Account - Log In - Log Out - View Dashboard - View ML Signals - Request Predictions - Train ML Models - View Model Comparison View ML Signals includes: - Request Predictions Admin: - View Users List Relationship: - "View Users List" extends "View Dashboard". - Admin is a specialization (generalization/inheritance) of User. Python ML Engine supports: - Generate Prediction (BUY / SELL / HOLD with Confidence) - Train Model (MACD, EMA Cross, Ichimoku Cloud) - Load OHLCV Market Data from CSV - Provide Rule-Based Fallback Signal Connect the Python ML Engine to: - Request Predictions - Train ML Models Arrange the diagram horizontally: - Actors on the left and right - System boundary in the center - Supporting actors (Python ML Engine and PostgreSQL Database) on the right
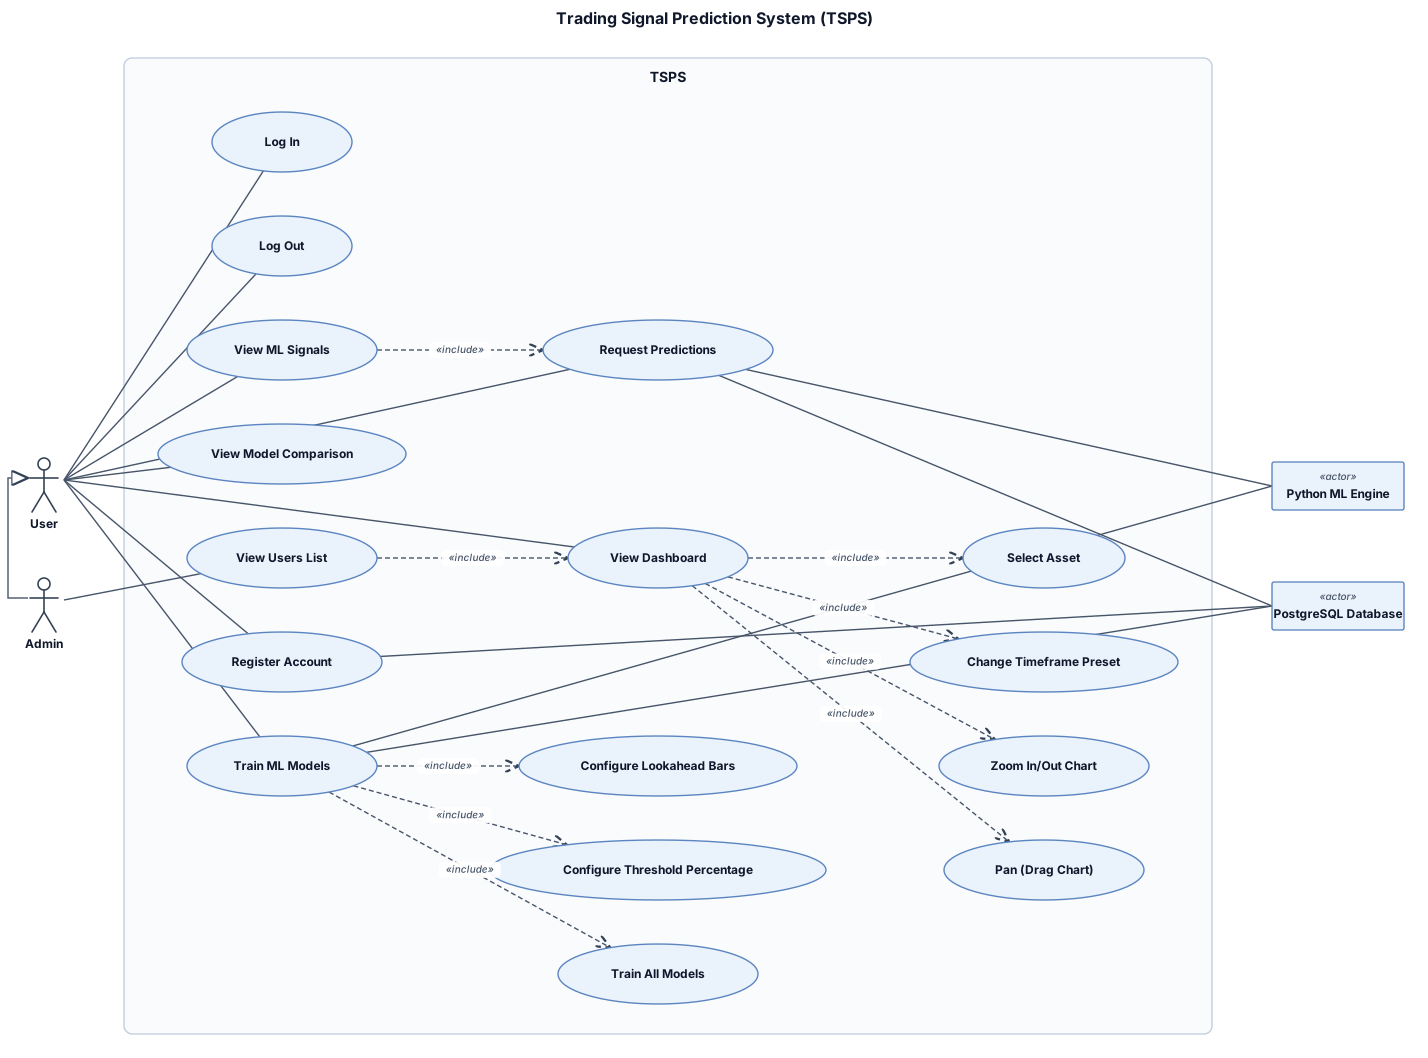
Generate a professional UML Use Case Diagram for a web-based Trading Signal Prediction System (TSPS). Diagram title: Trading Signal Prediction System (TSPS) Draw one system boundary rectangle labeled "TSPS". Place all use cases inside the system boundary. Actors: 1. User (Primary Actor) 2. Admin (inherits from User) 3. Python ML Engine (Supporting System Actor) 4. PostgreSQL Database (Supporting Actor) Use Cases for User: - Register Account - Log In - Log Out - View Dashboard - View ML Signals - Request Predictions - Train ML Models - View Model Comparison View Dashboard includes: - Select Asset - Change Timeframe Preset - Zoom In/Out Chart - Pan (Drag Chart) View ML Signals includes: - Request Predictions Train ML Models includes: - Configure Lookahead Bars - Configure Threshold Percentage - Train All Models Admin: - View Users List Relationship: - "View Users List" extends "View Dashboard". - Admin is a specialization (generalization/inheritance) of User. Python ML Engine supports: - Generate Prediction (BUY / SELL / HOLD with Confidence) - Train Model (MACD, EMA Cross, Ichimoku Cloud) - Load OHLCV Market Data from CSV - Provide Rule-Based Fallback Signal Connect the Python ML Engine to: - Request Predictions - Train ML Models PostgreSQL Database: - Store User Records - Store Prediction Signals - Store Training Runs Connect the PostgreSQL Database with: - Register Account - Request Predictions - Train ML Models Use proper UML notation: - Actors as stick figures - Use cases as ovals - System boundary rectangle - Association lines between actors and use cases - <<include>> relationships - <<extend>> relationship - Generalization (inheritance) from Admin to User Arrange the diagram horizontally: - Actors on the left and right - System boundary in the center - Supporting actors (Python ML Engine and PostgreSQL Database) on the right - Keep the layout clean, symmetrical, and suitable for an academic final-year project report.
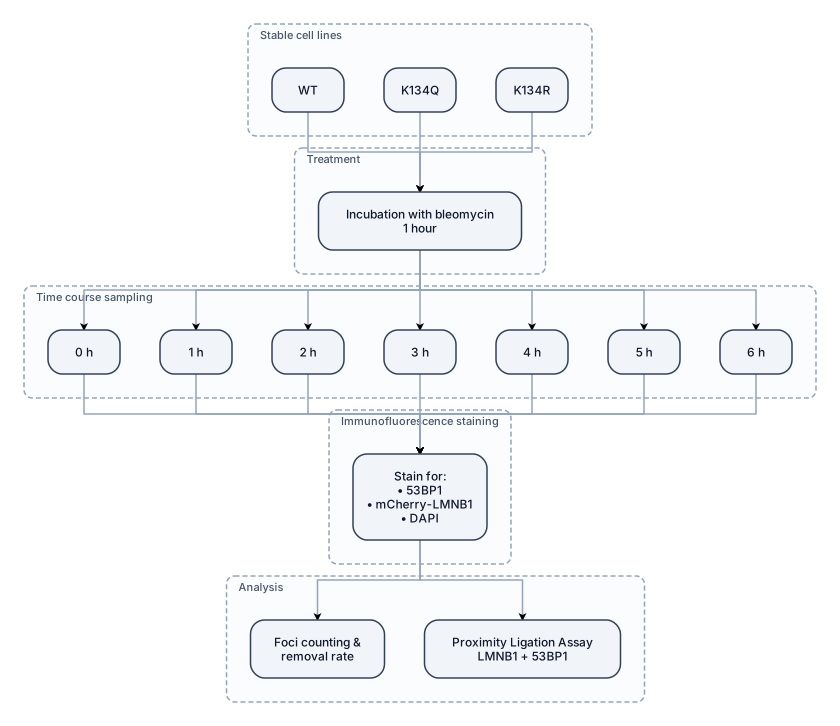
Stable cells (WT/K134Q/K134R) - Incubation with bleomycin for 1 hour - Sampling after 0, 1, 2, 3, 4, 5, 6 hours - Immunofluorescence staining to examine: - 53BP1 (foci vs. diffuse localization) - mCherry-LMNB1 - DAPI - Foci counting and rate of their removal - Proximity ligation assay (PLA) of LMNB1 +
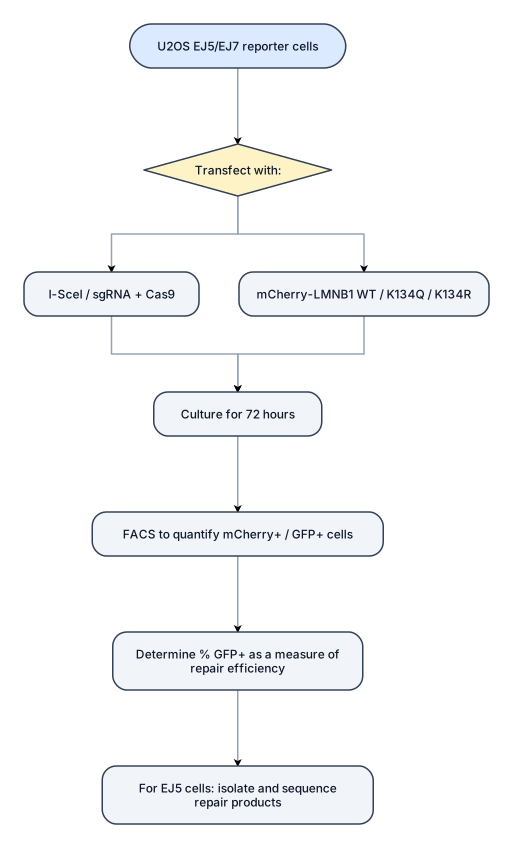
U2OS EJ5/EJ7 reporter cells ↓ Transfect with: ├─ I-SceI / sgRNA + Cas9 └─ mCherry-LMNB1 (WT / K134Q / K134R) ↓ Culture for 72 hours ↓ FACS to quantify mCherry+ / GFP+ cells ↓ Determine % GFP+ as a measure of repair efficiency ↓ For EJ5 cells: isolate and sequence repair products (
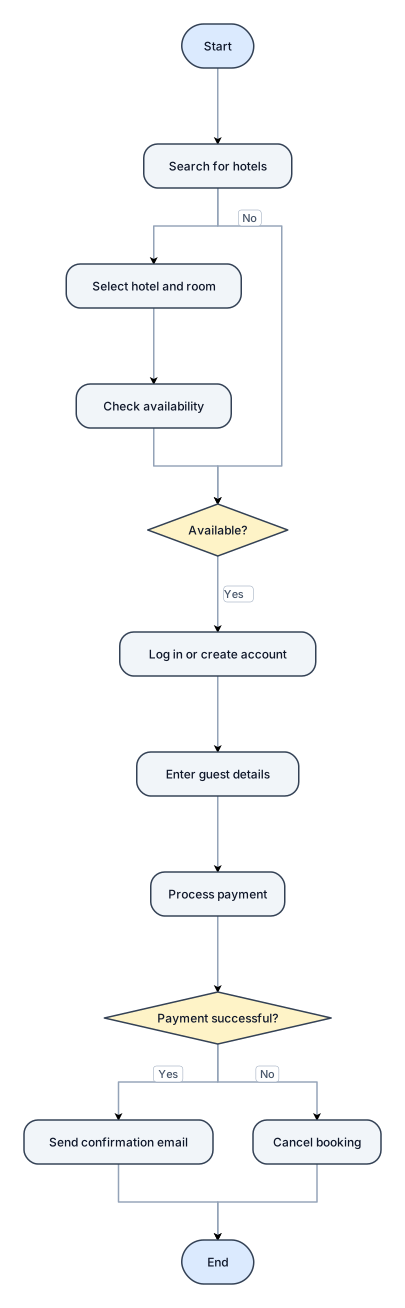
generate flow chart for hotel booking system
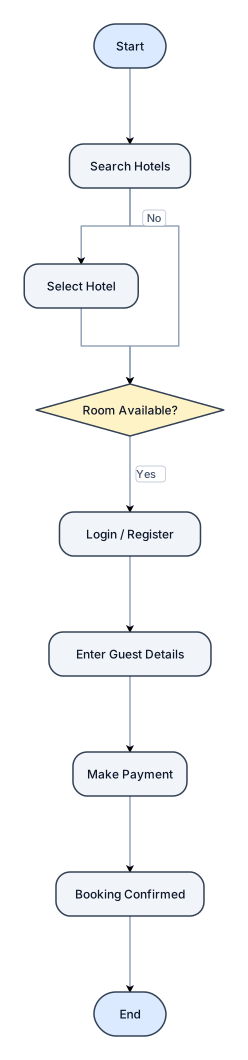
generate a flow chart for hotel booking system
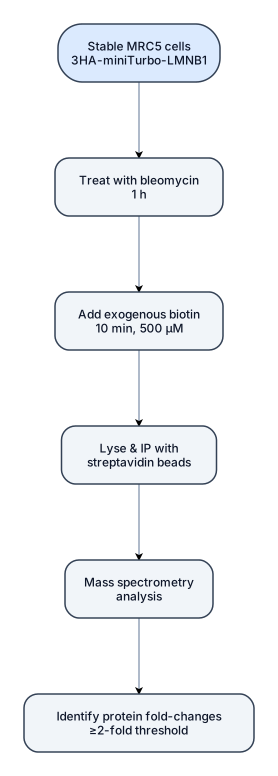
flow chart of Stable MRC5 cells with 3HA-miniTurbo-LMNB1 ↓ Treat with bleomycin (1 h) ↓ Add exogenous biotin (10 min, 500 µM) ↓ Lyse & IP with streptavidin beads ↓ Mass spectrometry analysis ↓ Identify protein fold-changes (2-fold threshold)
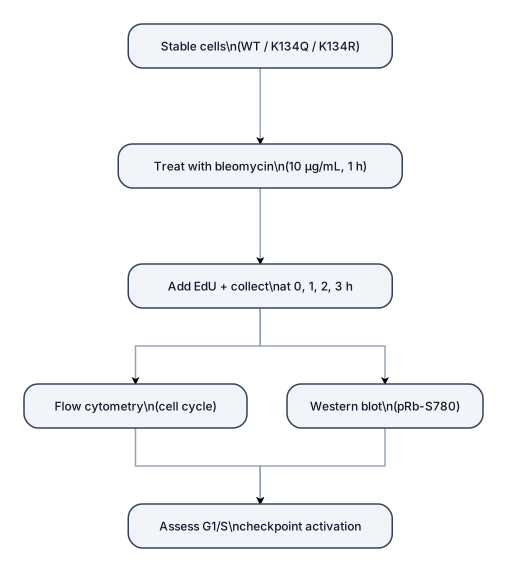
Stable cells (WT / K134Q / K134R) ↓ Treat with bleomycin (10 µg/mL, 1 h) ↓ Add EdU + collect at 0, 1, 2, 3 h ↓ Flow cytometry (cell cycle) + Western blot (pRb-S780) ↓ Assess G1/S checkpoint activation
Focused examples and prompt ideas
Start with the complete visitor wall above, then use these focused collections when you want a narrower subject and more prompt context.
The first curated collection is being prepared.