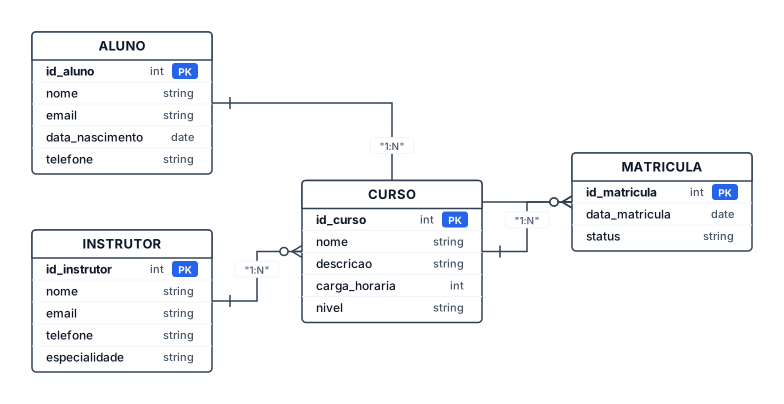
Crie um Diagrama Entidade-Relacionamento (DER) para um sistema chamado EduManager – Sistema de Gestão de Cursos. O sistema deve possuir inicialmente estas 4 entidades: 1. ALUNO Atributos: - id_aluno — chave primária (PK) - nome - email - data_nascimento - telefone 2. CURSO Atributos: - id_curso — chave primária (PK) - nome - descricao - carga_horaria - nivel 3. INSTRUTOR Atributos: - id_instrutor — chave primária (PK) - nome - email - telefone - especialidade 4. MATRICULA Atributos: - id_matricula — chave primária (PK) - data_matricula - status Relacionamentos e cardinalidades 1. ALUNO — MATRICULA - Um aluno pode realizar várias matrículas. - Cada matrícula pertence a apenas um aluno. - Cardinalidade: 1:N 2. CURSO — MATRICULA - Um curso pode possuir várias matrículas. - Cada matrícula pertence a apenas um curso. - Cardinalidade: 1:N 3. INSTRUTOR — CURSO - Um instrutor pode atuar em vários cursos. - Cada curso possui um instrutor. - Cardinalidade: 1:N A entidade MATRICULA deve funcionar como entidade associativa entre ALUNO e CURSO, permitindo representar corretamente que um aluno pode se matricular em vários cursos e que um curso pode possuir vários alunos. Não adicione outras entidades sem necessidade. Organize o diagrama de maneira clara e profissional, mostrando: - Entidades - Atributos - Chaves primárias (PK) - Relacionamentos - Cardinalidades 1:N O resultado deve ser adequado para uma atividade escolar de modelagem de banco de dados e não deve utilizar comandos SQL.
Diagram Examples from Real Visitor Prompts
Browse eligible diagrams shared by FreeDiagram visitors, inspect the exact prompts, and build your own version.
Browse 3279 real creationsMain diagram studio
Showing 697–720 of 1260. No stock examples or system defaults. Choose a tool, study a real result, then reopen its prompt as your starting point.
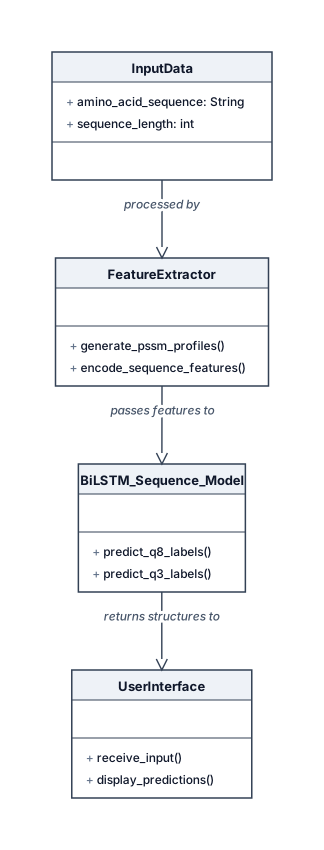
classDiagram direction LR class InputData { +String amino_acid_sequence +int sequence_length } class FeatureExtractor { +generate_pssm_profiles() +encode_sequence_features() } class BiLSTM_Sequence_Model { +predict_q8_labels() +predict_q3_labels() } class UserInterface { +receive_input() +display_predictions() } InputData --> FeatureExtractor : processed by FeatureExtractor --> BiLSTM_Sequence_Model : passes features to BiLSTM_Sequence_Model --> UserInterface : returns structures to
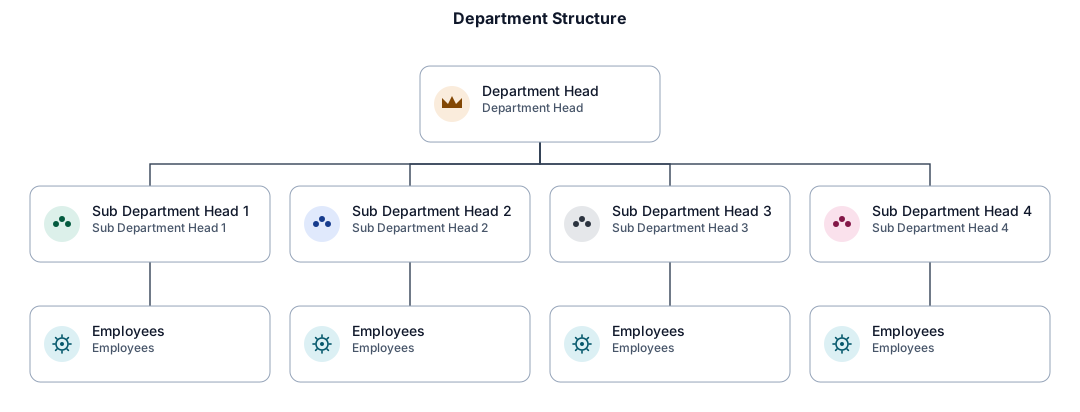
Create visual diagram of department structure including department head, 4 sub department heads and employees for the sub departments, combine all employees as one in each subsection, dont add icons, text only, also include arrows indicating reporting only goes up and not between employees of different departments
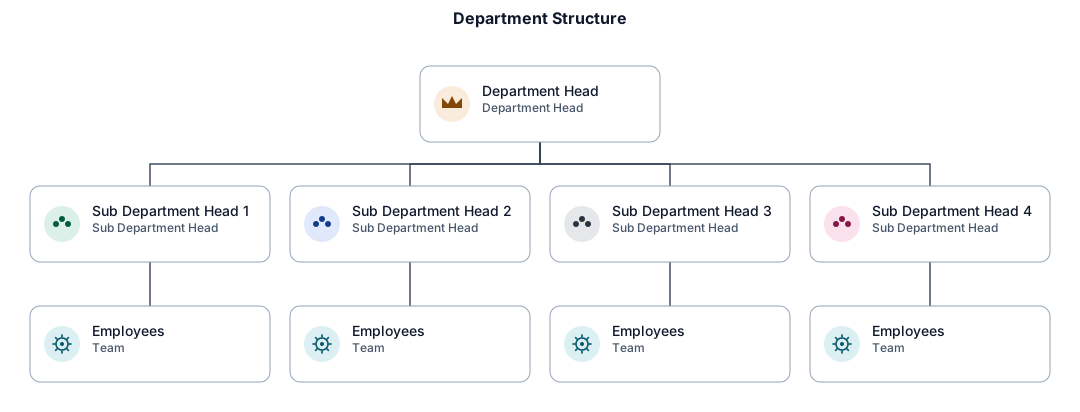
Create visual diagram of department structure including department head, 4 sub department heads and employees for the sub departments, combine all employees as one in each subsection, dont include logos or any visual images before the name
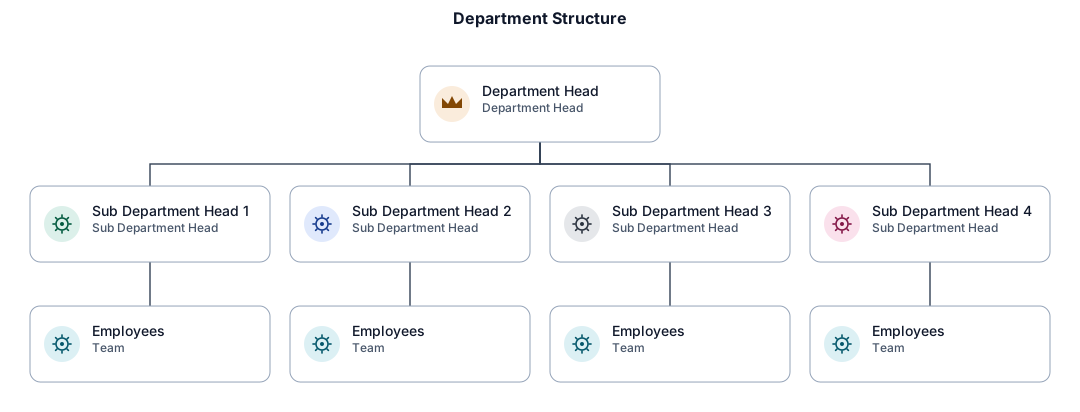
Create visual diagram of department structure including department head, 4 sub department heads and employees for the sub departments, combine all employees as one in each subsection, dont include logos

Create visual diagram of department structure including department head, 4 sub department heads and employees for the sub departments
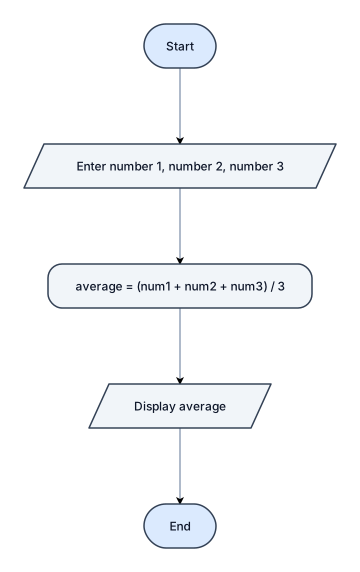
2)an algorithm that ask a user to enter 3 numbers and calculates the average and displays the average
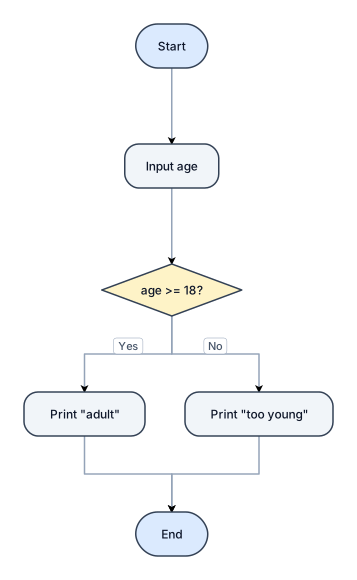
an algorithm that asks for a user`s age and prints ''adult'' for people adove 18 and prints ''too young'' for people less than 18
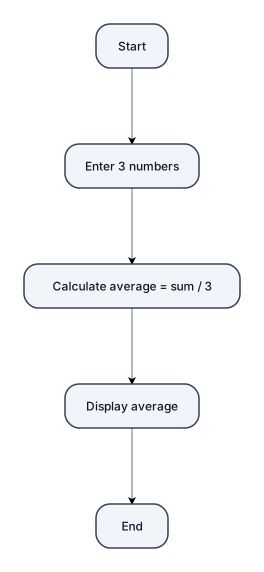
an algorithm that asks a user to enter 3 numbers and calculates the average and display the average
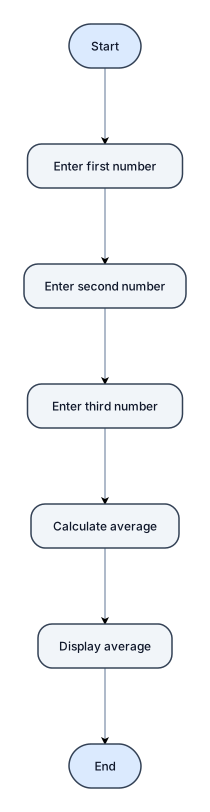
2) An algorithm that asks a user to enter 3 numbers and calculates the average and display the average.
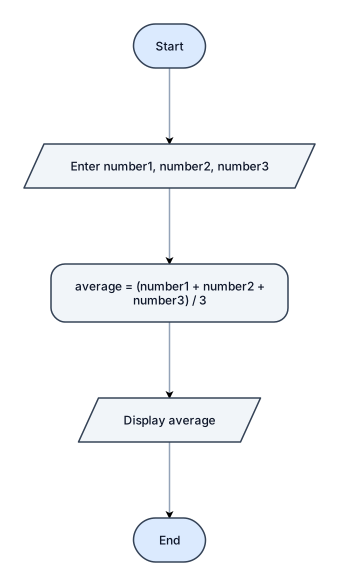
an algorithm that asks a user to enter 3 numbers and calculates the average and displays the average
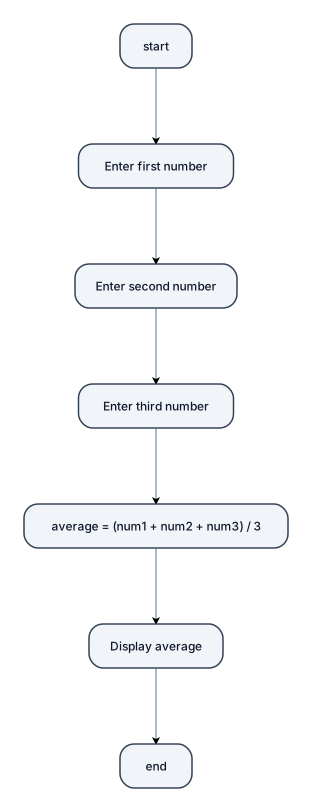
2 an algorithm that asks a user to enter 3 numbers and calculate the average and displays the average
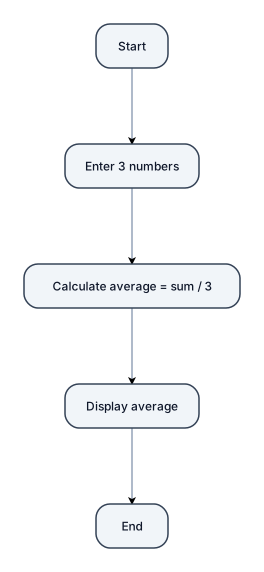
2)An algorithm that asks a user to enter 3 numbers and calculate the average and displays the average
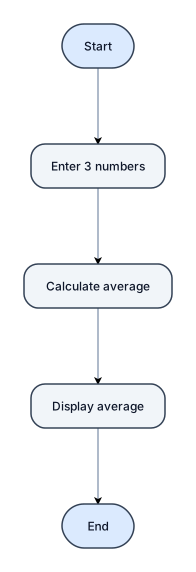
An algorithm that asks a user to enter 3 numbers and calculates the average and displays the average.
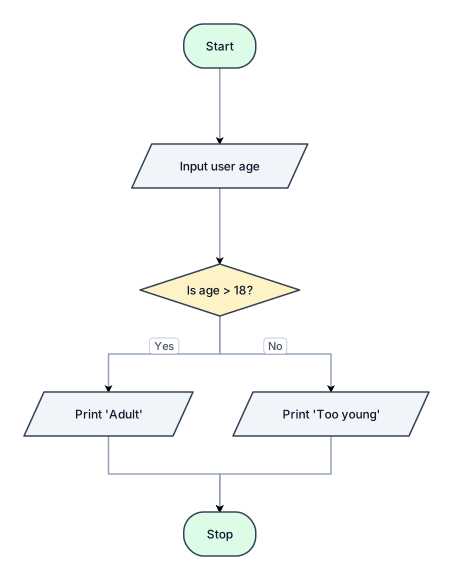
An algorithm that asks for a user age's and print "Adult" for people above 18 and print too young for people less than 18
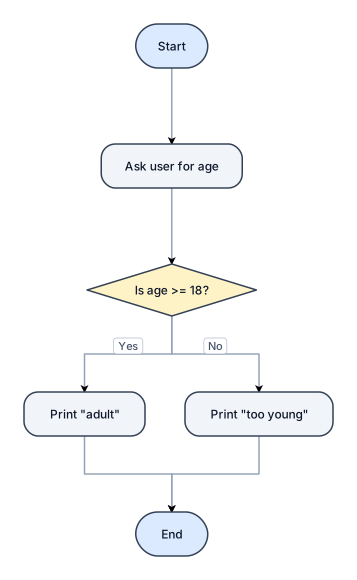
an algorithm that ask for a users age and prints adult for people above 18 and prints too young for people less than 18
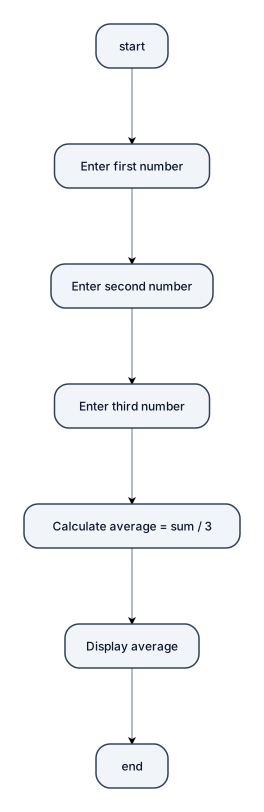
An algorithm that asks a user to enter 3 numbers and calculates the average and displays the awerage
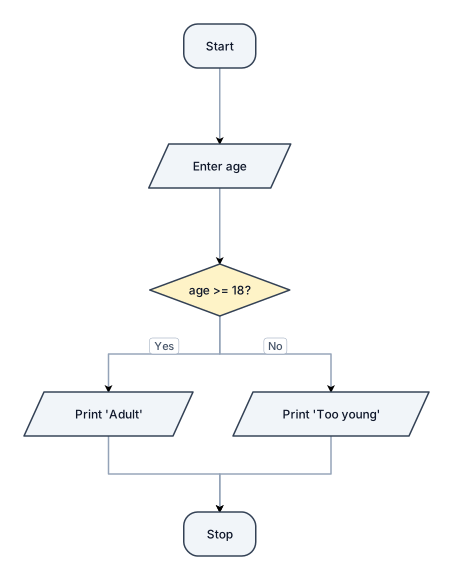
1) An algorithm that asks for a user's age and prints "Adult" for people above 18 and prints "Too young" for people less than 18.
![Main diagram studio: 1]an algorithm that asks for a users age and prints adults,for people above 18 and prints too young for people less than 18.](https://psvtykrtciekraoilfux.supabase.co/storage/v1/object/public/gallery-assets/freediagram/feed/bba19947-70f6-4a9d-8c17-f84959334c13.svg)
1]an algorithm that asks for a users age and prints adults,for people above 18 and prints too young for people less than 18.
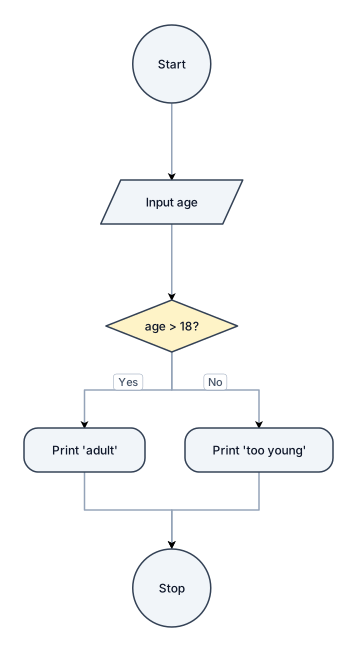
1)An algorithm that asks for a user's age and prints''adult'' for people above 18 and prints ''too young'' for people less than 18
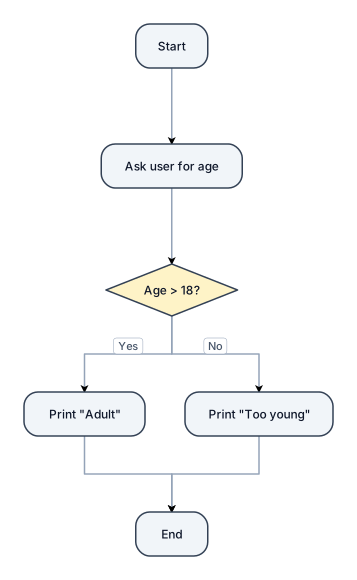
1 an algorithm that asks for a user age and prints Adult for people above 18 and prints too young for people less than 18
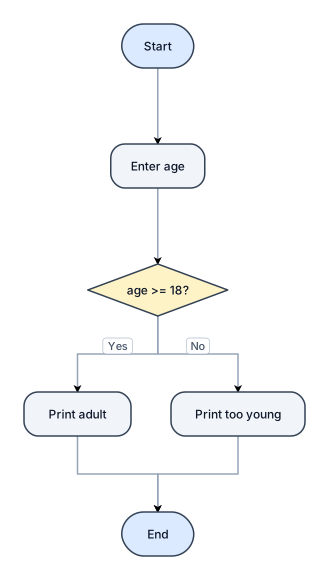
an algorithm that asks for a users age and prints "adult" for people above 18 and prints "too young" for people less than 18.
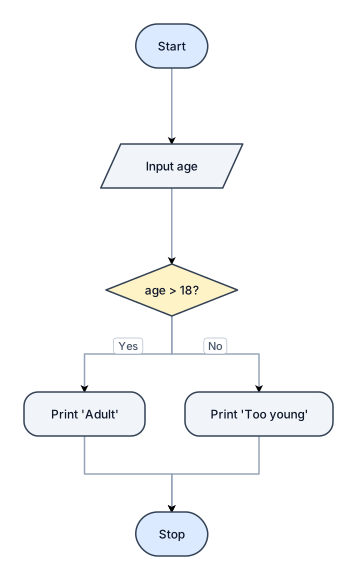
An algorithm that asks for a user s age and prints "abult" for people above 18 and prints "Too young" for people less than 18
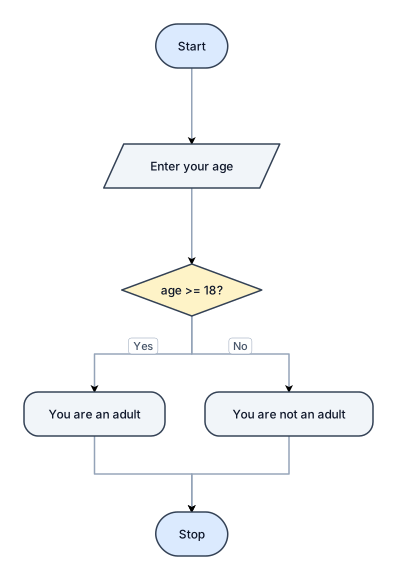
Design a flowchart for an algorithm that checks if you are an adult or not by asking your age