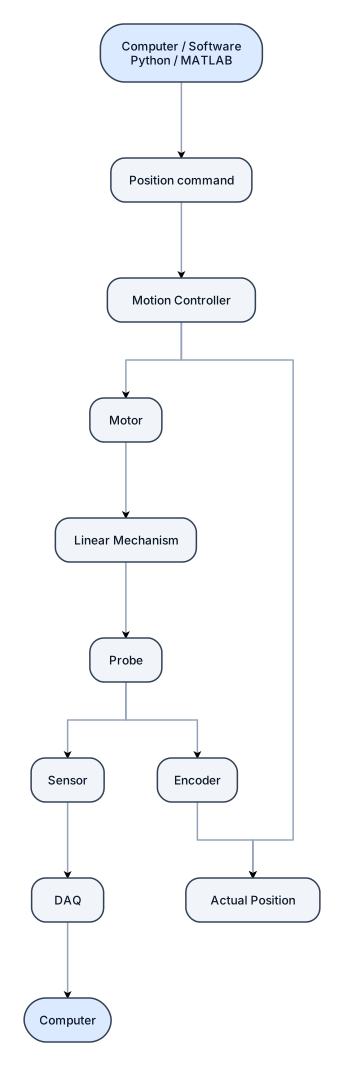
┌──────────────────────┐ │ COMPUTER / SOFTWARE │ │ Python / MATLAB │ └──────────┬───────────┘ │ Position command ▼ ┌──────────────────────┐ │ MOTION CONTROLLER │◄──────────────┐ └──────────┬───────────┘ │ │ │ ▼ │ MOTOR │ │ │ ▼ │ LINEAR MECHANISM │ │ │ ▼ │ PROBE │ / \ │ ▼ ▼ │ ENCODER SENSOR │ │ │ │ │ ▼ │ │ DAQ ─────────► COMPUTER │ │ │ └──── ACTUAL POSITION ────────────┘ writ his process in text for ai freedgiram to make state diagrma
NODE ARCHIVE · REAL DIAGRAM BRIEFS
Diagram Examples from Real Visitor Prompts
Browse eligible diagrams shared by FreeDiagram visitors, inspect the exact prompts, and build your own version.
Browse 1008 real creationsCOMMUNITY OUTPUTS · EXACT PROMPTS
Main diagram studio
Showing 121–144 of 601. No stock examples or system defaults. Choose a tool, study a real result, then reopen its prompt as your starting point.
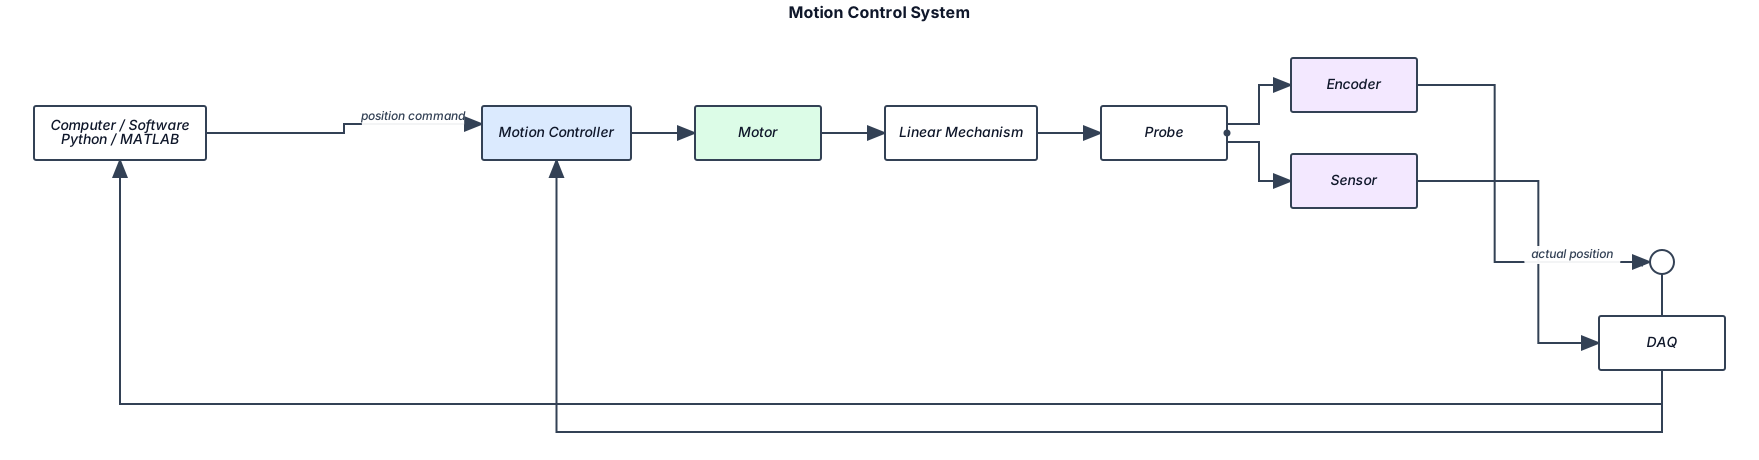
┌──────────────────────┐ │ COMPUTER / SOFTWARE │ │ Python / MATLAB │ └──────────┬───────────┘ │ Position command ▼ ┌──────────────────────┐ │ MOTION CONTROLLER │◄──────────────┐ └──────────┬───────────┘ │ │ │ ▼ │ MOTOR │ │ │ ▼ │ LINEAR MECHANISM │ │ │ ▼ │ PROBE │ / \ │ ▼ ▼ │ ENCODER SENSOR │ │ │ │ │ ▼ │ │ DAQ ─────────► COMPUTER │ │ │ └──── ACTUAL POSITION ────────────┘
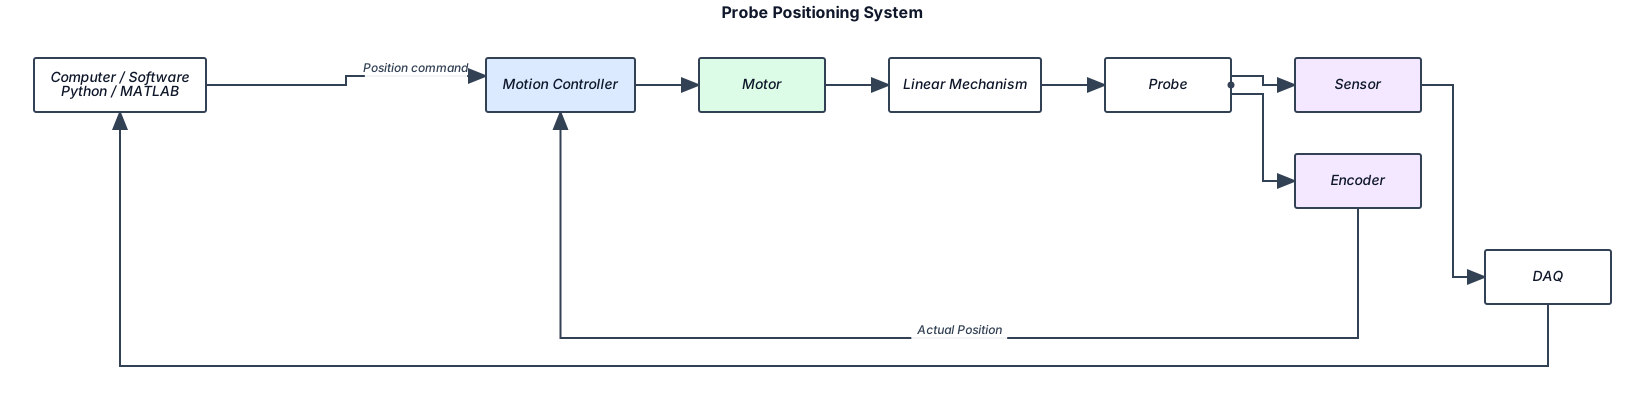
┌──────────────────────┐ │ COMPUTER / SOFTWARE │ │ Python / MATLAB │ └──────────┬───────────┘ │ Position command ▼ ┌──────────────────────┐ │ MOTION CONTROLLER │◄──────────────┐ └──────────┬───────────┘ │ │ │ ▼ │ MOTOR │ │ │ ▼ │ LINEAR MECHANISM │ │ │ ▼ │ PROBE │ / \ │ ▼ ▼ │ ENCODER SENSOR │ │ │ │ │ ▼ │ │ DAQ ─────────► COMPUTER │ │ │ └──── ACTUAL POSITION ────────────┘ w
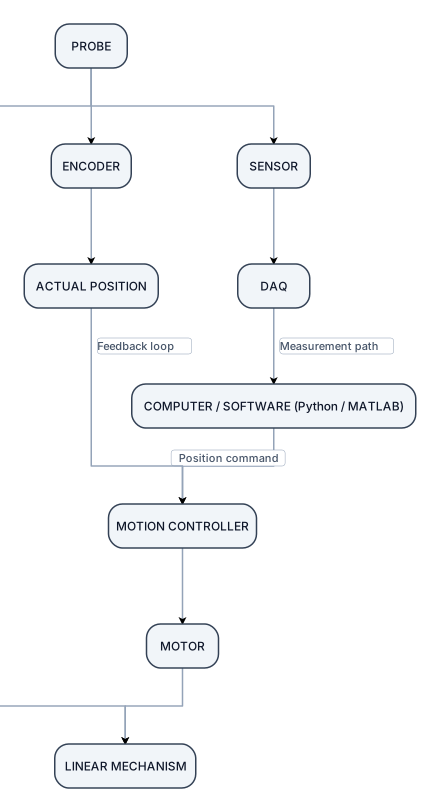
Create a simple flowchart with these exact connections and directions: COMPUTER / SOFTWARE (Python / MATLAB) ↓ Position command MOTION CONTROLLER ↓ MOTOR ↓ LINEAR MECHANISM ↓ PROBE From PROBE: → ENCODER → ACTUAL POSITION → back to MOTION CONTROLLER Also from PROBE: → SENSOR → DAQ → COMPUTER Show the encoder path as a feedback loop. Show the sensor/DAQ path as a separate measurement path. Do not connect DAQ to Motion Controller. Keep it clean, simple, and suitable for a first engineering team meeting.
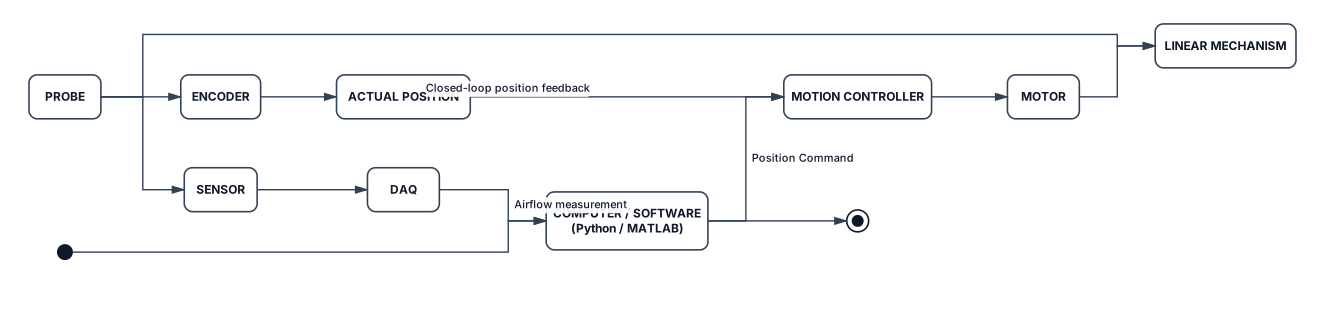
Create a simple engineering system flowchart showing how an automated wind-tunnel probe system is connected. Start with: COMPUTER / SOFTWARE (Python / MATLAB) → Position Command → MOTION CONTROLLER → MOTOR → LINEAR MECHANISM → PROBE From the PROBE, split into two paths: PROBE → ENCODER → ACTUAL POSITION → MOTION CONTROLLER This is the closed-loop position feedback path. At the same time: PROBE → SENSOR → DAQ → COMPUTER / SOFTWARE This is the airflow measurement path. The overall system therefore has two connected loops: 1. CONTROL LOOP: Computer → Motion Controller → Motor → Linear Mechanism → Probe → Encoder → Actual Position → Motion Controller 2. MEASUREMENT LOOP: Probe → Sensor → DAQ → Computer Make the diagram simple and clean. Show the Encoder feedback arrow returning to the Motion Controller. Show the DAQ measurement arrow returning to the Computer. Do NOT connect the DAQ directly to the Motion Controller. The main idea is: the computer tells the probe where to move, the motor and linear mechanism move the probe, the encoder tells the controller the actual position, while the sensor and DAQ measure the airflow and send the measurement back to the computer.

┌──────────────────────┐ │ COMPUTER / SOFTWARE │ │ Python / MATLAB │ └──────────┬───────────┘ │ Position command ▼ ┌──────────────────────┐ │ MOTION CONTROLLER │◄──────────────┐ └──────────┬───────────┘ │ │ │ ▼ │ MOTOR │ │ │ ▼ │ LINEAR MECHANISM │ │ │ ▼ │ PROBE │ / \ │ ▼ ▼ │ ENCODER SENSOR │ │ │ │ │ ▼ │ │ DAQ ─────────► COMPUTER │ │ │ └──── ACTUAL POSITION ────────────┘
┌──────────────────────┐ │ COMPUTER / SOFTWARE │ │ Python / MATLAB │ └──────────┬───────────┘ │ Position command ▼ ┌──────────────────────┐ │ MOTION CONTROLLER │◄──────────────┐ └──────────┬───────────┘ │ │ │ ▼ │ MOTOR │ │ │ ▼ │ LINEAR MECHANISM │ │ │ ▼ │ PROBE │ / \ │ ▼ ▼ │ ENCODER SENSOR │ │ │ │ │ ▼ │ │ DAQ ─────────► COMPUTER │ │ │ └──── ACTUAL POSITION ────────────┘
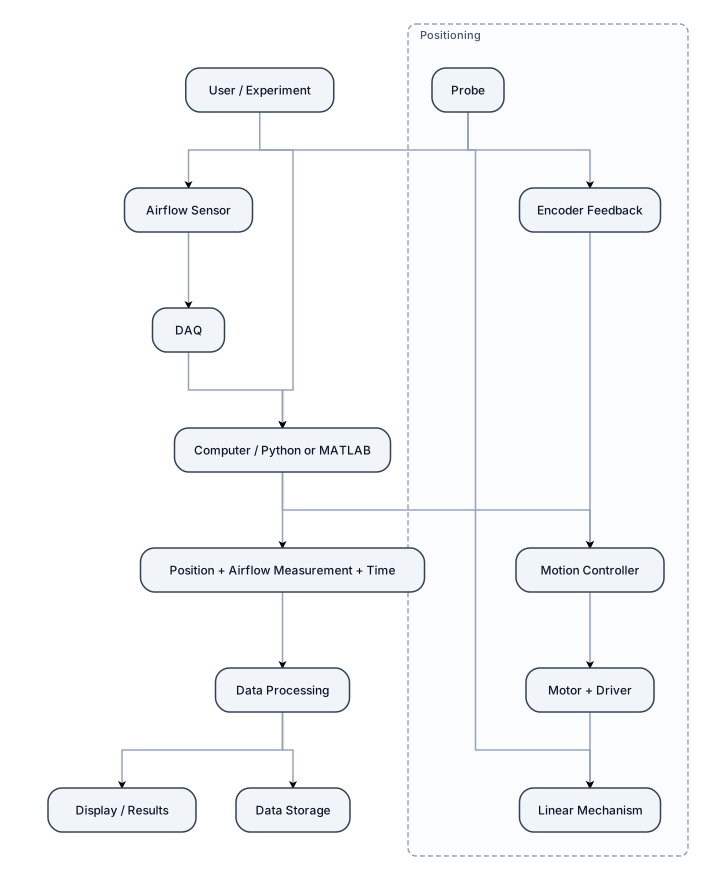
Create a simple engineering flowchart showing the overall connection of an automated wind-tunnel probe traversing system. USER / EXPERIMENT ↓ COMPUTER / PYTHON OR MATLAB ↓ ┌──────────────────────┐ │ POSITIONING SYSTEM │ │ Motion Controller │ │ ↓ │ │ Motor + Driver │ │ ↓ │ │ Linear Mechanism │ │ ↓ │ │ Probe │ │ ↑ │ │ Encoder Feedback │ └──────────────────────┘ At the same time: PROBE ↓ AIRFLOW SENSOR ↓ DAQ ↓ COMPUTER Then show: POSITION + AIRFLOW MEASUREMENT + TIME ↓ DATA PROCESSING ↓ DISPLAY / RESULTS ↓ DATA STORAGE Make it a clean, simple block diagram for a first engineering team meeting. Clearly show that the computer controls the positioning system, the encoder provides position feedback, and the DAQ sends measurement data to the computer. Do not include detailed component specifications, communication protocols, or complicated interfaces. Use simple rectangular blocks and clear arrows.
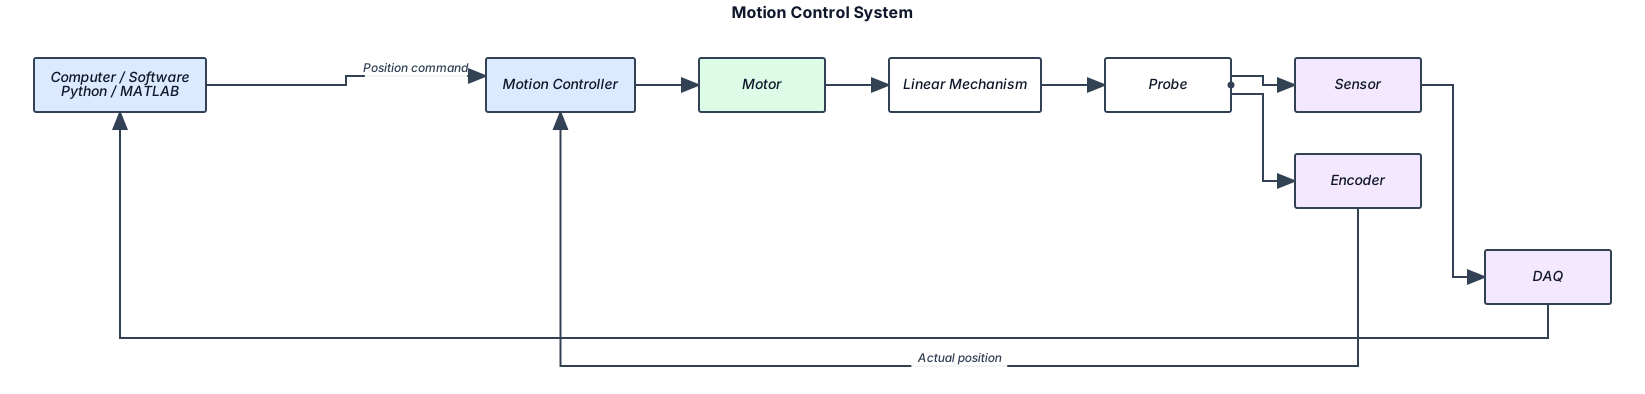
┌──────────────────────┐ │ COMPUTER / SOFTWARE │ │ Python / MATLAB │ └──────────┬───────────┘ │ Position command ▼ ┌──────────────────────┐ │ MOTION CONTROLLER │◄──────────────┐ └──────────┬───────────┘ │ │ │ ▼ │ MOTOR │ │ │ ▼ │ LINEAR MECHANISM │ │ │ ▼ │ PROBE │ / \ │ ▼ ▼ │ ENCODER SENSOR │ │ │ │ │ ▼ │ │ DAQ ─────────► COMPUTER │ │ │ └──── ACTUAL POSITION ────────────┘
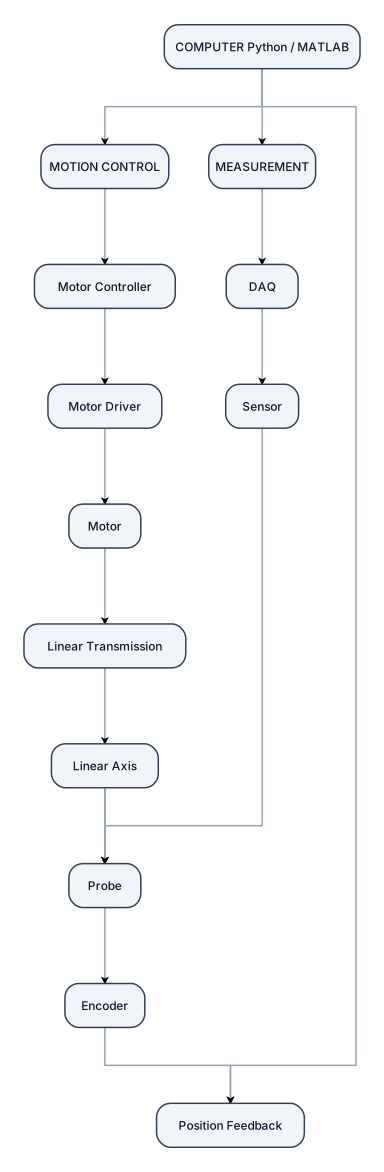
COMPUTER Python / MATLAB │ ┌─────────┴─────────┐ ↓ ↓ MOTION CONTROL MEASUREMENT │ │ Motor Controller DAQ │ ↑ Motor Driver │ │ │ Motor Sensor │ ↑ Linear Transmission Probe │ ↑ Linear Axis ←────────────┘ │ Probe │ Encoder │ └──────→ Position Feedback
A flowchart of a new-user onboarding flow from signup to first activation, with a verification branch COMPUTER Python / MATLAB │ ┌─────────┴─────────┐ ↓ ↓ MOTION CONTROL MEASUREMENT │ │ Motor Controller DAQ │ ↑ Motor Driver │ │ │ Motor Sensor │ ↑ Linear Transmission Probe │ ↑ Linear Axis ←────────────┘ │ Probe │ Encoder │ └──────→ Position Feedback
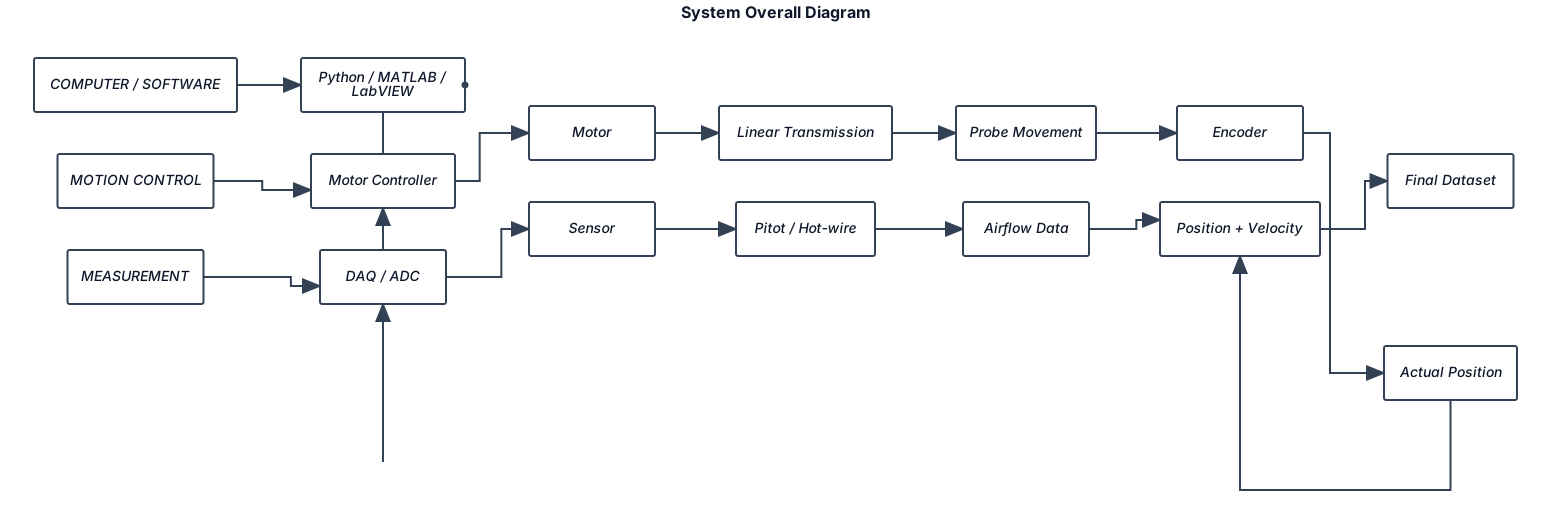
make system overall diagram imagel like this below COMPUTER / SOFTWARE Python / MATLAB / LabVIEW │ ┌────────┴────────┐ │ │ MOTION CONTROL MEASUREMENT │ │ Motor Controller DAQ / ADC │ │ Motor Sensor │ │ Linear Transmission Pitot / Hot-wire │ │ Probe Movement Airflow Data │ │ Encoder ───────────────┘ │ Actual Position │ └────→ Position + Velocity ↓ Final Dataset
اینوگرافی عروسکی دخترانه گرامر زبان درس دوم پایه هفتم
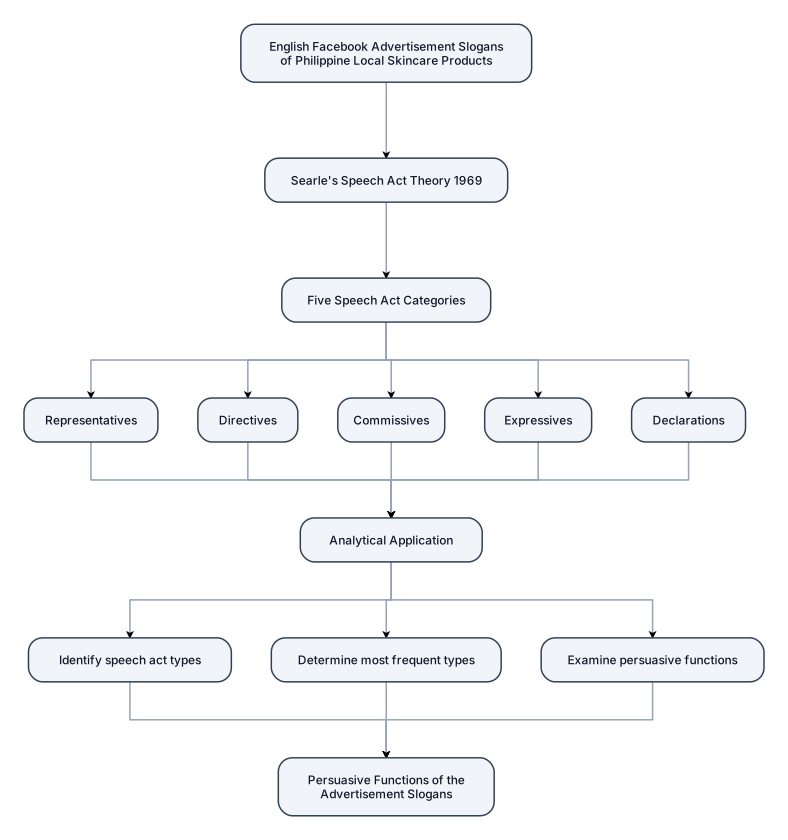
ENGLISH FACEBOOK ADVERTISEMENT SLOGANS OF PHILIPPINE LOCAL SKINCARE PRODUCTS ↓ SEARLE'S SPEECH ACT THEORY (1969) ↓ FIVE SPEECH ACT CATEGORIES ┌──────────┬──────────┬──────────┐ │Represent.│Directives│Commissives│ │Expressives│Declarations│ └──────────┴──────────┴──────────┘ ↓ ANALYTICAL APPLICATION • Identify speech act types • Determine most frequent types • Examine persuasive functions ↓ PERSUASIVE FUNCTIONS OF THE ADVERTISEMENT SLOGANS
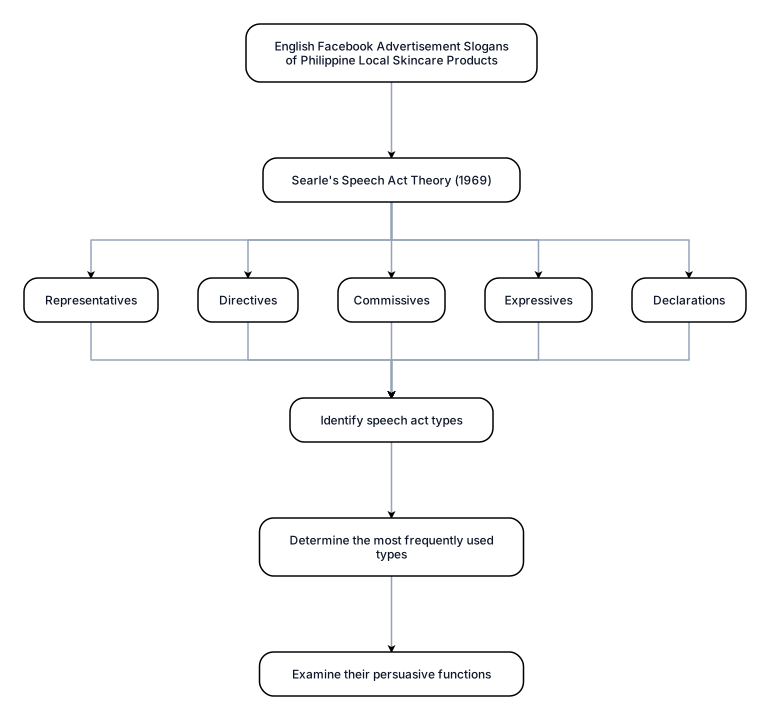
Create a clean, formal academic conceptual framework diagram for a qualitative thesis. Do not use an IPO model. Use a vertical theory-to-analysis flowchart. The study analyzes English Facebook advertisement slogans of Philippine local skincare products. Show the relationship: English Facebook Advertisement Slogans → Searle's Speech Act Theory (1969) → Five Speech Act Categories (Representatives, Directives, Commissives, Expressives, Declarations) → Analytical Application (identify speech act types, determine the most frequently used types, examine their persuasive functions). Use simple rectangular boxes, arrows, minimal colors, and a professional university thesis style.

i want an elecric circuit for an 2 or 1 track digital audio looper. I need as an input 2 inputs. an XLR 5 pin and an 1/4 inch jack socket. as an output i want only an 1/4 inch jack socket.
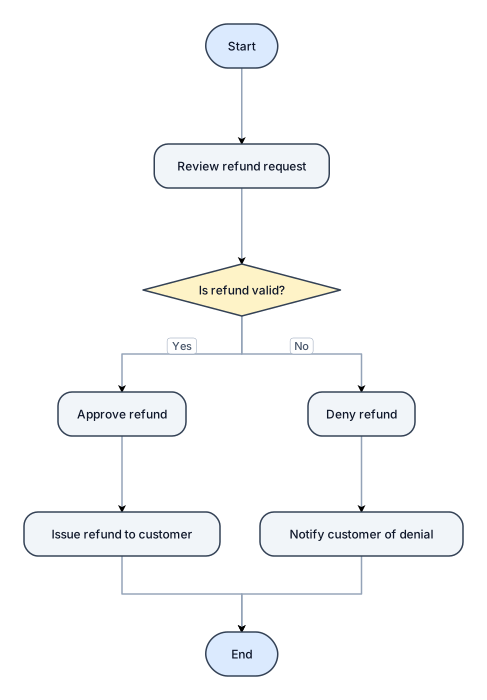
A flowchart for handling a customer refund request, with approve and deny paths
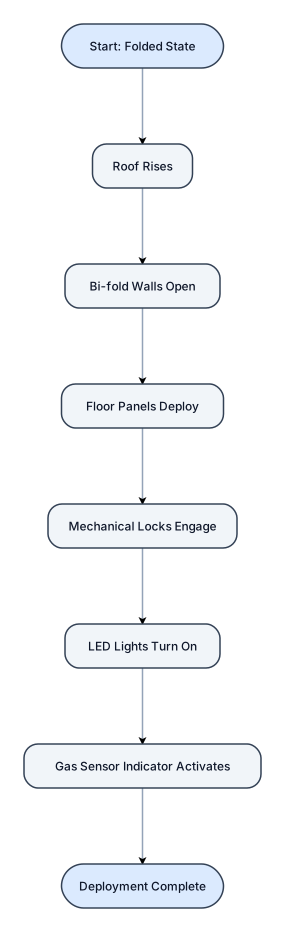
“Show the step-by-step deployment process of a 1:10 foldable house: folded state → roof rises → bi-fold walls open → floor panels deploy → mechanical locks engage → LED lights turn on → gas sensor indicator activates.”
![Main diagram studio: A timeline of the steps to launch a new product over three months "[ Macro Environmental Driver ] Environmental Salinity & Cyclonic Events │ ▼ [ Insti](https://psvtykrtciekraoilfux.supabase.co/storage/v1/object/public/gallery-assets/freediagram/feed/1bc95177-7c25-436d-a0eb-30ab6ac2badd.svg)
A timeline of the steps to launch a new product over three months "[ Macro Environmental Driver ] Environmental Salinity & Cyclonic Events │ ▼ [ Institutional & Governance Bottleneck ] Elite Capture, Corrupt Infrastructure Fees (BDT 10-12k), Failing Public Clinics │ ▼ [ Gendered Division of Labor ] Long-Distance Water Fetching (Heavy Kolshis) & Domestic Rationing │ ▼ [ Embodied Reproductive Morbidity ] UTIs, Gestational Hypertension, Pre-Eclampsia, Miscarriages, MHM Risks │ ▼ [ Socioeconomic Exhaustion ] High Out-of-Pocket Medical Expenses & High-Interest Micro-Credit (Samiti) Debt Figure 1: The Multi-Dimensional Cycle of Climate-Induced Gender Vulnerability
![Main diagram studio: A flowchart for handling a customer refund request, with approve and deny paths "[ Macro Environmental Driver ] Environmental Salinity & Cyclonic Even](https://psvtykrtciekraoilfux.supabase.co/storage/v1/object/public/gallery-assets/freediagram/feed/88335cc7-5c0c-41dc-af85-62958ebd3e69.svg)
A flowchart for handling a customer refund request, with approve and deny paths "[ Macro Environmental Driver ] Environmental Salinity & Cyclonic Events │ ▼ [ Institutional & Governance Bottleneck ] Elite Capture, Corrupt Infrastructure Fees (BDT 10-12k), Failing Public Clinics │ ▼ [ Gendered Division of Labor ] Long-Distance Water Fetching (Heavy Kolshis) & Domestic Rationing │ ▼ [ Embodied Reproductive Morbidity ] UTIs, Gestational Hypertension, Pre-Eclampsia, Miscarriages, MHM Risks │ ▼ [ Socioeconomic Exhaustion ] High Out-of-Pocket Medical Expenses & High-Interest Micro-Credit (Samiti) Debt Figure 1: The Multi-Dimensional Cycle of Climate-Induced Gender Vulnerability
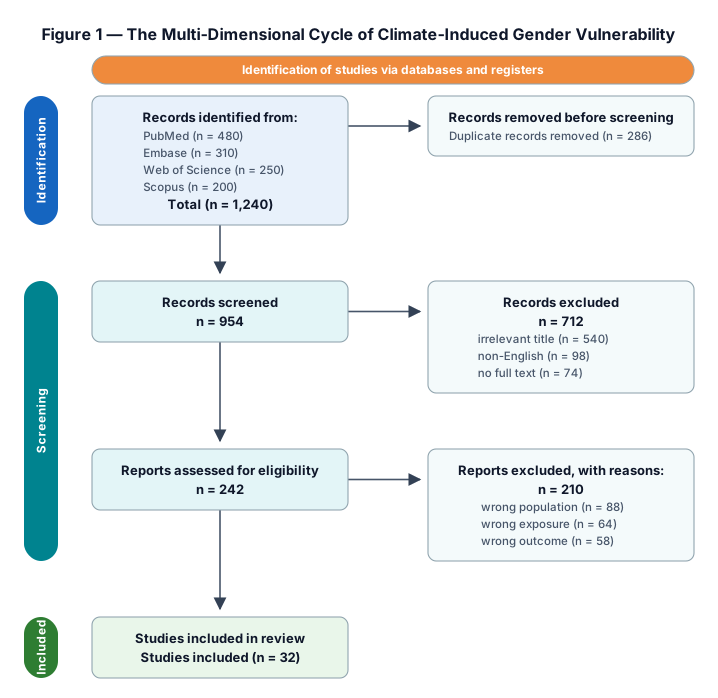
A PRISMA study-selection flow from 1,240 identified records through deduplication, screening, eligibility, and 32 included studies "Figure 1: The Multi-Dimensional Cycle of Climate-Induced Gender VulnerabilityWhere to place it: At the end of Section 6.1 (Introduction) or the beginning of Section 6.2 (Spatial & Gendered Embodiment).Purpose: Serves as the overarching conceptual map for the entire chapter. It visually introduces the reader to how macro environmental drivers trickle down through institutional gaps to create bodily harms. Visual Format: A top-down or cyclical Flowchart / System Dynamics Diagram.What it shows:Environmental Trigger: Salinity intrusion & extreme weather events. Institutional Gatekeeping: Elite capture, missing public infrastructure, corrupt tank distribution. Gendered Labor: Long-distance water fetching, carrying heavy kolshis, domestic water rationing. Embodied Health Harms: UTIs, skin lesions, gestational hypertension, miscarriages, compromised MHM. Financial Exhaustion: Out-of-pocket healthcare costs, high-interest micro-credit (samiti) debt traps.
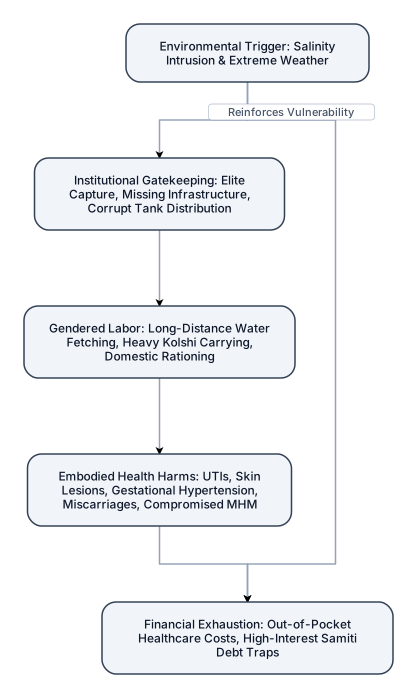
A flowchart for handling a customer refund request, with approve and deny paths "Figure 1: The Multi-Dimensional Cycle of Climate-Induced Gender VulnerabilityWhere to place it: At the end of Section 6.1 (Introduction) or the beginning of Section 6.2 (Spatial & Gendered Embodiment).Purpose: Serves as the overarching conceptual map for the entire chapter. It visually introduces the reader to how macro environmental drivers trickle down through institutional gaps to create bodily harms. Visual Format: A top-down or cyclical Flowchart / System Dynamics Diagram.What it shows:Environmental Trigger: Salinity intrusion & extreme weather events. Institutional Gatekeeping: Elite capture, missing public infrastructure, corrupt tank distribution. Gendered Labor: Long-distance water fetching, carrying heavy kolshis, domestic water rationing. Embodied Health Harms: UTIs, skin lesions, gestational hypertension, miscarriages, compromised MHM. Financial Exhaustion: Out-of-pocket healthcare costs, high-interest micro-credit (samiti) debt traps.
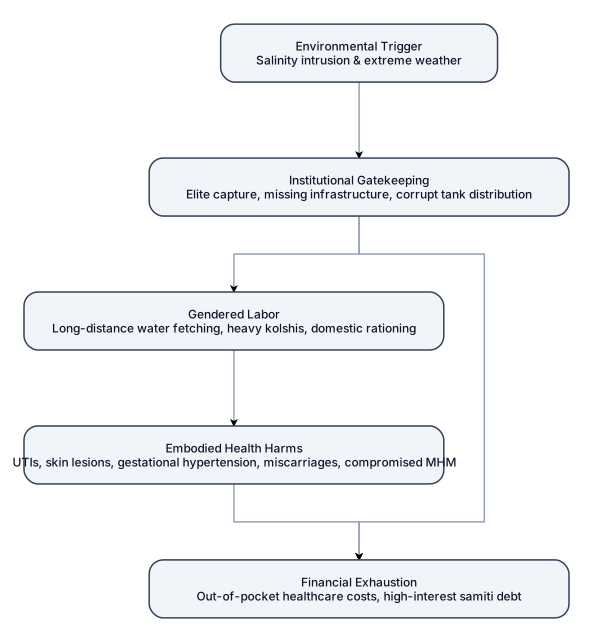
A timeline of the steps to launch a new product over three months "Figure 1: The Multi-Dimensional Cycle of Climate-Induced Gender VulnerabilityWhere to place it: At the end of Section 6.1 (Introduction) or the beginning of Section 6.2 (Spatial & Gendered Embodiment).Purpose: Serves as the overarching conceptual map for the entire chapter. It visually introduces the reader to how macro environmental drivers trickle down through institutional gaps to create bodily harms. Visual Format: A top-down or cyclical Flowchart / System Dynamics Diagram.What it shows:Environmental Trigger: Salinity intrusion & extreme weather events. Institutional Gatekeeping: Elite capture, missing public infrastructure, corrupt tank distribution. Gendered Labor: Long-distance water fetching, carrying heavy kolshis, domestic water rationing. Embodied Health Harms: UTIs, skin lesions, gestational hypertension, miscarriages, compromised MHM. Financial Exhaustion: Out-of-pocket healthcare costs, high-interest micro-credit (samiti) debt traps.

A mind map for planning a two-week trip — flights, hotels, activities, and budget "Figure 1: The Multi-Dimensional Cycle of Climate-Induced Gender VulnerabilityWhere to place it: At the end of Section 6.1 (Introduction) or the beginning of Section 6.2 (Spatial & Gendered Embodiment).Purpose: Serves as the overarching conceptual map for the entire chapter. It visually introduces the reader to how macro environmental drivers trickle down through institutional gaps to create bodily harms. Visual Format: A top-down or cyclical Flowchart / System Dynamics Diagram.What it shows:Environmental Trigger: Salinity intrusion & extreme weather events. Institutional Gatekeeping: Elite capture, missing public infrastructure, corrupt tank distribution. Gendered Labor: Long-distance water fetching, carrying heavy kolshis, domestic water rationing. Embodied Health Harms: UTIs, skin lesions, gestational hypertension, miscarriages, compromised MHM. Financial Exhaustion: Out-of-pocket healthcare costs, high-interest micro-credit (samiti) debt traps.
Focused examples and prompt ideas
Start with the complete visitor wall above, then use these focused collections when you want a narrower subject and more prompt context.
The first curated collection is being prepared.