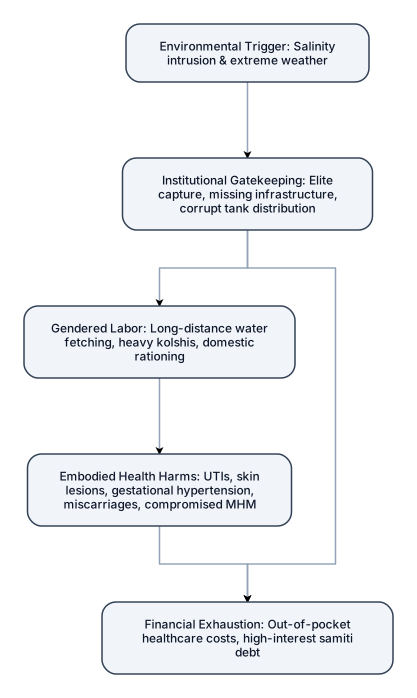
An org chart for a small team with a manager, three engineers, and a designer "Figure 1: The Multi-Dimensional Cycle of Climate-Induced Gender VulnerabilityWhere to place it: At the end of Section 6.1 (Introduction) or the beginning of Section 6.2 (Spatial & Gendered Embodiment).Purpose: Serves as the overarching conceptual map for the entire chapter. It visually introduces the reader to how macro environmental drivers trickle down through institutional gaps to create bodily harms. Visual Format: A top-down or cyclical Flowchart / System Dynamics Diagram.What it shows:Environmental Trigger: Salinity intrusion & extreme weather events. Institutional Gatekeeping: Elite capture, missing public infrastructure, corrupt tank distribution. Gendered Labor: Long-distance water fetching, carrying heavy kolshis, domestic water rationing. Embodied Health Harms: UTIs, skin lesions, gestational hypertension, miscarriages, compromised MHM. Financial Exhaustion: Out-of-pocket healthcare costs, high-interest micro-credit (samiti) debt traps.
Diagram Examples from Real Visitor Prompts
Browse eligible diagrams shared by FreeDiagram visitors, inspect the exact prompts, and build your own version.
Browse 1008 real creationsMain diagram studio
Showing 145–168 of 601. No stock examples or system defaults. Choose a tool, study a real result, then reopen its prompt as your starting point.
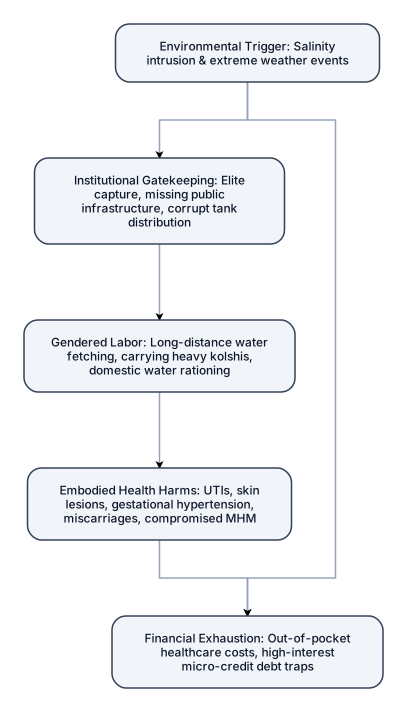
A flowchart for handling a customer refund request, with approve and deny paths :"Figure 1: The Multi-Dimensional Cycle of Climate-Induced Gender VulnerabilityWhere to place it: At the end of Section 6.1 (Introduction) or the beginning of Section 6.2 (Spatial & Gendered Embodiment).Purpose: Serves as the overarching conceptual map for the entire chapter. It visually introduces the reader to how macro environmental drivers trickle down through institutional gaps to create bodily harms. Visual Format: A top-down or cyclical Flowchart / System Dynamics Diagram.What it shows:Environmental Trigger: Salinity intrusion & extreme weather events. Institutional Gatekeeping: Elite capture, missing public infrastructure, corrupt tank distribution. Gendered Labor: Long-distance water fetching, carrying heavy kolshis, domestic water rationing. Embodied Health Harms: UTIs, skin lesions, gestational hypertension, miscarriages, compromised MHM. Financial Exhaustion: Out-of-pocket healthcare costs, high-interest micro-credit (samiti) debt traps.
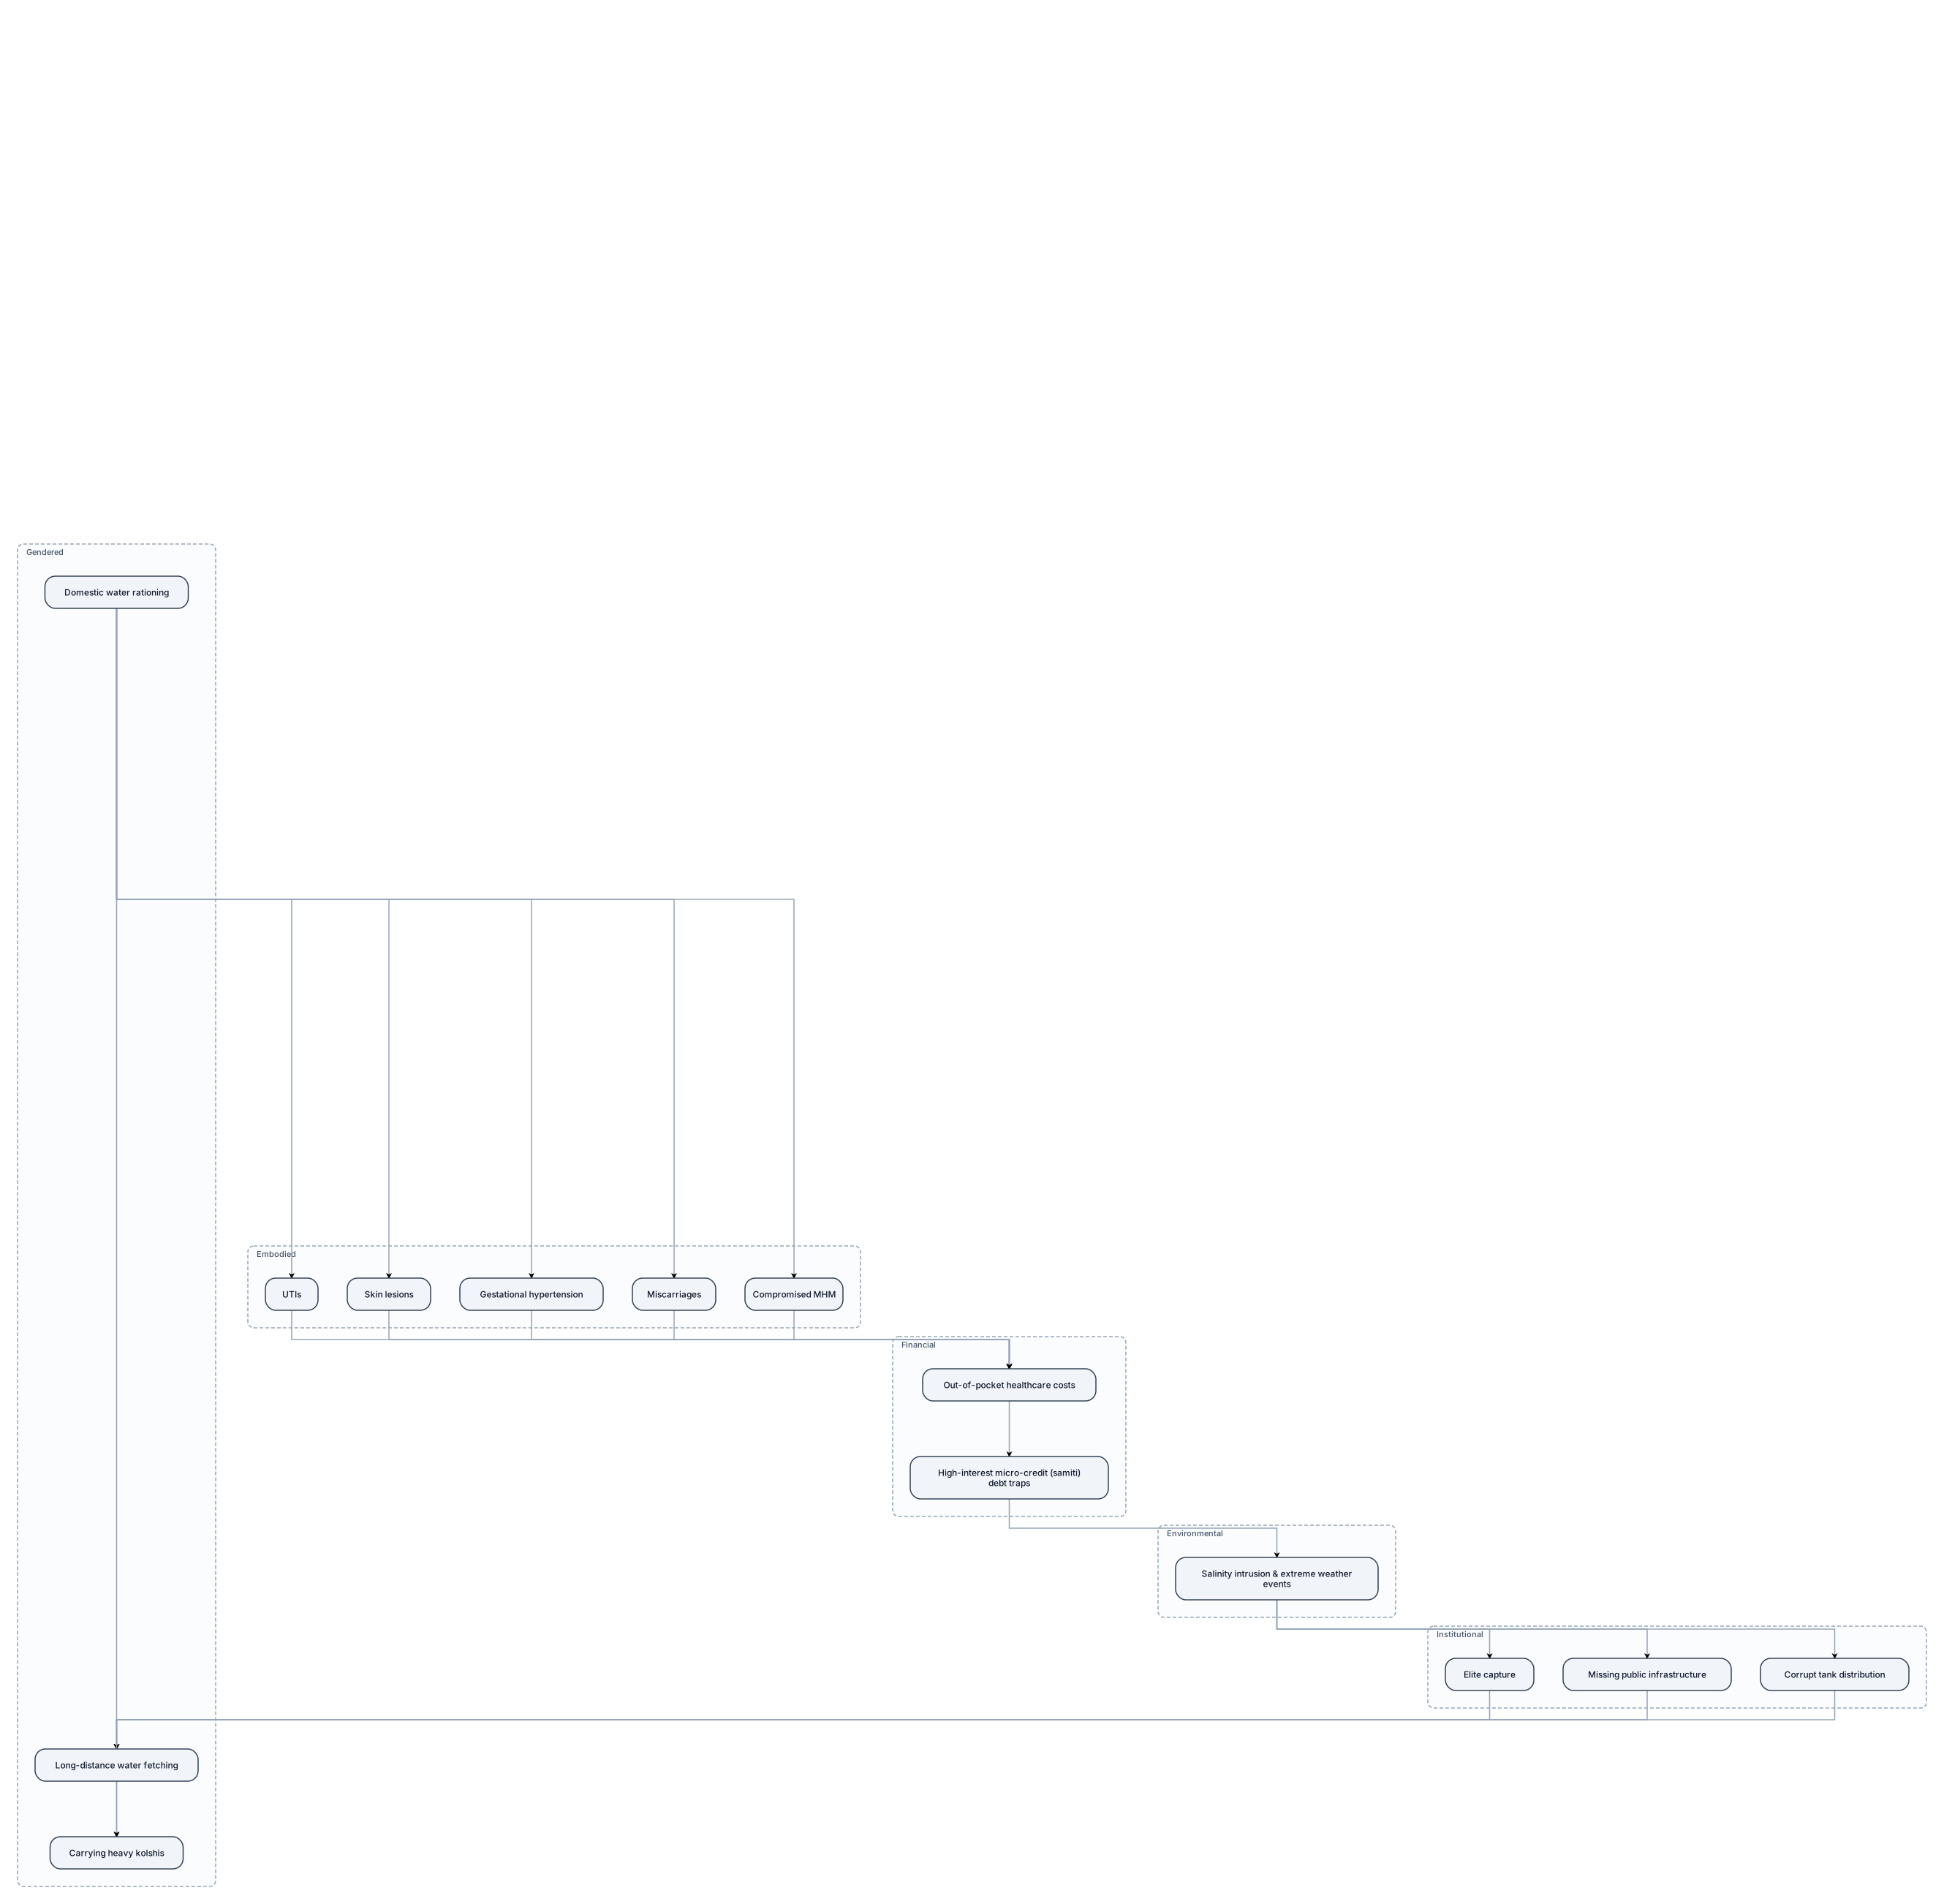
Figure 1: The Multi-Dimensional Cycle of Climate-Induced Gender VulnerabilityWhere to place it: At the end of Section 6.1 (Introduction) or the beginning of Section 6.2 (Spatial & Gendered Embodiment).Purpose: Serves as the overarching conceptual map for the entire chapter. It visually introduces the reader to how macro environmental drivers trickle down through institutional gaps to create bodily harms. Visual Format: A top-down or cyclical Flowchart / System Dynamics Diagram.What it shows:Environmental Trigger: Salinity intrusion & extreme weather events. Institutional Gatekeeping: Elite capture, missing public infrastructure, corrupt tank distribution. Gendered Labor: Long-distance water fetching, carrying heavy kolshis, domestic water rationing. Embodied Health Harms: UTIs, skin lesions, gestational hypertension, miscarriages, compromised MHM. Financial Exhaustion: Out-of-pocket healthcare costs, high-interest micro-credit (samiti) debt traps.
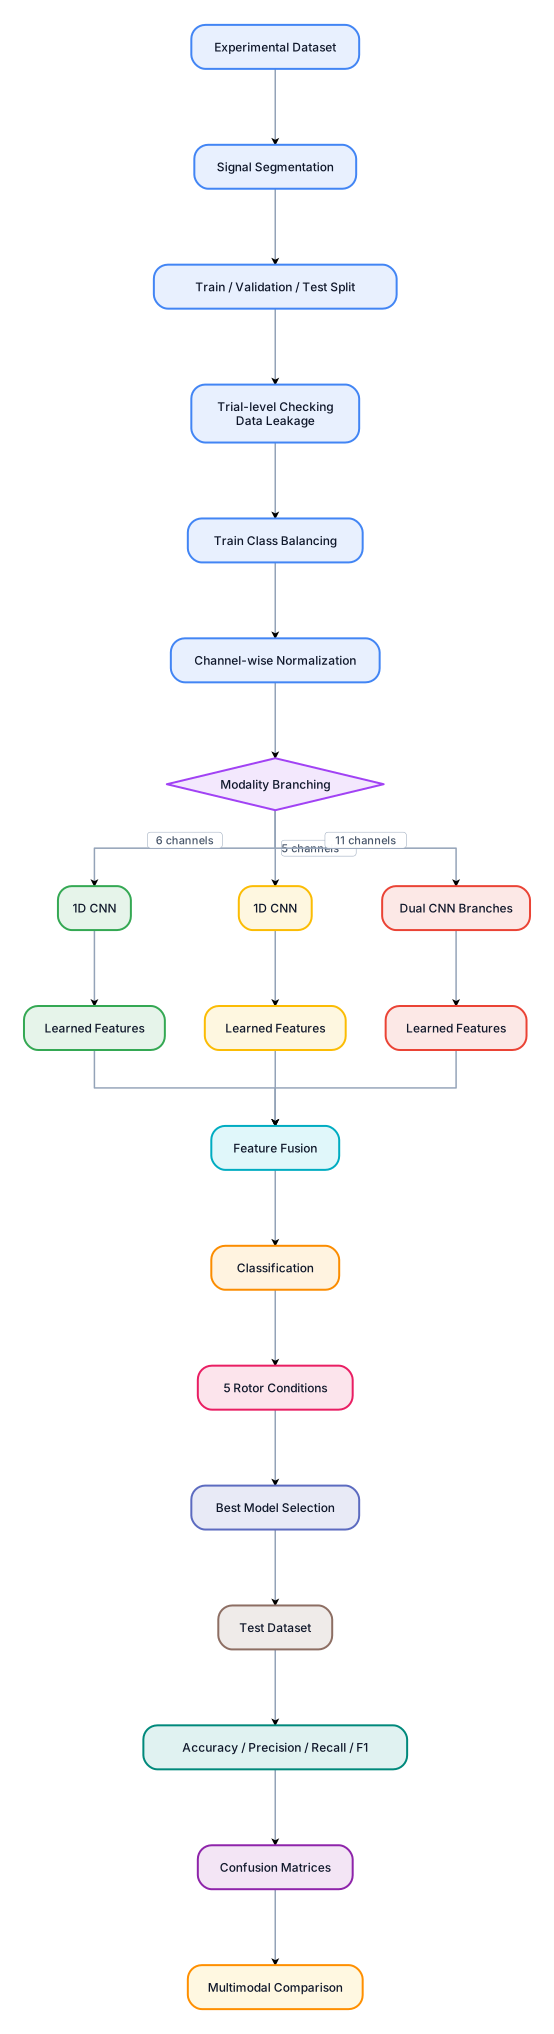
EXPERIMENTAL DATASET │ ↓ Signal Segmentation │ ↓ Train / Validation / Test │ ↓ Trial-level checking (Data leakage) │ ↓ Train Class Balancing │ ↓ Channel-wise Normalization │ ┌───────────┼───────────┐ ↓ ↓ ↓ ELECTRICAL VIBRATION FUSION 6 channels 5 channels 11 channels │ │ │ ↓ ↓ ↓ 1D CNN 1D CNN Dual CNN │ │ branches │ │ │ ↓ ↓ ↓ Learned features Learned features │ │ │ └───────────┼───────────┘ ↓ Classification ↓ 5 Rotor Conditions │ ↓ Best Model Selection │ ↓ TEST DATASET │ ↓ Accuracy / Precision / Recall / F1 │ ↓ Confusion Matrices │ ↓ Multimodal Comparison donne moi uen belle image represntative de cet architecture stp donne la moi en anglais , l'mage est trop petit je veux quelque chose de beau avec desd dessin , pour une revuie ieee
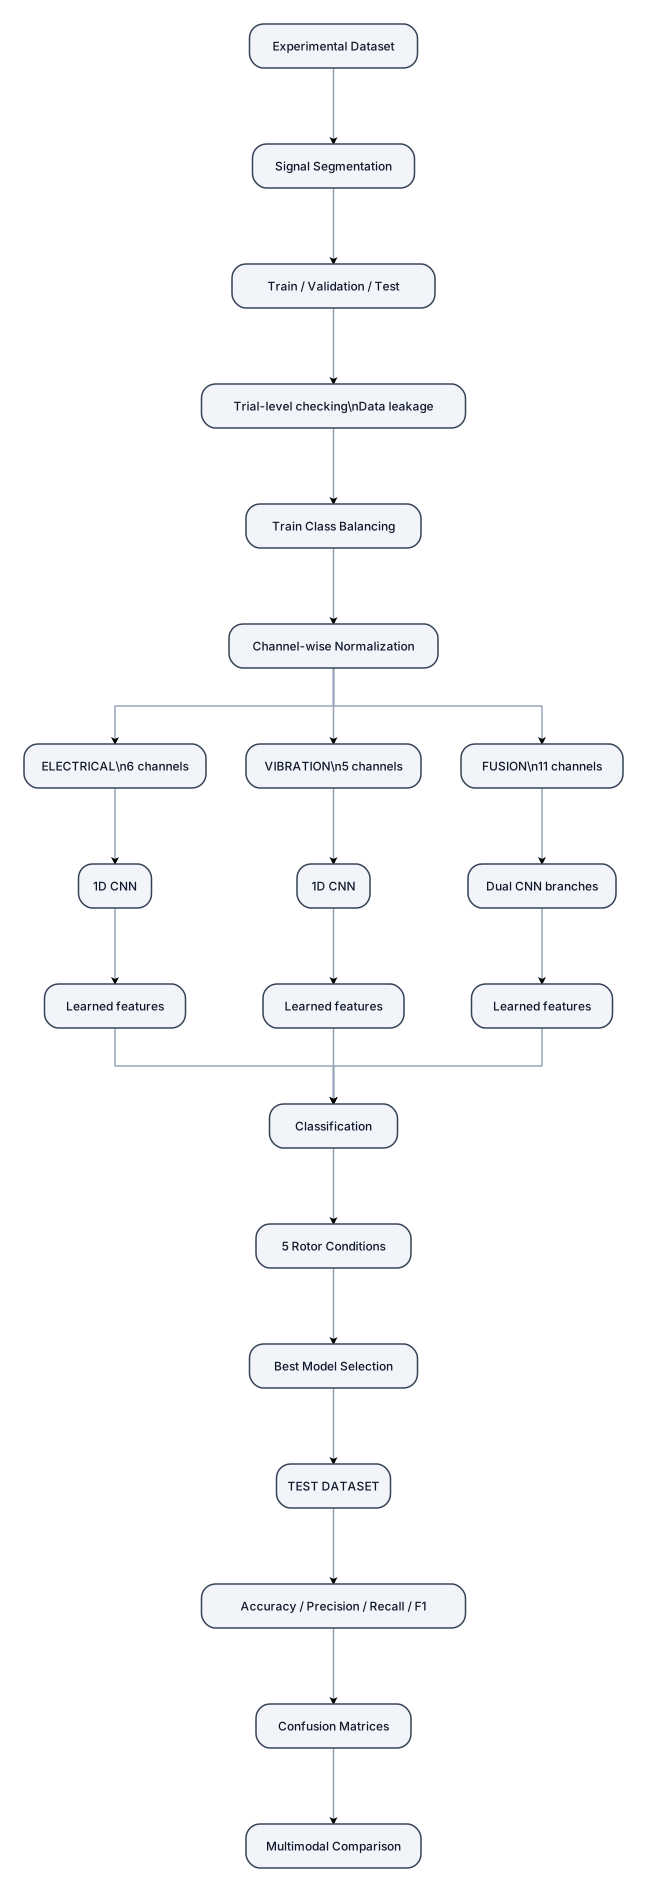
EXPERIMENTAL DATASET │ ↓ Signal Segmentation │ ↓ Train / Validation / Test │ ↓ Trial-level checking (Data leakage) │ ↓ Train Class Balancing │ ↓ Channel-wise Normalization │ ┌───────────┼───────────┐ ↓ ↓ ↓ ELECTRICAL VIBRATION FUSION 6 channels 5 channels 11 channels │ │ │ ↓ ↓ ↓ 1D CNN 1D CNN Dual CNN │ │ branches │ │ │ ↓ ↓ ↓ Learned features Learned features │ │ │ └───────────┼───────────┘ ↓ Classification ↓ 5 Rotor Conditions │ ↓ Best Model Selection │ ↓ TEST DATASET │ ↓ Accuracy / Precision / Recall / F1 │ ↓ Confusion Matrices │ ↓ Multimodal Comparison donne moi uen belle image represntative de cet architecture stp donne la moi en anglais
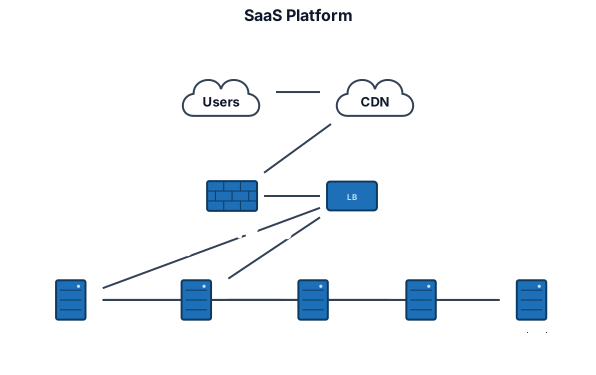
A network diagram for a small SaaS platform with users, CDN, load balancer, two app servers, private database, cache, and monitoring
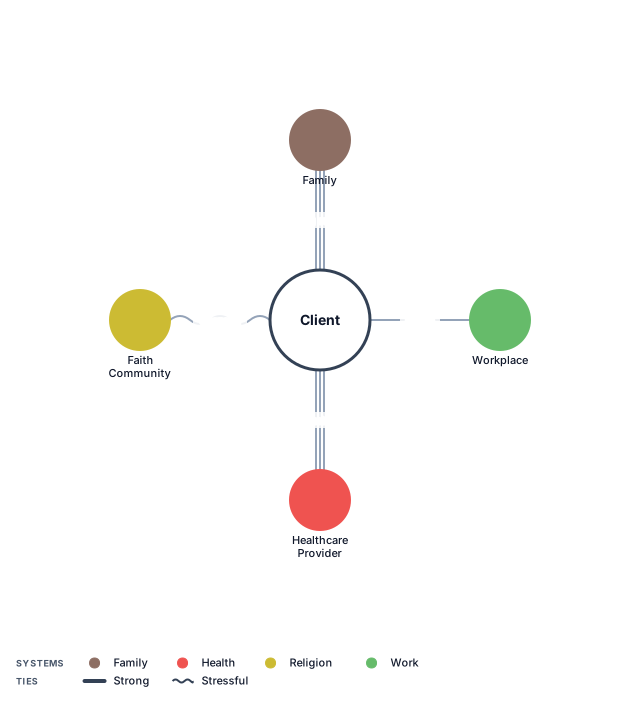
An ecomap of a client's support network: family, work, healthcare, and faith community, with strong and stressful ties
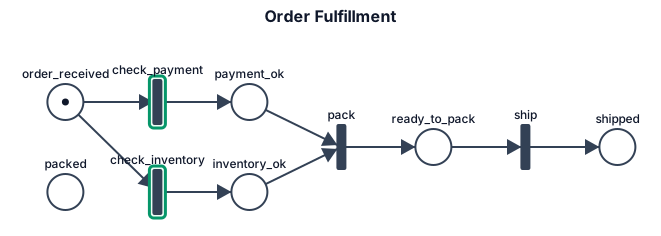
A Petri net for order fulfillment with payment and inventory checks converging before packing and shipment
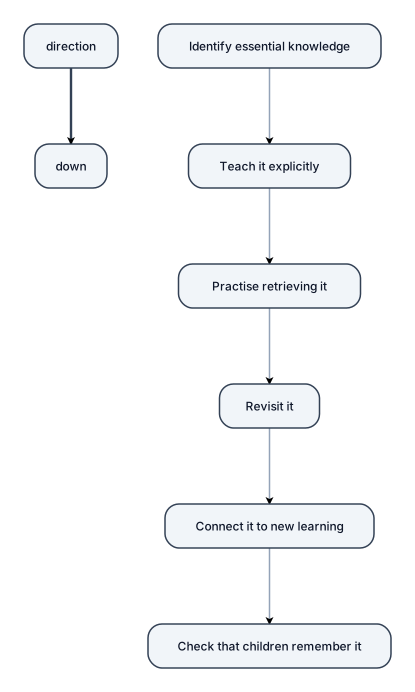
Identify essential knowledge → teach it explicitly → practise retrieving it → revisit it → connect it to new learning → check that children remember it.
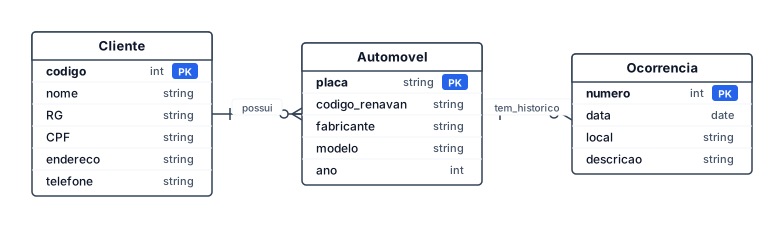
Construir um modelo de entidades e relacionamentos (MER) para uma companhia de seguros de automóveis com um conjunto de clientes, onde cada um possui um certo número de automóveis. Os dados do cliente são código, nome, RG, CPF, endereço e telefone. Do carro deve-se armazenar a placa, código RENAVAN, fabricante, modelo e ano. Associado a cada automóvel há um histórico de ocorrências. Cada ocorrência deve ter um número (único), data, local e descrição.
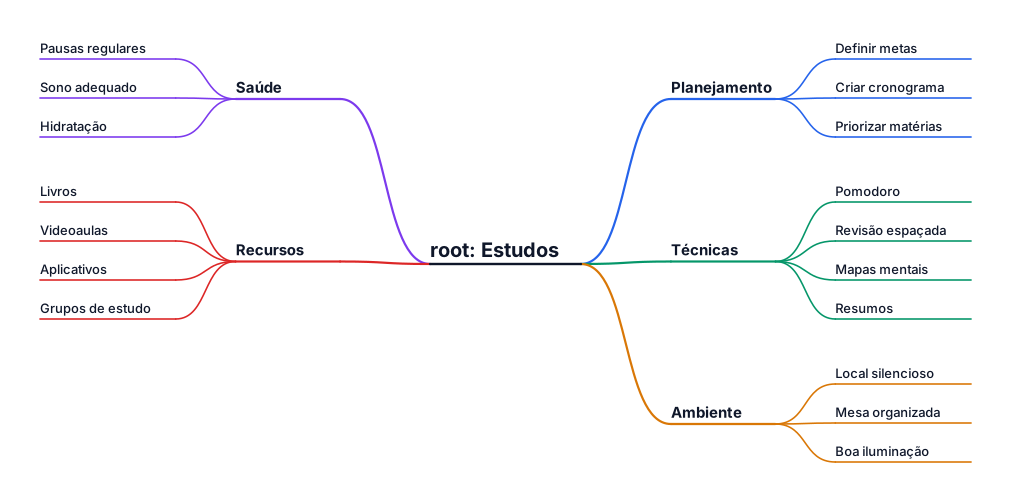
estudos
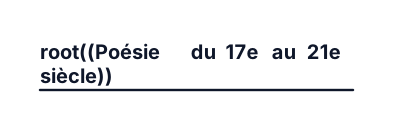
fais moi une carte mentales de niveau premiere en francais sur le theme de la poesie du 17e au 21e siecle mais remplis la
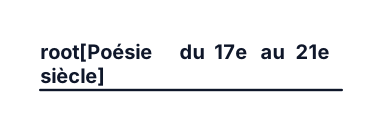
fais moi une carte mentales de niveau premiere en francais sur le theme de la poesie du 17e au 21e siecle
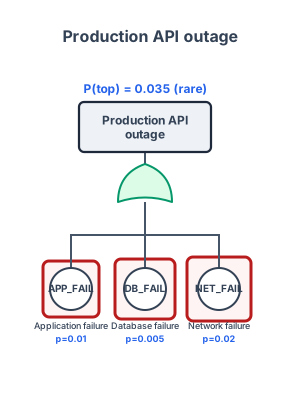
A fault tree for a production API outage caused by application failure, database failure, or network failure
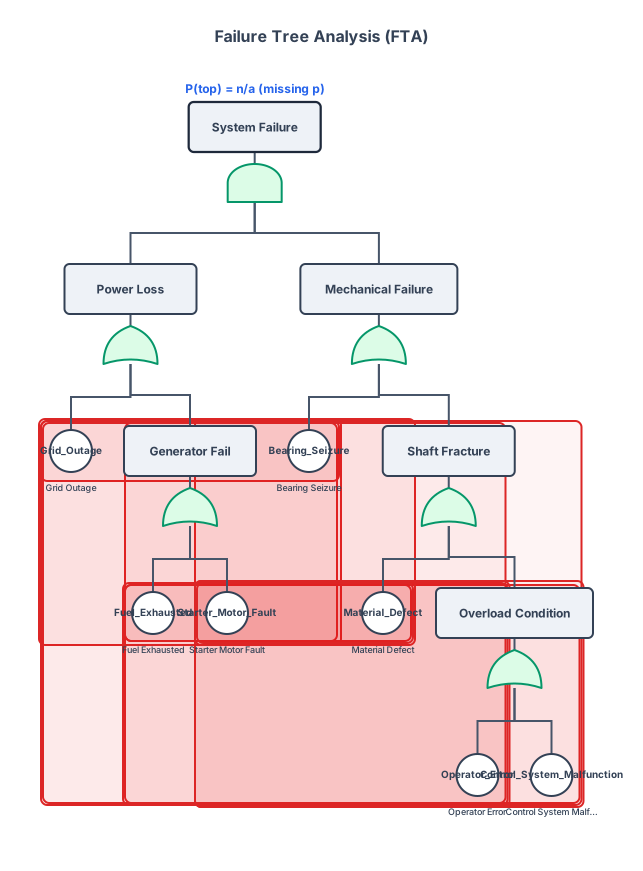
fta FAILURE TREE ANALYSIS
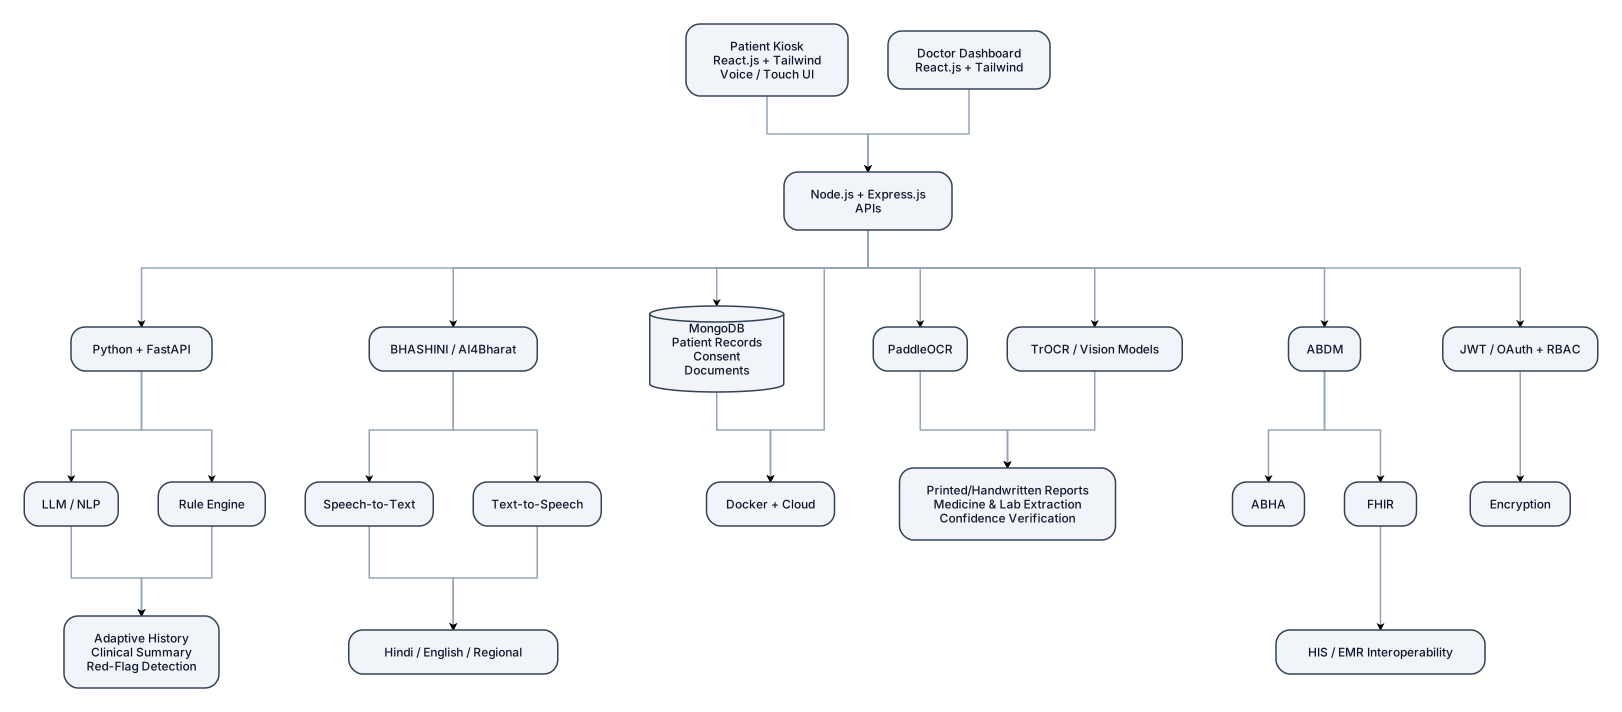
TECH STACK — MediKiosk 🎨 Frontend React.js + Tailwind CSS → Patient Kiosk • Voice/Touch UI • Doctor Dashboard ⚙️ Application Backend Node.js + Express.js + MongoDB → APIs • Patient Records • Consent • Document Management 🤖 AI & Clinical Intelligence Python + FastAPI + LLM/NLP + Rule Engine → Adaptive History • Clinical Summary • Red-Flag Detection 🎙️ Voice & Multilingual AI BHASHINI / AI4Bharat → Speech-to-Text • Text-to-Speech • Hindi/English/Regional Languages 📄 Document Intelligence PaddleOCR + TrOCR/Vision Models → Printed/Handwritten Reports • Medicine & Lab Extraction • Confidence Verification 🏥 Healthcare Integration ABDM + ABHA + FHIR → Consent • Health Records • HIS/EMR Interoperability 🔐 Security & Deployment JWT/OAuth + RBAC + Encryption + Docker + Cloud → Secure Access • Data Protection • Scalable Deployment Make a flow chart

i want a timeline arrow that goes in a zigzag. starts on the left, then moves towards the right, then down and then left, then down and then right... etc
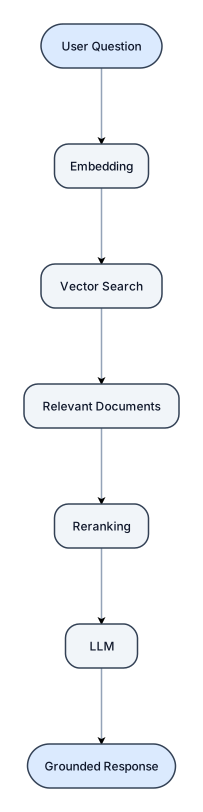
A flowchart of a new-user onboarding flow from signup to first activation, with a verification branchCreate a clean, professional vertical flowchart with a white background: User Question ↓ Embedding ↓ Vector Search ↓ Relevant Documents ↓ Reranking ↓ LLM ↓ Grounded Response Use rounded rectangles, downward arrows, consistent spacing, minimal colors, and a modern business infographic style.
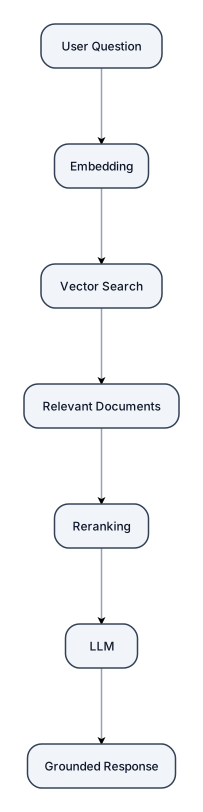
User Question ↓ Embedding ↓ Vector Search ↓ Relevant Documents ↓ Reranking ↓ LLM ↓ Grounded Response
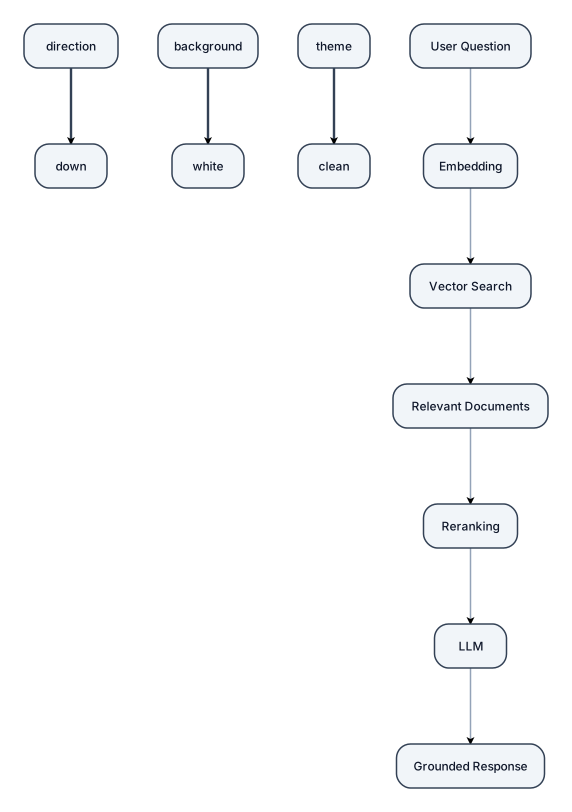
Create a clean, professional vertical flowchart with a white background: User Question ↓ Embedding ↓ Vector Search ↓ Relevant Documents ↓ Reranking ↓ LLM ↓ Grounded Response
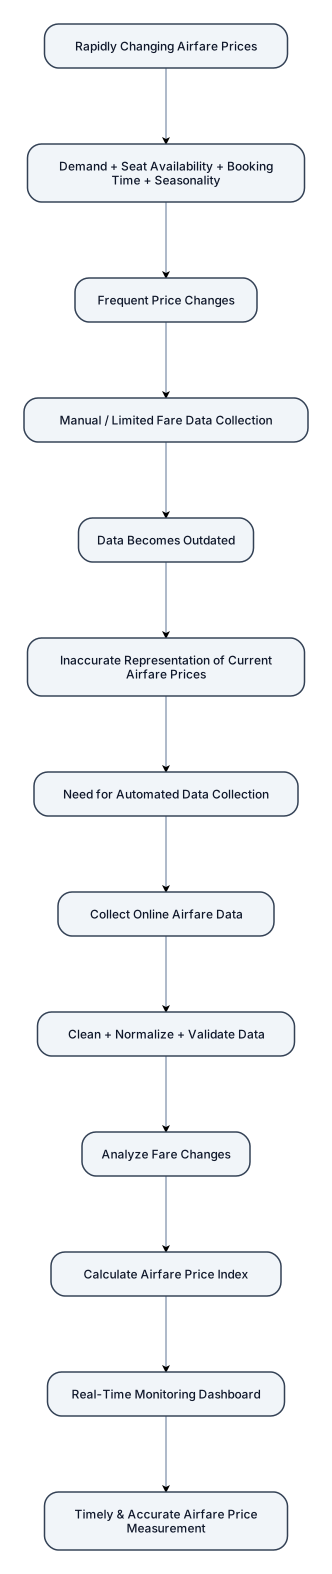
Generate ONE SINGLE FLOWCHART DIAGRAM ONLY. DO NOT create a presentation. DO NOT create slides. DO NOT create a PPT. DO NOT create multiple diagrams. TITLE: SIH26056 – Real-Time Airfare Price Index for India Use rectangular boxes connected by arrows in this exact sequence: [Rapidly Changing Airfare Prices] ↓ [Demand + Seat Availability + Booking Time + Seasonality] ↓ [Frequent Price Changes] ↓ [Manual / Limited Fare Data Collection] ↓ [Data Becomes Outdated] ↓ [Inaccurate Representation of Current Airfare Prices] ↓ [Need for Automated Data Collection] ↓ [Collect Online Airfare Data] ↓ [Clean + Normalize + Validate Data] ↓ [Analyze Fare Changes] ↓ [Calculate Airfare Price Index] ↓ [Real-Time Monitoring Dashboard] ↓ [Timely & Accurate Airfare Price Measurement] Use ONLY boxes and arrows. Keep text short. Make it a vertical top-to-bottom flowchart. One page, one diagram.
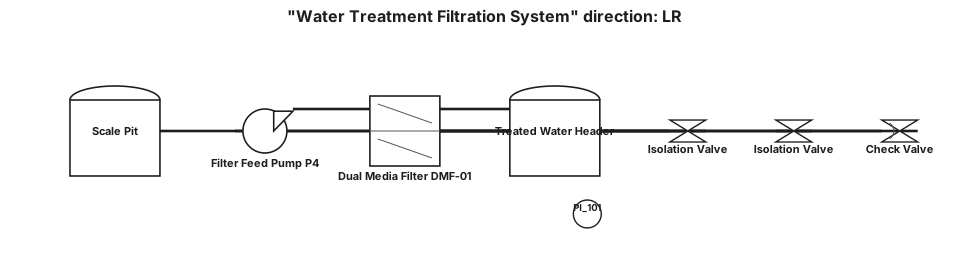
P&ID of a water treatment filtration system. Process flow from left to right: Scale Pit → Filter Feed Pump P4 → Dual Media Filter DMF-01 → Treated Water Header. Use standard P&ID symbols for: - one water tank labeled Scale Pit - one centrifugal pump labeled P4 - one filter vessel labeled DMF-01 - connecting process pipelines - flow direction arrows - isolation valves before and after the pump - a check valve on the pump discharge - pressure gauge on pump discharge Do not add any other equipment.
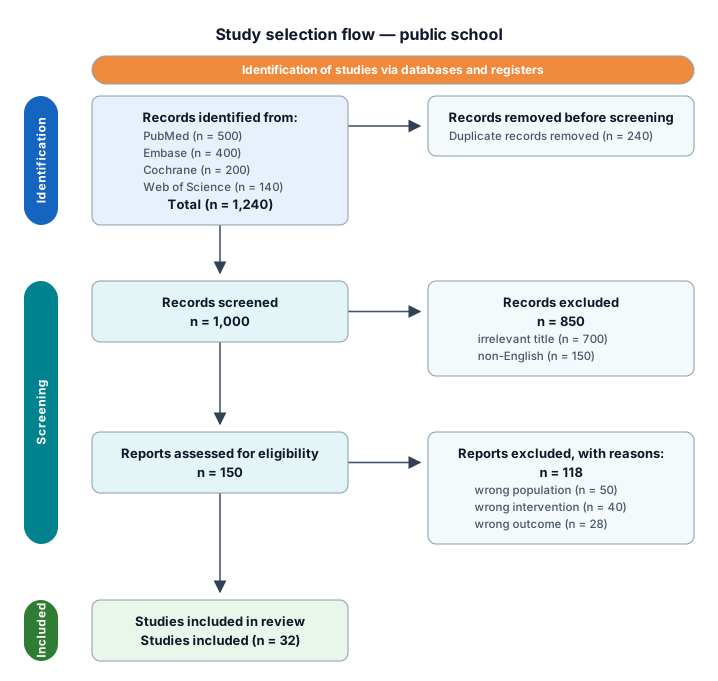
A PRISMA study-selection flow from 1,240 identified records through deduplication, screening, eligibility, and 32 included studies una escuela publica
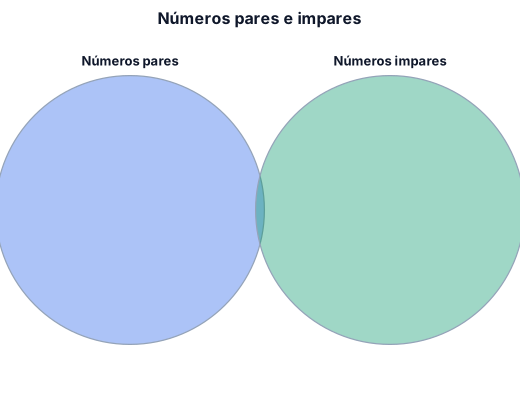
diagrama de venn de numeros pares junto a numeros impares
Focused examples and prompt ideas
Start with the complete visitor wall above, then use these focused collections when you want a narrower subject and more prompt context.
The first curated collection is being prepared.