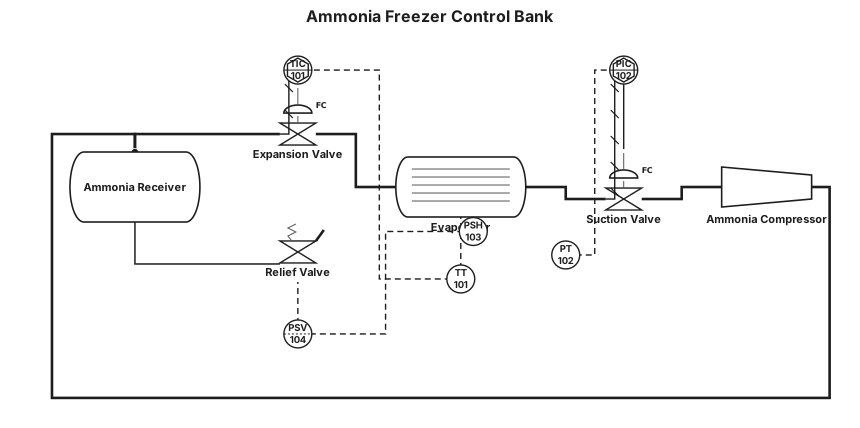
A P&ID for a ammonia freezer control bank
NODE ARCHIVE · REAL DIAGRAM BRIEFS
Diagram Examples from Real Visitor Prompts
Browse eligible diagrams shared by FreeDiagram visitors, inspect the exact prompts, and build your own version.
Browse 3312 real creationsCOMMUNITY OUTPUTS · EXACT PROMPTS
All visitor creations
Showing 2113–2136 of 3312. No stock examples or system defaults. Choose a tool, study a real result, then reopen its prompt as your starting point.
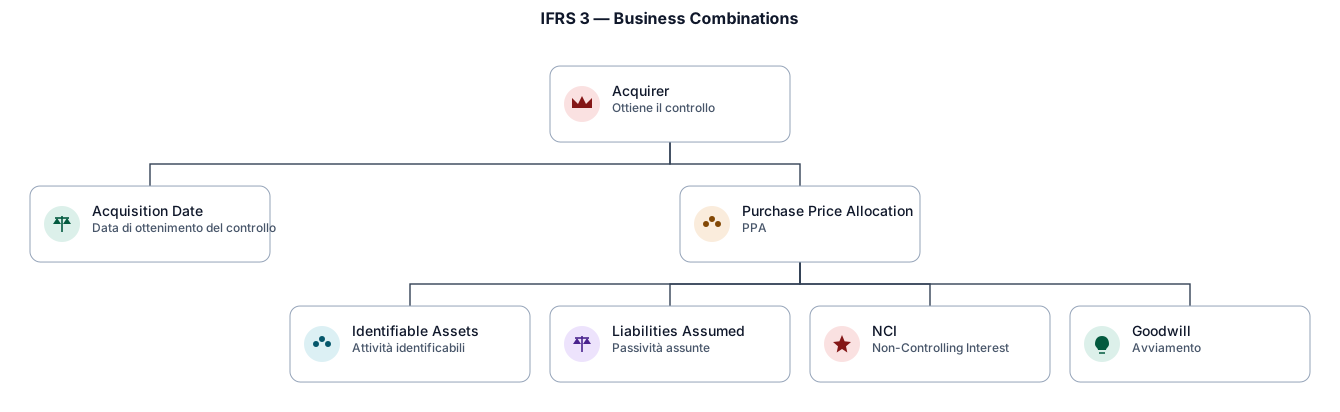
IDENTIFY THE ACQUIRER — Chi ottiene il controllo? DETERMINE THE ACQUISITION DATE — Quando viene ottenuto il controllo? RECOGNISE & MEASURE Purchase Price Allocation (PPA) Identifiable assets Liabilities assumed NCI Goodwill
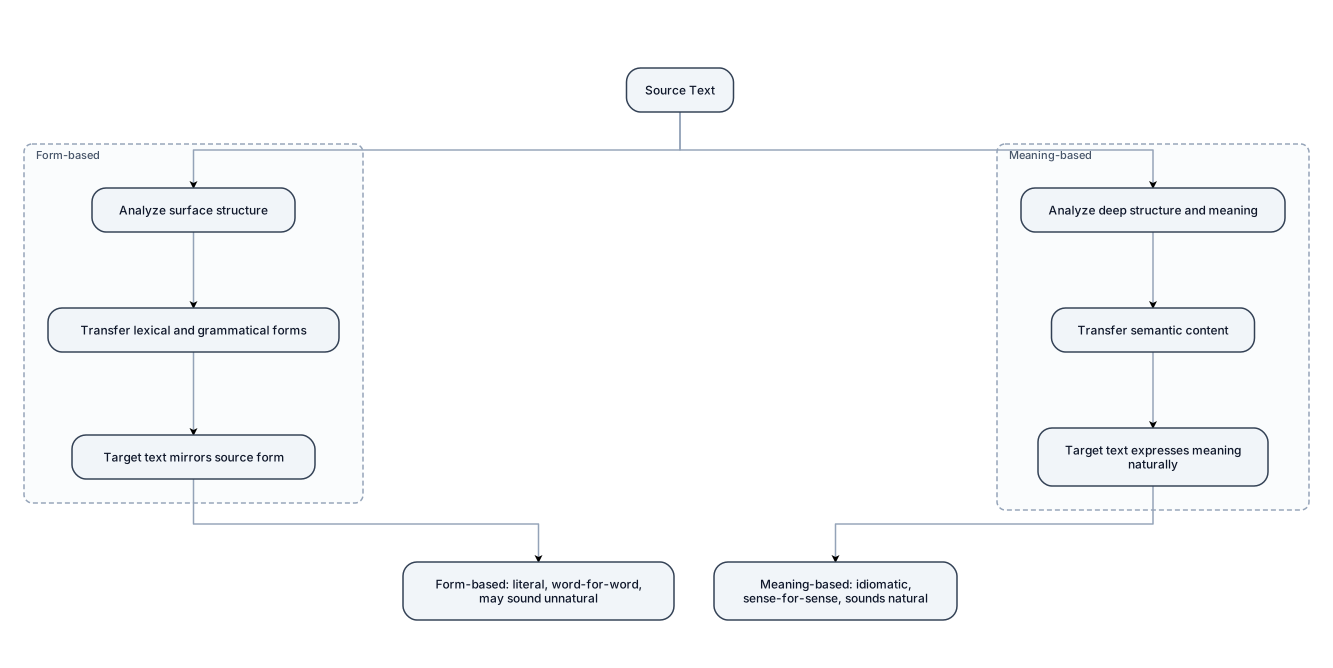
Lesson 2 Learning Task Diagram of Form-based and Meaning-based Translation Process Instructions: Create a diagram showing the process of translation that situates the Form-based and Meaning-based translation. Include a short description that emphasizes the difference between the two kinds of translation.
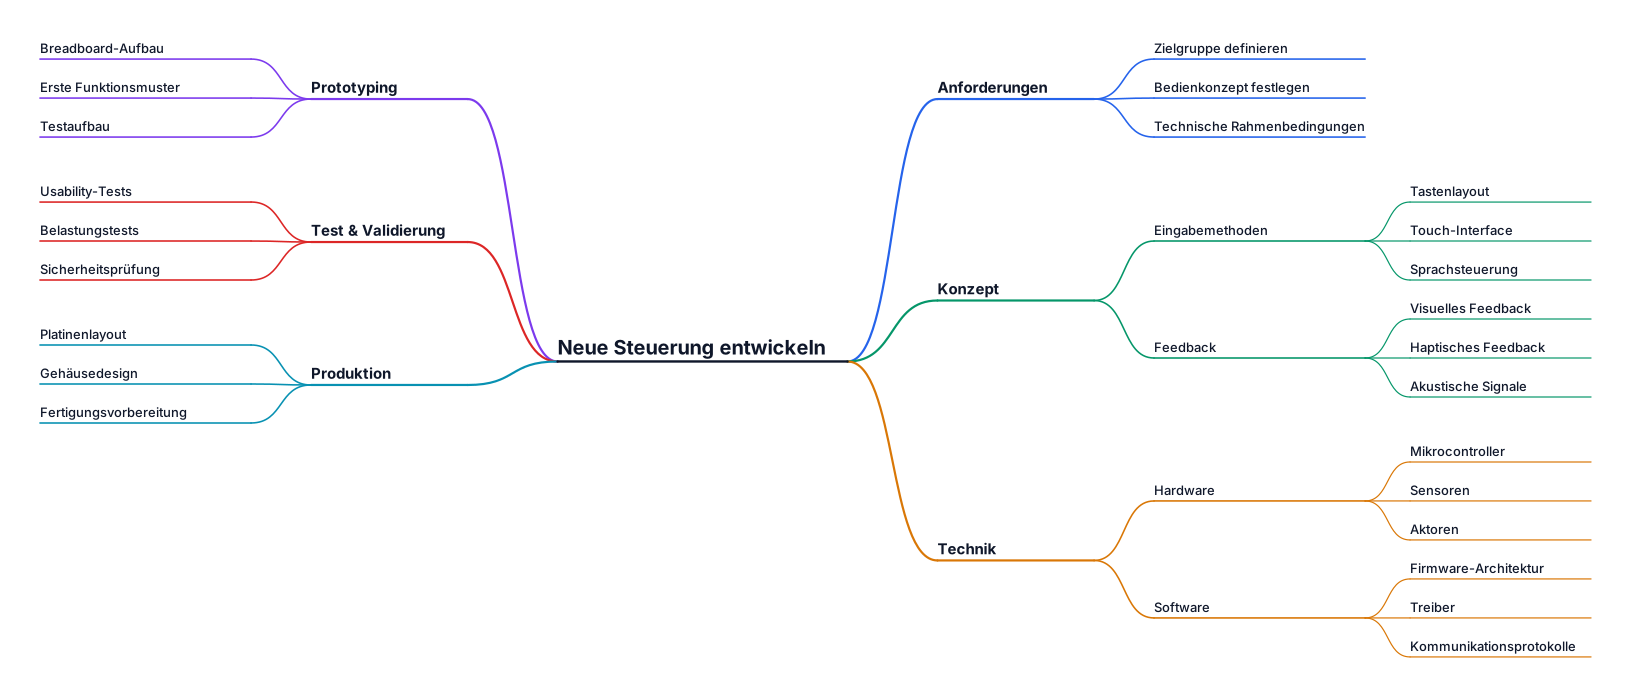
Kannst du eine neue Steuerung entwickeln?
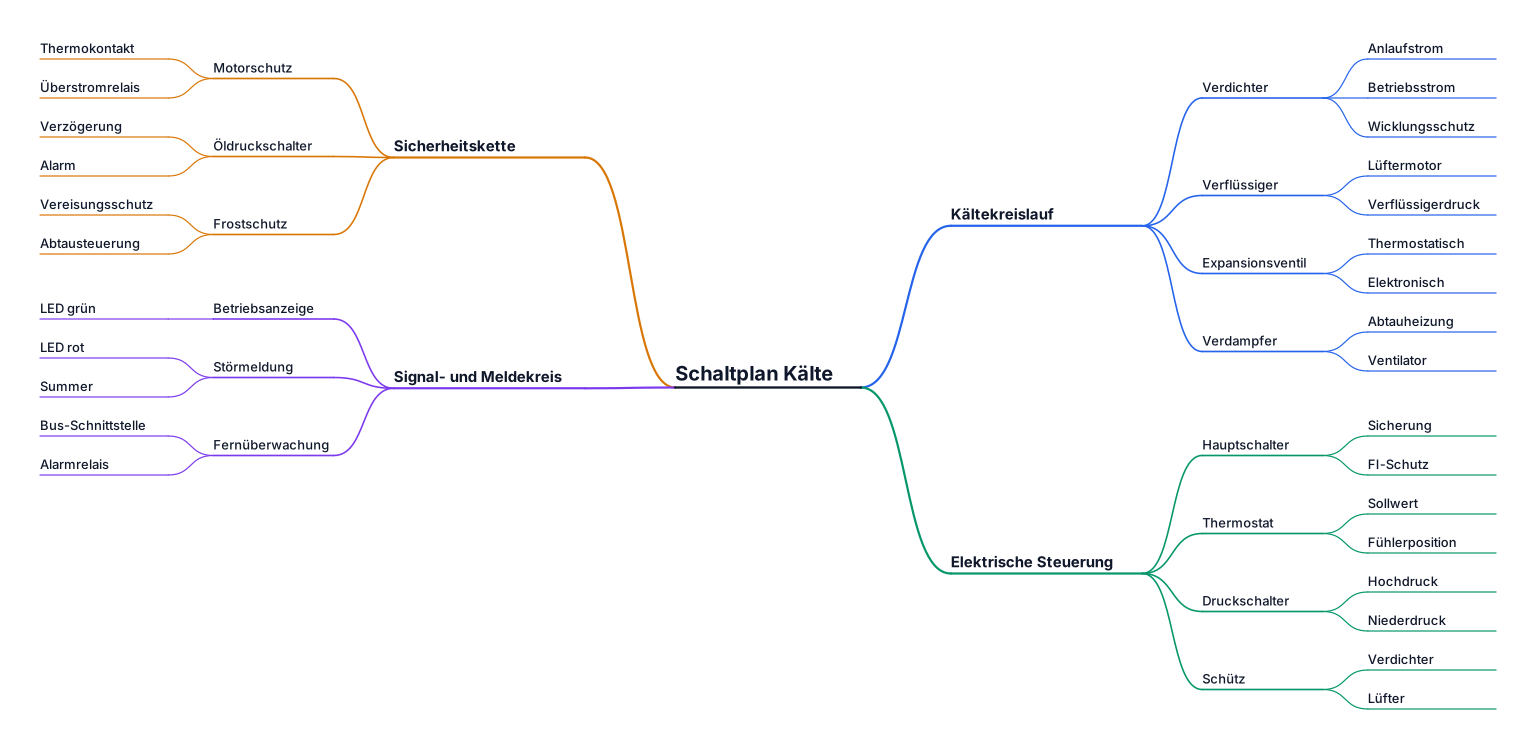
Schaltplan, Kälte
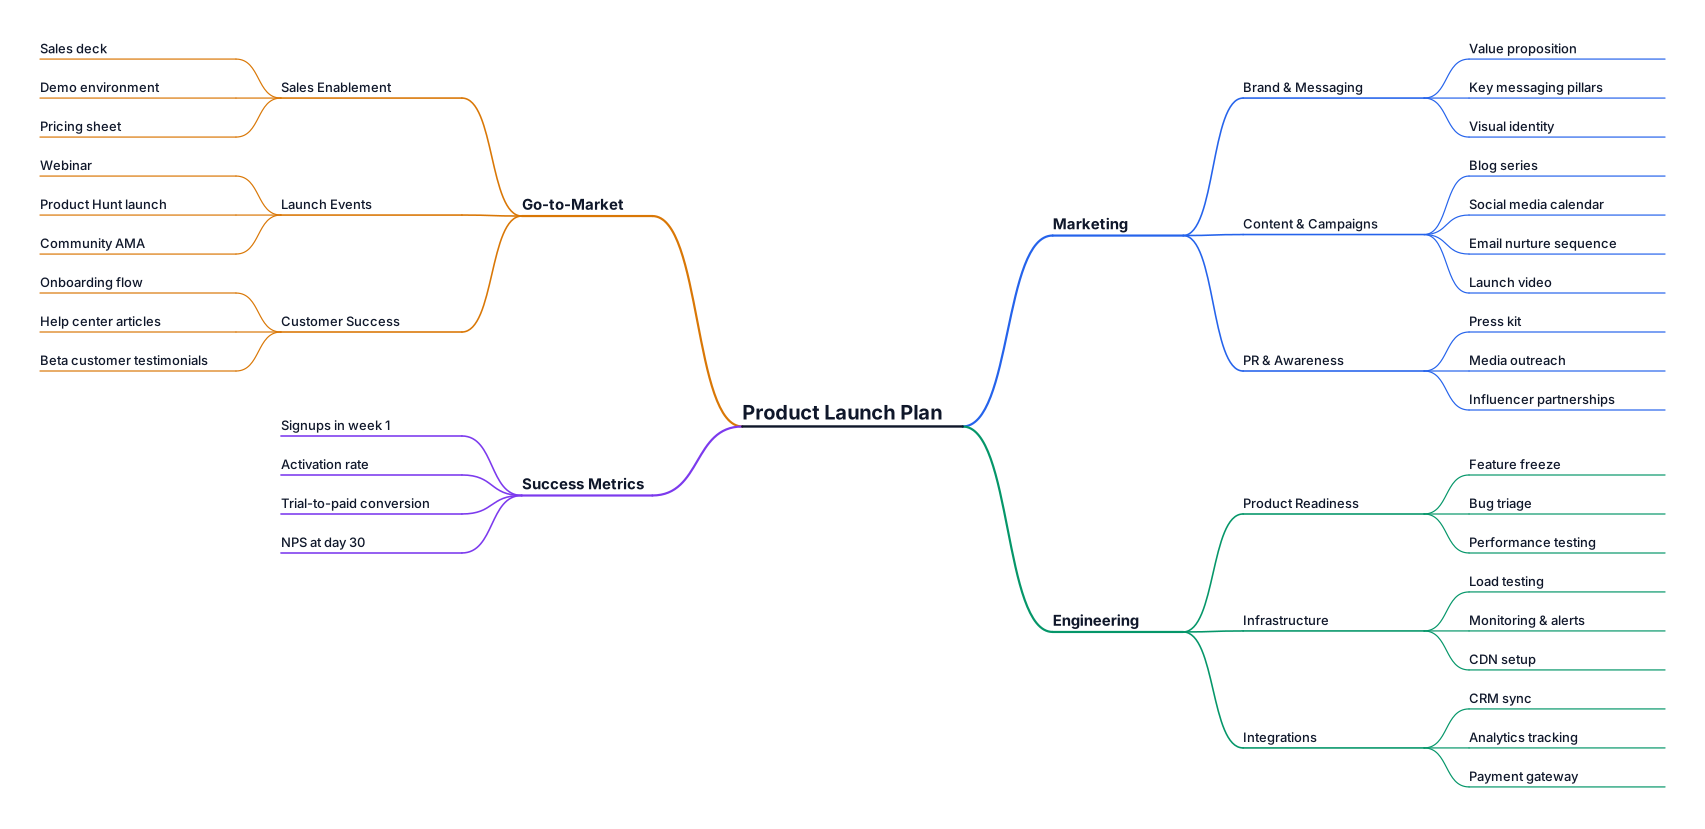
A mind map for planning a product launch, covering marketing, engineering, and go-to-market

Parasitic infections can be transmitted through: Oral transmission Skin transmission Vector transmission Direct transmission Vertical transmission Iatrogenic transmission
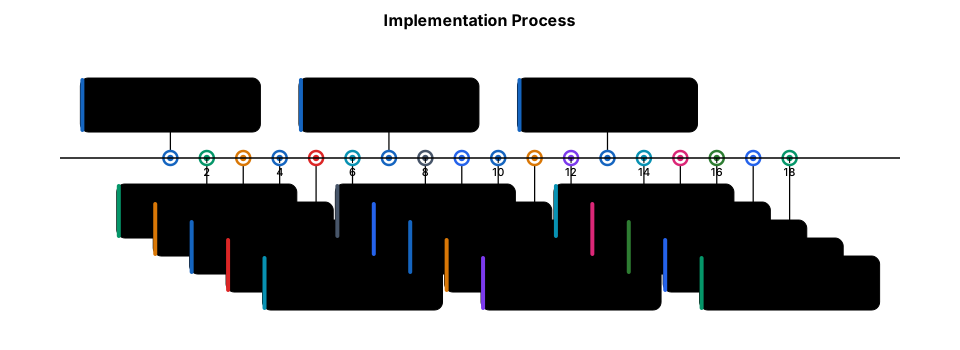
Implementation Process From Patient Intake to Doctor-Ready Case 1. Patient Intake • Select Language • Start via Voice / Touch 2. Clinical History • Guided Questions • AYUSH Information 3. Document Processing • Upload Medical Files • OCR & Information Extraction 4. AI Intelligence • Analyze & Structure Information • Detect Red Flags 5. Structured Patient Case • Complete Case Summary • Medical History + Alerts 6. Physician Review • View in Doctor Dashboard • Verify & Consult
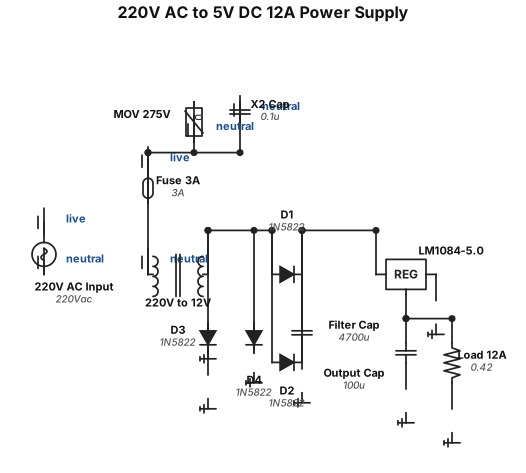
Muje ek circuit banao 5v dc out out 12ampr input 220v ac too 300v kon si ic use howa hai
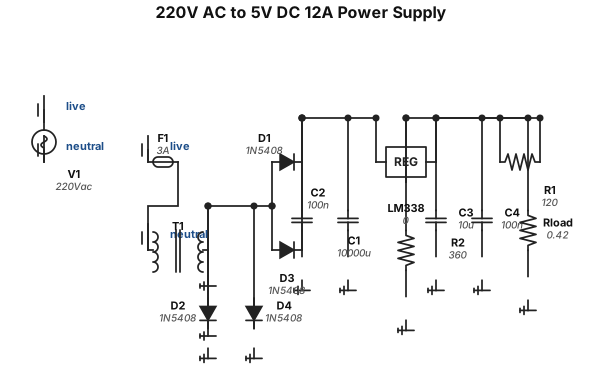
Muje ek circuit banao 5v dc out out 12ampr input 220v ac too 300v
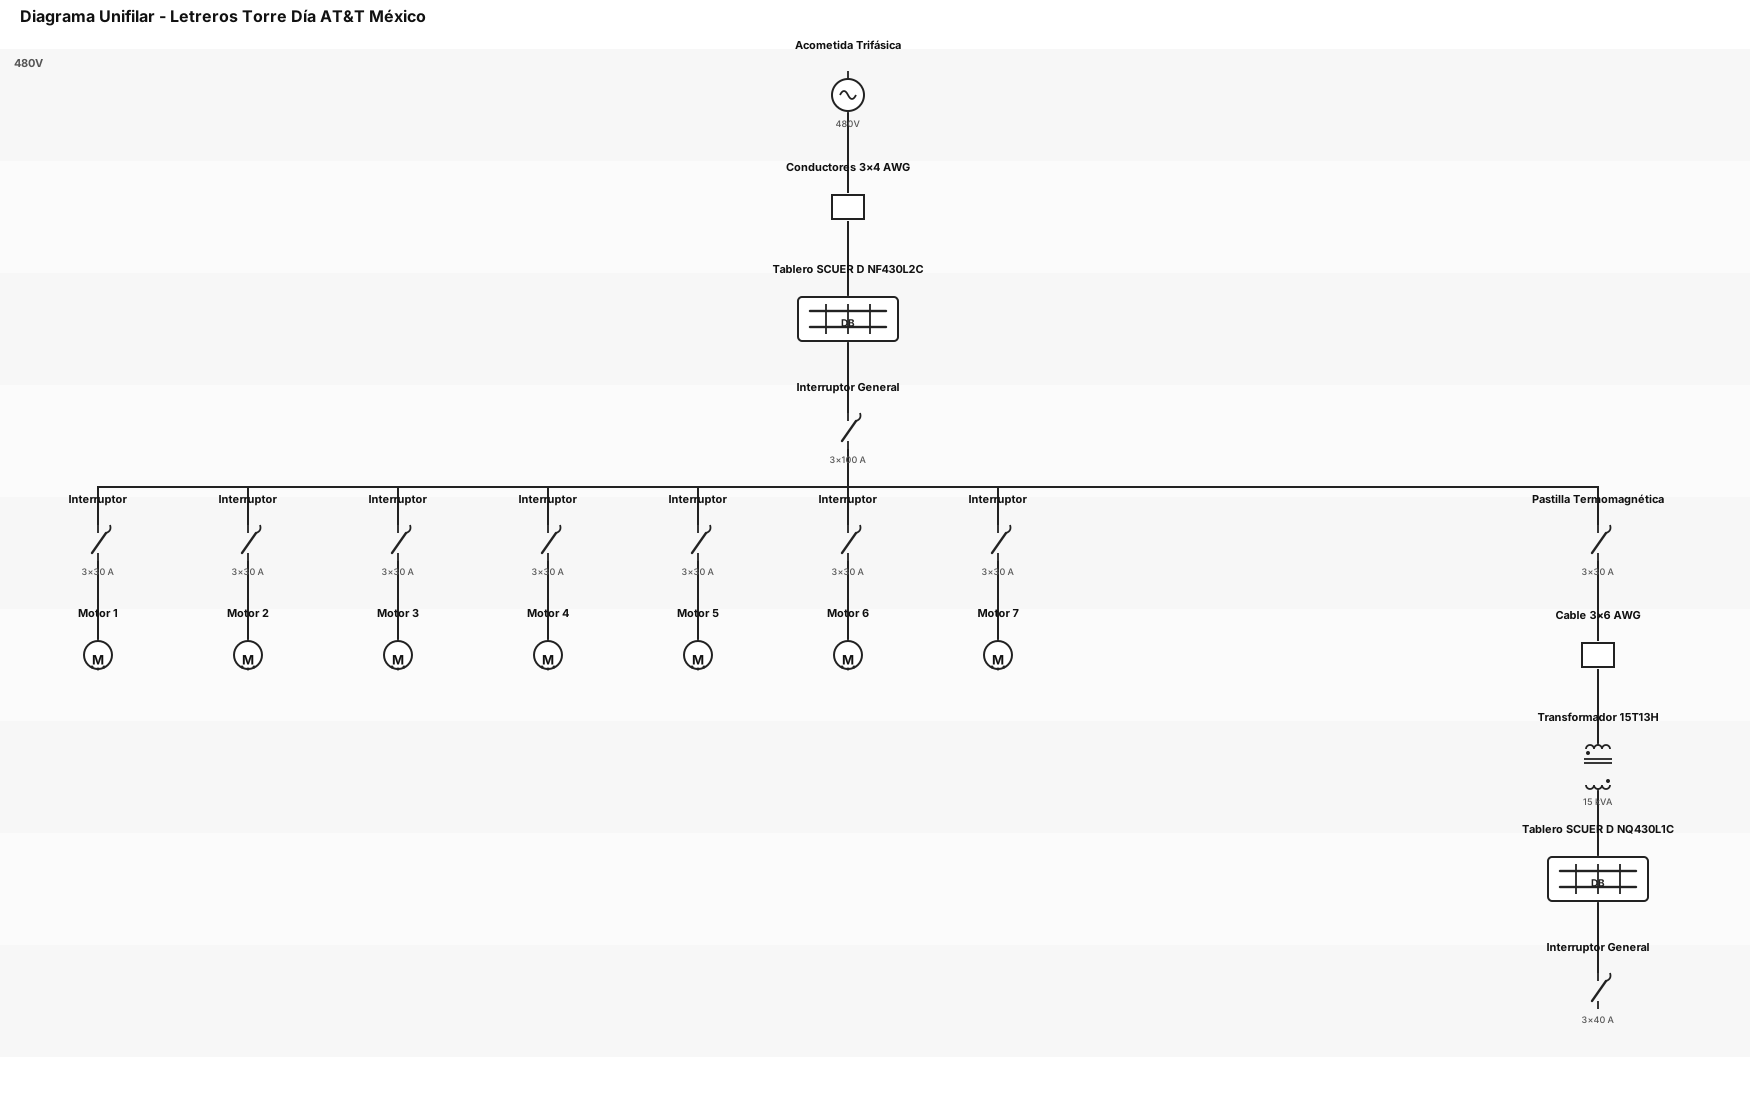
DIAGRAMA UNIFILAR DE LOS LETREROS DEL DE TORRE DIA AT&T MEXICO: SE ALIMENTA CON UN SISTEMA TRIFASICO A 480V CON UN CONDUCTOS DE 3X4AWG, ALIMENTA UN TABLERO DE DISTRIBUCION SCUER D MODELO NF430L2C. CON UN INTERRUPTOR GENERAL DE 3X100 A, CON 8 CIRCUTOS 7 DE ELLOS ALIMENTA MOTORES CON INTERRUPTORES DE 3X30A Y UNO ALIMENTA UN TRASFORMADOR MODELO 15T13H DE UNA CAPACIDAD DE 15KVA, CON UNA PASTILLA TERMOMAGNETICA DE 30AMPERES CON CABLE 3X6AWG, EL SECUNDARIO DEL TRASFORMADOR ALIMENTA UN TABLARO DE DISTRIBUCION SCUER D MODELO NQ430L 1C, CON INTERRUPTOR GENERAL DE 3X40AMPERES
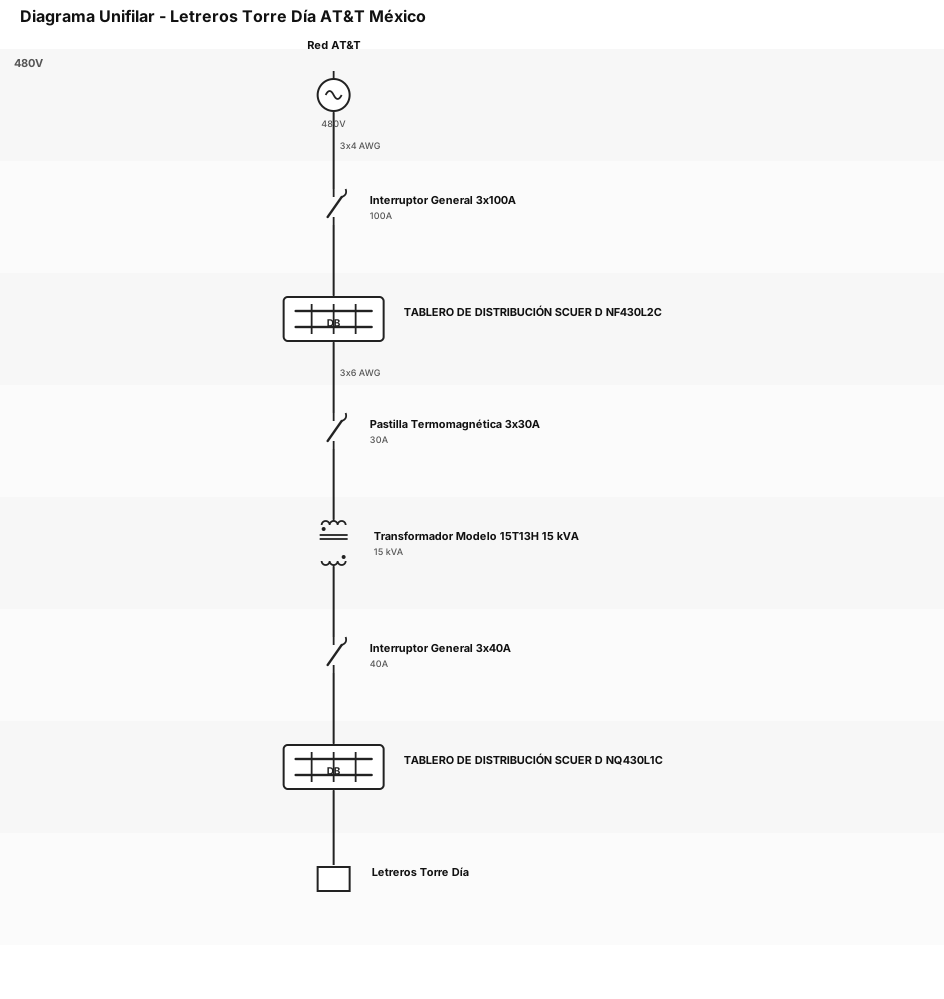
DIAGRAMA UNIFILAR DE LOS LETREROS DEL DE TORRE DIA AT&T MEXICO: SE ALIMENTA CON UN SISTEMA TRIFASICO A 480V CON UN CONDUCTOS DE 3X4AWG, ALIMENTA UN TABLERO DE DISTRIBUCION SCUER D MODELO NF430L2C. CON UN INTERRUPTOR GENERAL DE 3X100 A Y DE AHI SE ALIMENTA UN TRASFORMADOR MODELO 15T13H DE UNA CAPACIDAD DE 15KVA, CON UNA PASTILLA TERMOMAGNETICA DE 30AMPERES CON CABLE 3X6AWG, EL SECUNDARIO DEL TRASFORMADOR ALIMENTA UN TABLARO DE DISTRIBUCION SCUER D MODELO NQ430L 1C, CON INTERRUPTOR GENERAL DE 3X40AMPERES
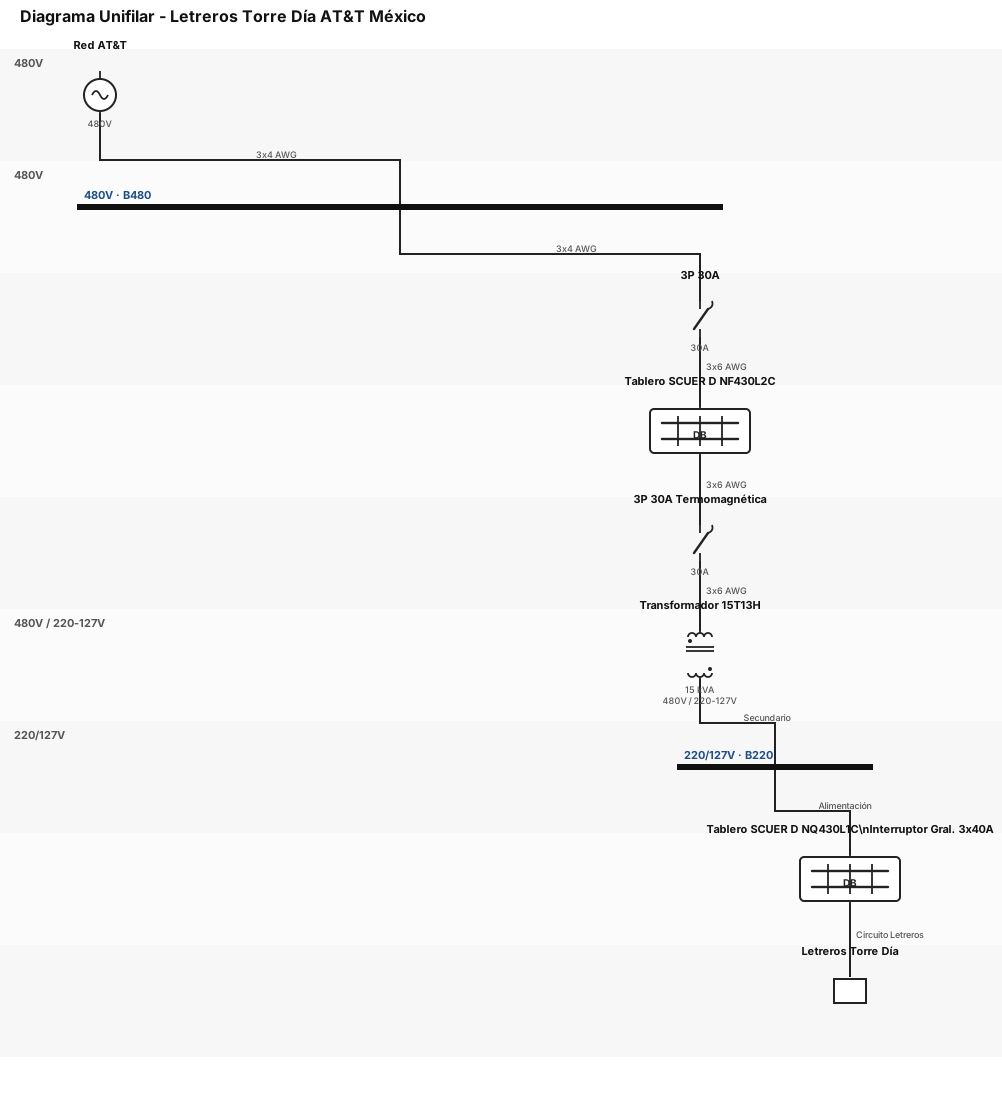
DIAGRAMA UNIFILAR DE LOS LETREROS DEL DE TORRE DIA AT&T MEXICO: SE ALIMENTA CON UN SISTEMA TRIFASICO A 480V CON UN CONDUCTOS DE 3X4AWG, ALIMENTA UN TABLERO DE DISTRIBUCION SCUER D MODELO NF430L2C. DE AHI SE ALIMENTA UN TRASFORMADOR MODELO 15T13H DE UNA CAPACIDAD DE 15KVA, CON UNA PASTILLA TERMOMAGNETICA DE 30AMPERES CON CABLE 3X6AWG, EL SECUNDARIO DEL TRASFORMADOR ALIMENTA UN TABLARO DE DISTRIBUCION SCUER D MODELO NQ430L 1C, CON INTERRUPTOR GENERAL DE 3X40AMPERES
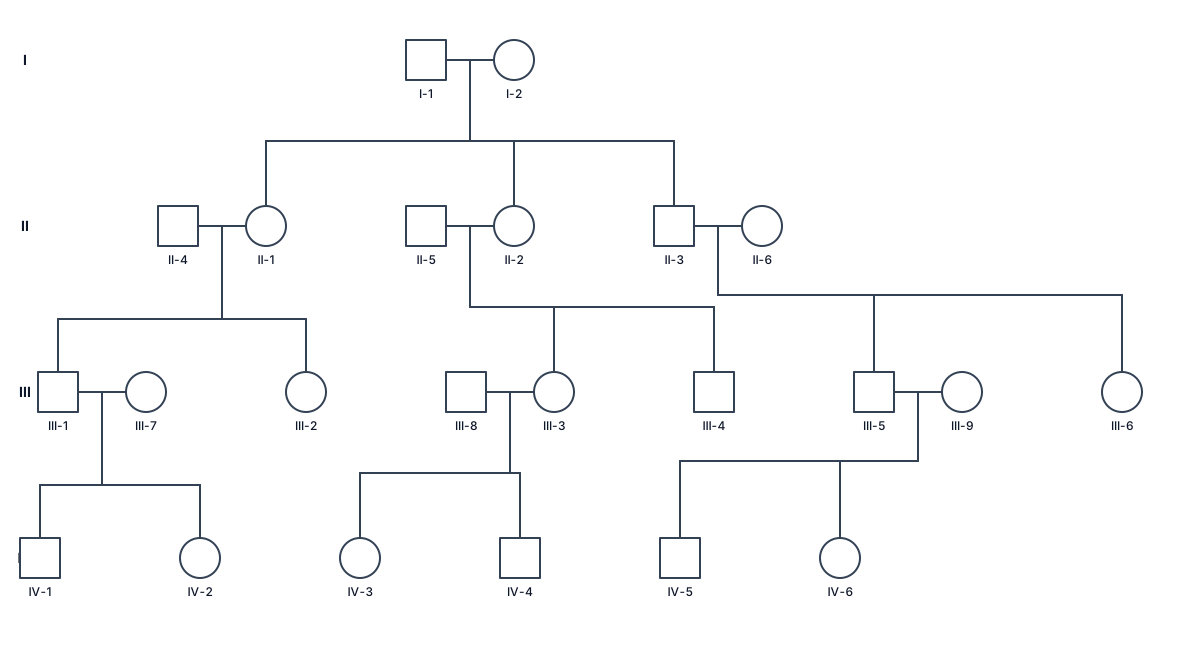
A 4 generation chart, the 1st couple has two daughters, each married, with a 3rd couple in the 2nd generation.
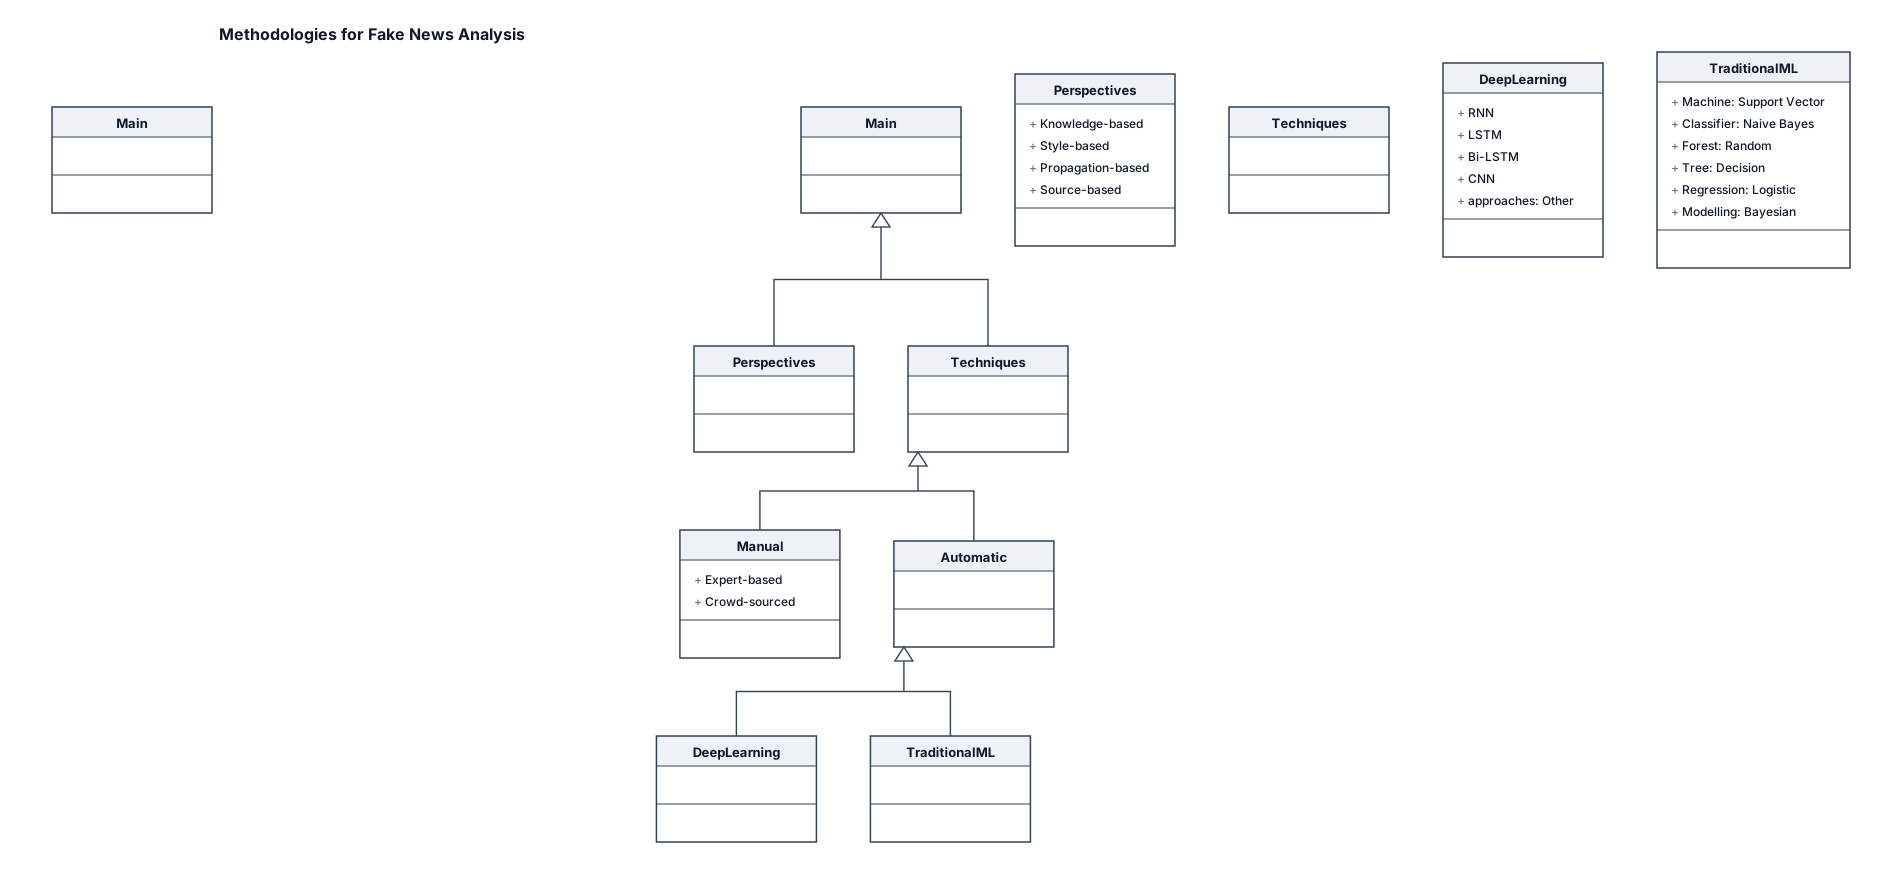
A UML class diagram for an Create a clean academic research-paper classification flowchart titled “Methodologies for Fake News Analysis”. Use a simple black-and-white academic style, similar to a research paper figure. Use rectangular boxes, thin black borders, short connecting lines and downward arrows. Keep the layout compact, organized and hierarchical. At the top, place one main box: “Methodologies for Fake News Analysis”. From this box, create two main branches: 1. Perspectives to Study Fake News Knowledge-based Style-based Propagation-based Source-based 2. Techniques to Detect Fake News Divide this into: Manual Expert-based Crowd-sourced Automatic Divide Automatic into: Deep Learning-based RNN LSTM Bi-LSTM CNN Other approaches Traditional Machine Learning-based Support Vector Machine Naive Bayes Classifier Random Forest Decision Tree Logistic Regression Bayesian Modelling Arrange the branches exactly like a tree/classification diagram, with the main title at the top and categories below it. Keep all text clearly readable. Do not use 3D effects, icons, illustrations, gradients, decorative graphics or unnecessary colors. Make it look like a professional academic research-paper figure suitable for a PowerPoint presentation. Ensure that every label is spelled correctly and no content is omitted or added.
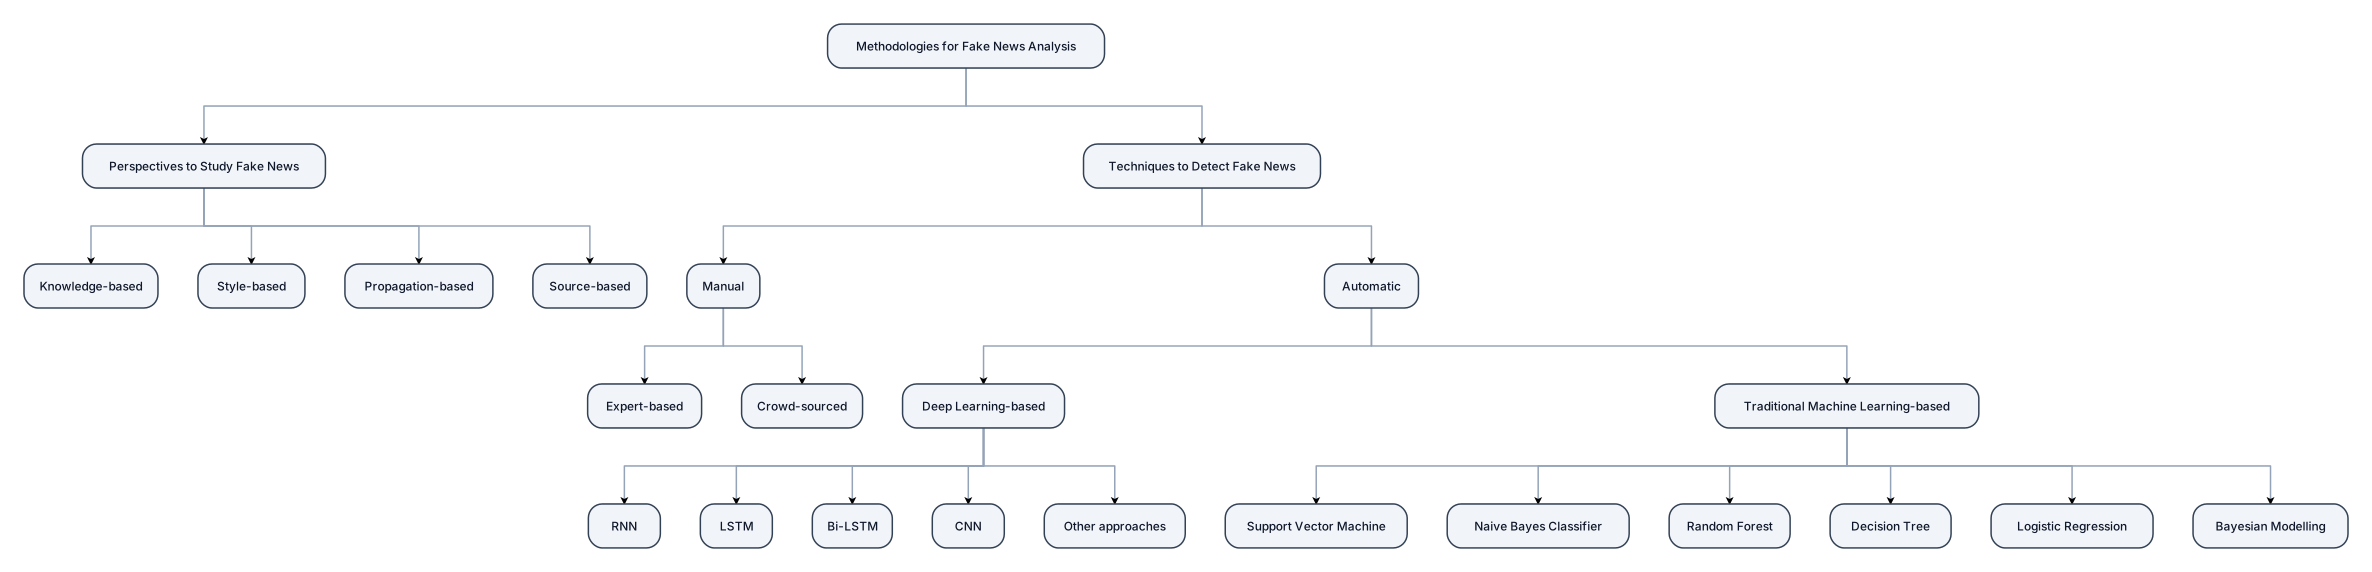
Create a clean academic research-paper classification flowchart titled “Methodologies for Fake News Analysis”. Use a simple black-and-white academic style, similar to a research paper figure. Use rectangular boxes, thin black borders, short connecting lines and downward arrows. Keep the layout compact, organized and hierarchical. At the top, place one main box: “Methodologies for Fake News Analysis”. From this box, create two main branches: 1. Perspectives to Study Fake News Knowledge-based Style-based Propagation-based Source-based 2. Techniques to Detect Fake News Divide this into: Manual Expert-based Crowd-sourced Automatic Divide Automatic into: Deep Learning-based RNN LSTM Bi-LSTM CNN Other approaches Traditional Machine Learning-based Support Vector Machine Naive Bayes Classifier Random Forest Decision Tree Logistic Regression Bayesian Modelling Arrange the branches exactly like a tree/classification diagram, with the main title at the top and categories below it. Keep all text clearly readable. Do not use 3D effects, icons, illustrations, gradients, decorative graphics or unnecessary colors. Make it look like a professional academic research-paper figure suitable for a PowerPoint presentation. Ensure that every label is spelled correctly and no content is omitted or added.
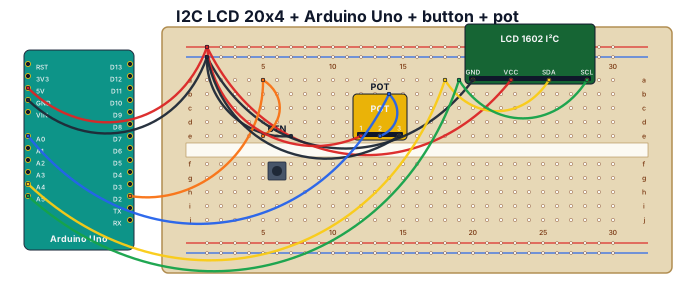
Connect I2C LED 20x4, Arduino Uno and push button, 10 Kohm pot between Arduino rails and its output to A0.
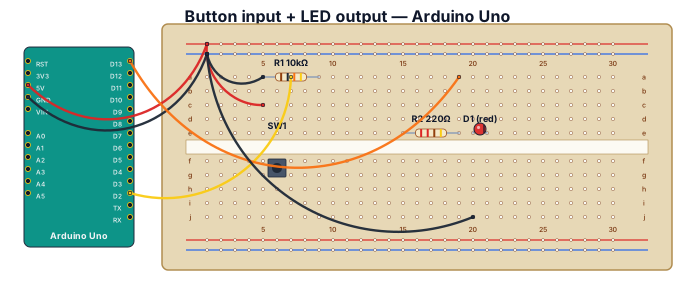
A breadboard wiring diagram for an Arduino Uno reading a button press and lighting an LED: button with pull-down resistor on D2, LED with 220-ohm resistor on D13
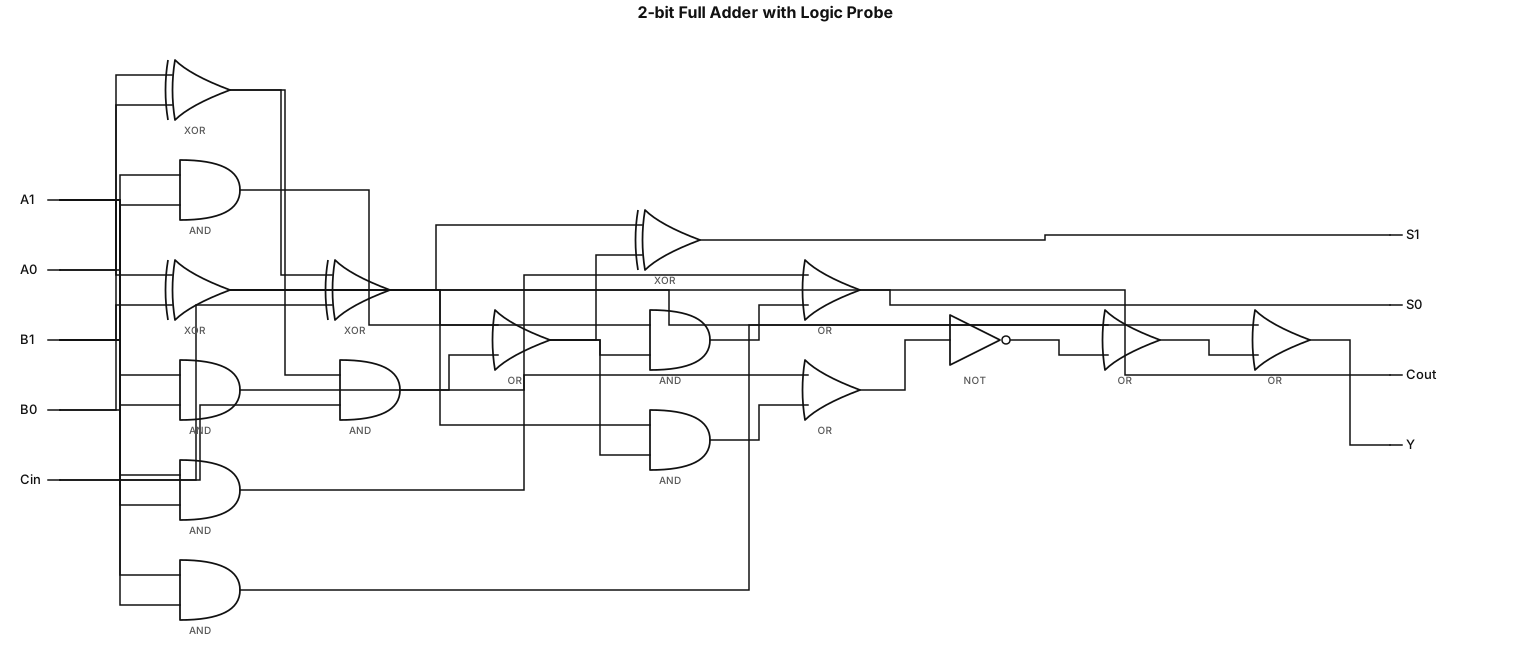
A logic gate circuit for a 2-bit full adder using AND, OR, and XOR gates, LOGICPROBE y = x₁·x₂ + overline(x₃ + overline(x₂·x₃) + x₁·x₂)

Top level: Environmental Sustainability Criteria Main criteria: Six main criteria must be arranged in a single horizontal row directly below the top-level box: GHG (Greenhouse Gases) Emissions (C1) Energy (C2) Waste (C3) Water (C4) Workplaces & Ecosystems (C5) Management (C6) CRITICAL LAYOUT REQUIREMENT: Each main criterion must have its own vertical stack of subcriteria directly underneath it. Do NOT place all subcriteria in one horizontal row. Do NOT align subcriteria from different main criteria with each other. Each subcriterion must remain within the column of its corresponding main criterion. C1 column: Emissions Inventory Reporting (C11) Operational Emissions Reduction and Compensation (C12) Decarbonizing the Supply Chain (C13) C2 column: Reducing Energy Consumption (C21) Energy Efficiency (C22) Renewable Energy Integration (C23) C3 column: Effective Waste Diversion (C31) Data Center Hardware (C32) C4 column: Water Consumption for Resource Conservation (C41) Water Discharge (C42) C5 column: Green Building Certifications (C51) Sustainable Commuting Infrastructure (C52) C6 column: ISO 14001 (Environmental Management System) Compliance (C61) ISO 50001 (Energy Management System) Compliance (C62) The hierarchy must visually follow this exact pattern: Environmental Sustainability Criteria ↓ Six main criteria arranged horizontally ↓ Each main criterion has its own independent vertical column of subcriteria Use straight, thin connector lines. The connector from each main criterion should branch downward to its own subcriteria. Keep each column clearly separated from the neighboring columns.

Follow the reference image EXACTLY for the layout, box positions, hierarchy, connector lines, spacing, and overall composition. Top level: Environmental Sustainability Criteria Six main criteria in one horizontal row: GHG (Greenhouse Gases) Emissions (C1) Energy (C2) Waste (C3) Water (C4) Workplaces & Ecosystems (C5) Management (C6) Subcriteria: C1: Emissions Inventory Reporting (C11) Operational Emissions Reduction and Compensation (C12) Decarbonizing the Supply Chain (C13) C2: Reducing Energy Consumption (C21) Energy Efficiency (C22) Renewable Energy Integration (C23) C3: Effective Waste Diversion (C31) Data Center Hardware (C32) C4: Water Consumption for Resource Conservation (C41) Water Discharge (C42) C5: Green Building Certifications (C51) Sustainable Commuting Infrastructure (C52) C6: ISO 14001 (Environmental Management System) Compliance (C61) ISO 50001 (Energy Management System) Compliance (C62) Use one top-center box → six horizontally aligned main-criterion boxes → vertically aligned subcriterion boxes, exactly as shown in the reference image. Use straight, thin, perfectly aligned connector lines. Center all text horizontally and vertically. Use clean rectangular boxes, consistent proportions, academic colors, lighter shades for subcriteria, white background, thin borders, and no icons, shadows, or decorative elements. Preserve the exact wording, criterion codes, hierarchy, relationships, and layout of the reference image. Do not add, remove, rename, or reinterpret any element. The final figure should look like a professional Adobe Illustrator/Inkscape vector figure prepared for direct insertion into an SCI Q1 journal manuscript.
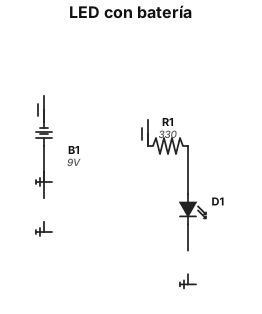
quiero este circuito. ┌───────────[ LED ]───────────┐ │ │ (+)│ │ ┌───┴───┐ │ │ Batería│ │ └───┬───┘ │ (-)│ │ └──────────────────────────────┘
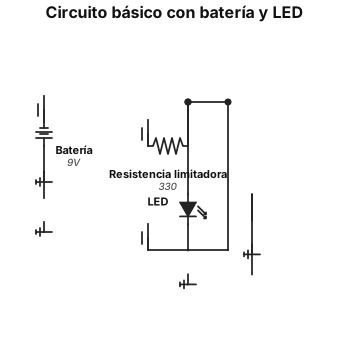
un circuito sencillo que lleve estos materiales. y que venga identificado cada parte del circuito. 1 batería Cables conductores 1 LED o bombillo pequeño
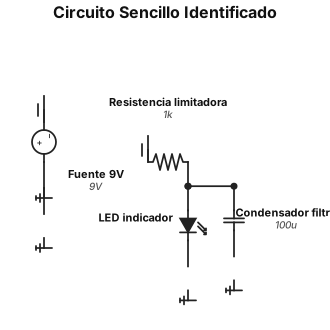
circuito sencillo pero que venga identificado cada parte del circuito