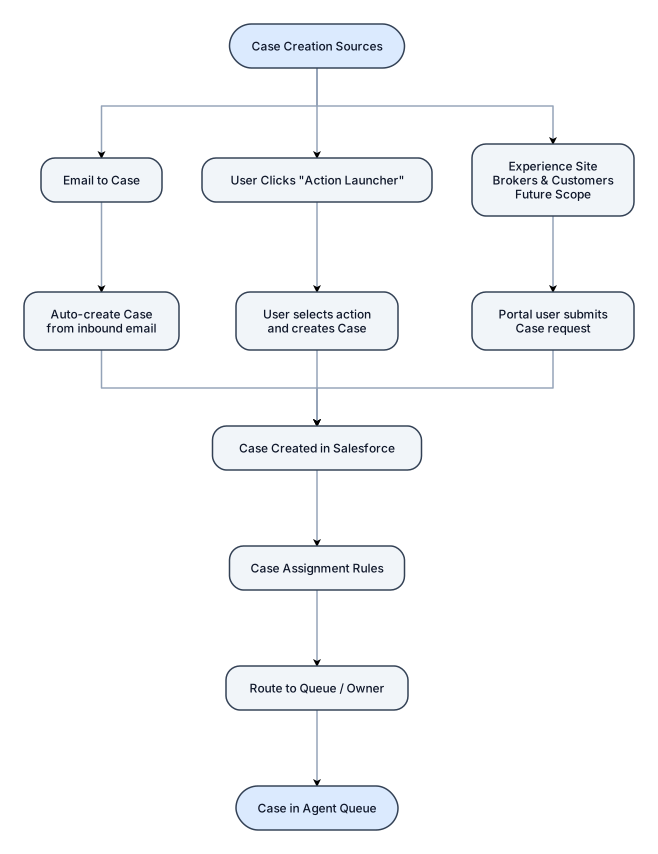
Design a flowchat for salesforce case creation , 1. Case creation sources - Email to case , user clicks on "Action Launcher" , Experience site (Brokers and Customers)[future scope]
NODE ARCHIVE · REAL DIAGRAM BRIEFS
Diagram Examples from Real Visitor Prompts
Browse eligible diagrams shared by FreeDiagram visitors, inspect the exact prompts, and build your own version.
Browse 3263 real creationsCOMMUNITY OUTPUTS · EXACT PROMPTS
Main diagram studio
Showing 193–216 of 1256. No stock examples or system defaults. Choose a tool, study a real result, then reopen its prompt as your starting point.
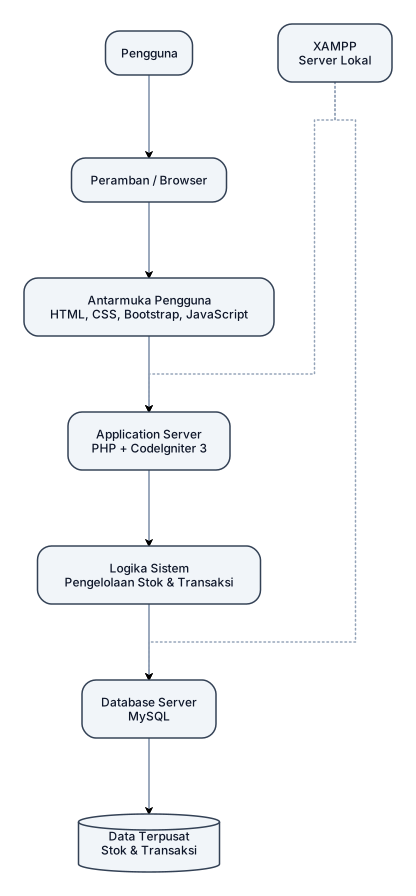
2.2.6 Sistem Berbasis Web dan Arsitektur Client-Server Sistem berbasis web diakses pengguna melalui peramban. Arsitektur client-server terdiri dari antarmuka pengguna (client), aplikasi web (application server) yang menjalankan logika sistem, dan basis data (database server) yang menyimpan data secara terpusat, sehingga data stok dapat disinkronkan setiap terjadi transaksi (Rohim & Indera, 2026). Rohim dan Indera (2026) membangun sistem inventori gudang perkebunan dengan bahasa pemrograman PHP dan framework CodeIgniter 3, antarmuka HTML, CSS, Bootstrap, dan JavaScript, basis data MySQL, serta XAMPP sebagai server lokal selama pengembangan. Kombinasi teknologi tersebut juga menjadi acuan penelitian ini. buat kan saya digram flownya
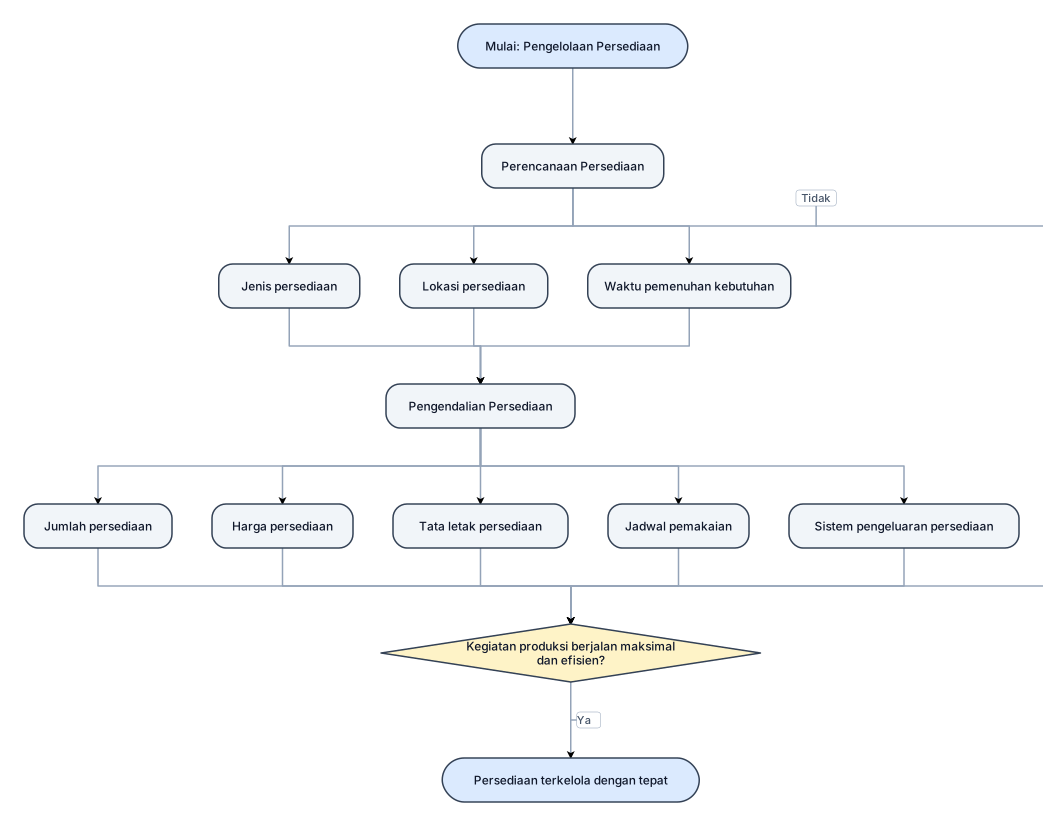
Persediaan merupakan aktiva perusahaan yang menempati posisi cukup penting, baik pada perusahaan dagang maupun manufaktur (Putri dkk., 2022, dalam Situmorang & Situmorang, 2023). Persediaan berfungsi memperlancar keperluan operasi sehingga kegiatan produksi dapat berjalan maksimal dan efisien, dan sebagai bagian dari aset lancar ia harus dikelola dengan tepat karena menimbulkan biaya yang besar (Situmorang & Situmorang, 2023). Pengelolaan persediaan mencakup perencanaan, yaitu jenis, lokasi, dan waktu pemenuhan kebutuhan, serta pengendalian, yaitu jumlah dan harga, tata letak, jadwal pemakaian, dan sistem pengeluaran persediaan (Situmorang & Situmorang, 2023). buat kan saya diagram flownya
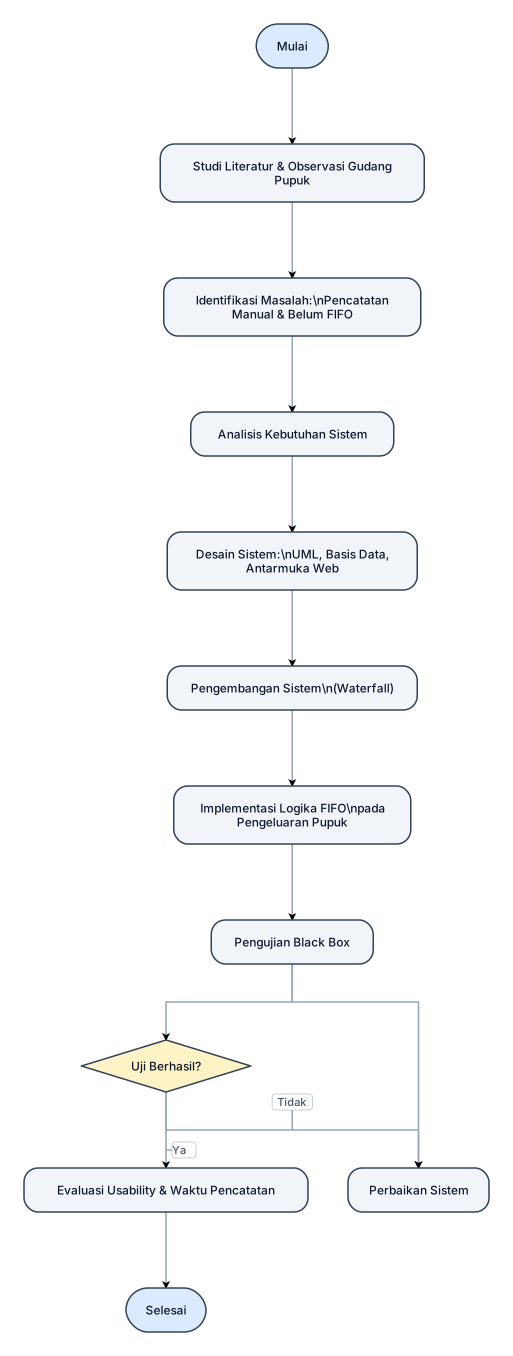
No Peneliti (Tahun) Objek dan Metode Hasil Perbedaan dengan Penelitian Ini 1 Situmorang & Situmorang (2023) Edukasi pengeluaran fisik persediaan pupuk sistem FIFO di PT Kalimantan Hamparan Sawit; observasi, wawancara, dan edukasi selama 2 hari Persediaan pupuk harus diidentifikasi menurut jenis dan umur, disusun rapi dan dipisah per jenis; pengeluaran mengikuti FIFO; tata letak gudang perlu dibenahi Berupa kegiatan edukasi, belum membangun sistem informasi berbasis web 2 Prasetyaningrum & Setyawan (2023) Sistem ERP modul Inventory Management pada Kantor Perwakilan PT BGA Group; wawancara, pengamatan, studi pustaka; pengembangan Agile; pengujian Black Box 20 skenario pengujian seluruhnya sesuai; sistem mempercepat permintaan, pengiriman, dan pengembalian barang serta pembuatan daftar PO, surat jalan, dan laporan Berfokus pada alur permintaan dan pengiriman barang antara kebun dan kantor perwakilan, bukan perhitungan stok pupuk di gudang 3 Rohim & Indera (2026) Sistem informasi inventori berbasis web dengan pemantauan stok real-time pada gudang perkebunan kelapa sawit; Waterfall, UML, PHP (CodeIgniter 3), MySQL; pengujian Black Box 25 skenario berhasil 100%; stok diperbarui otomatis setelah transaksi; waktu pencatatan barang masuk turun dari 10 menit menjadi 3 menit; nilai usability rata-rata 4,44 dari skala 5 Mengelola barang gudang secara umum; belum dikhususkan pada pupuk, tanpa penerapan urutan pengeluaran FIFO buat kan saya diagram flownya
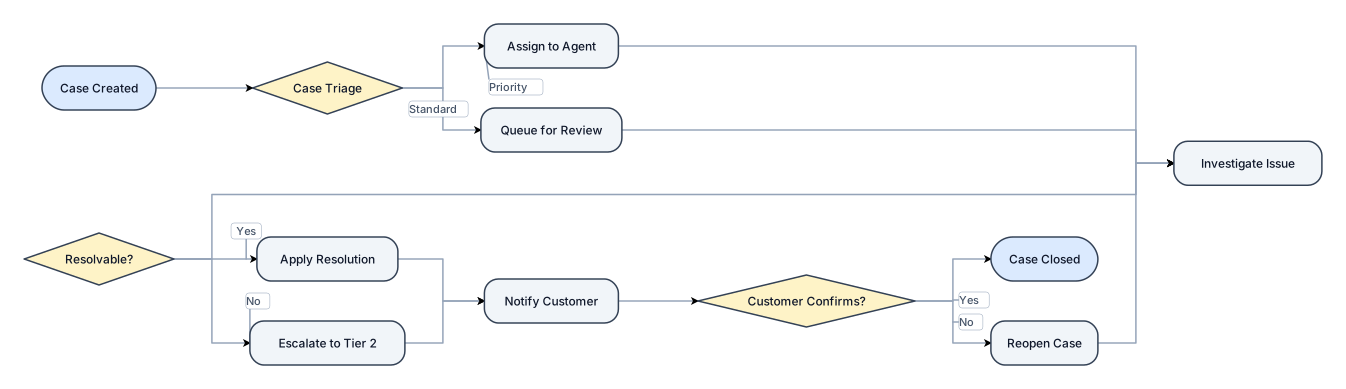
Design a flowchat for salesforce case management , can we have it horizontal way in two lines split

Design a flowchat for salesforce case management , can we have it horizontal way
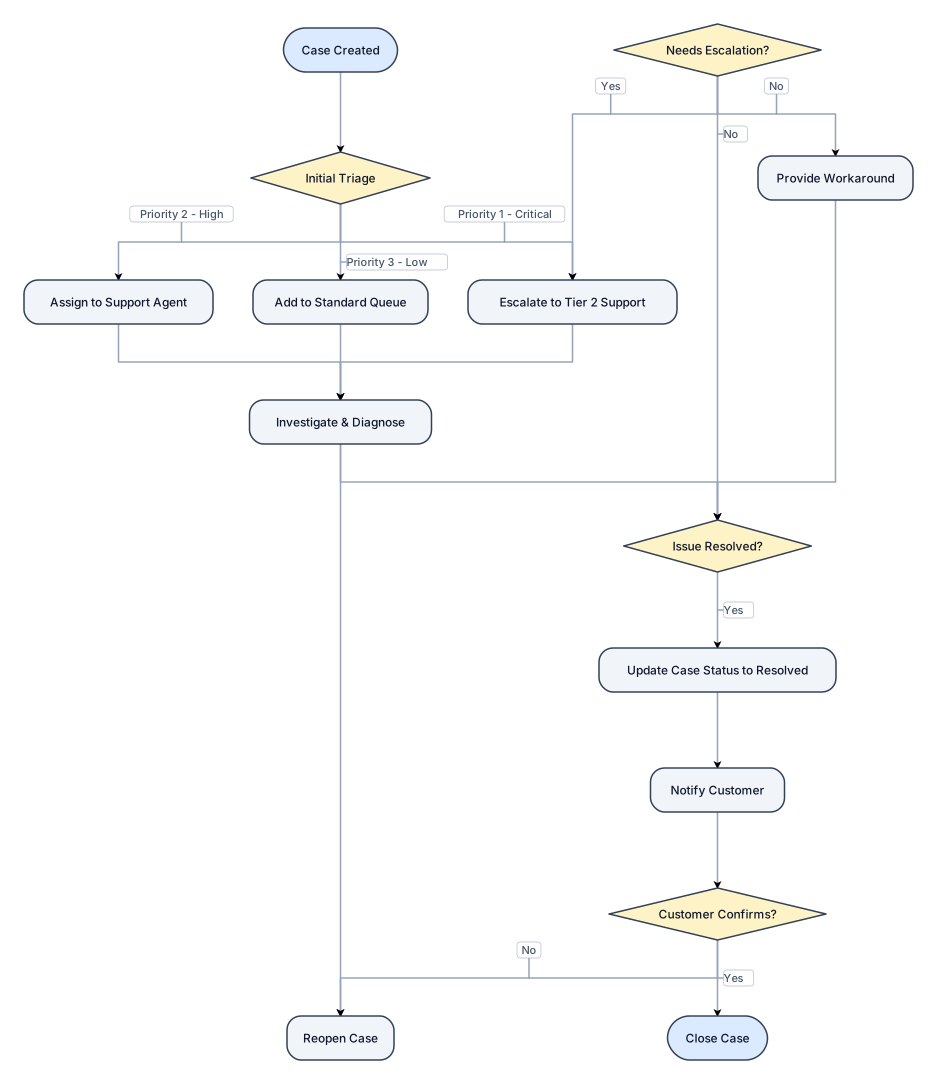
Design a flowchat for salesforce case management
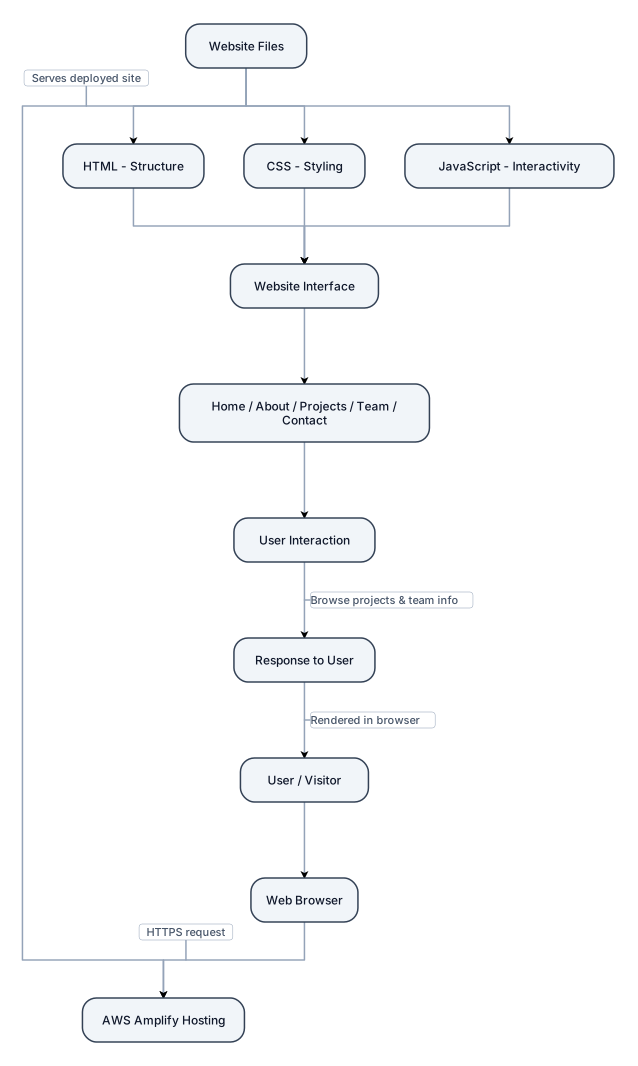
reate a clean, professional System Architecture Flowchart for a college Cloud Computing mini-project called OurSpace – Cloud-Based Project Portfolio Website. The diagram should explain how the website works and how it is hosted on AWS Amplify. Flowchart sequence: User / Visitor – Opens the OurSpace website in a web browser. Web Browser – Sends an HTTPS request to access the website. AWS Amplify Hosting – Receives the request and serves the deployed website. Website Files – HTML provides the structure, CSS handles styling, and JavaScript provides interactive functionality. Website Interface – Displays the Home, About, Projects, Team, and Contact sections. User Interaction – Visitors browse project details and team information. Response to User – The website is displayed in the user's browser.

Part 1: Food Dye Selection and Pasco Spectrophotometer Use Choose two food dye stock solutions (M1=2.510-4M) from the available choices (Red #40, Green #3, Yellow #5, Yellow #6, or Blue #1. Fill cuvette 34 full with stock solution; record visible absorption spectrum using Pasco spectrometer. Identify peak wavelength () for each dye and fix this wavelength for all subsequent readings. Part 2: Preparation of Standard Solutions Use the dilution equation M1V1=M2V2 to calculate the volume of stock solution (V1) needed to prepare five standard solutions (A–E) in a total volume V2=25.0mL within the specified concentration range. Pipette calculated V1 into a 25.0mL volumetric flask, dilute to mark with D.I. water, invert to mix, and transfer to labeled test tubes A–E. Thoroughly rinse glassware with D.I. water between samples and repeat for standards A–E and the second dye. Part 3: Measurement of the Absorbance of Each Dilution Set spectrometer to the dye's specific . Fill a cuvette 34 full with standard solution A, place it into the spectrometer, and click “Record”. Record the absorbance value in Data Table 2. Pour the solution from the cuvette back into test tube A. Repeat the absorbance measurement two additional times for a total of three trials per dilution. Rinse the cuvette with D.I. water and tap it dry gently on a paper towel. Repeat the process for standard solutions B through E and for the second food dye. Calculate the average absorbance for each sample and log the results in Data Tables 1–4 Part 4: Create Calibration Curves In Excel, plot Average Absorbance (Y-axis) vs. Final Concentration M2 (X-axis) as a Scatter Plot. Add a linear trendline, displaying equation (y=mx+b) and R2 value (0.95). Add title and axis labels. Repeat Steps 1–6 using the data from Table 3.
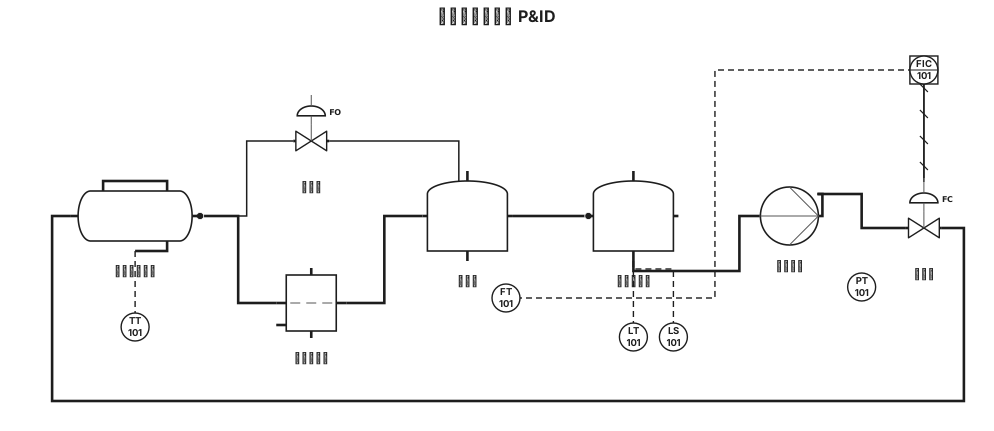
工具機 切削系統 p&id

making an app for ai to track what is in fridge and provide recipes and keep track of expiration dates make lofi framework for: Checking the food inventory Page 1: Home Page Page 2: Inventory List For each item: expiry, detail, Sort options Sort by expiry, alphabetical, category, etc. Filter by inventory category filter (pantry, freezer) Filter by item category (dairy, protein, etc.) Search bar [F07] Add Item [F01] Add by writing down each item Add by taking a photo Mark Item as consumed Calendar Toggle (calendar view that shows which items are inspiring on what day) [Need to add new FR] Page 3: Add Item Page 4: View Item
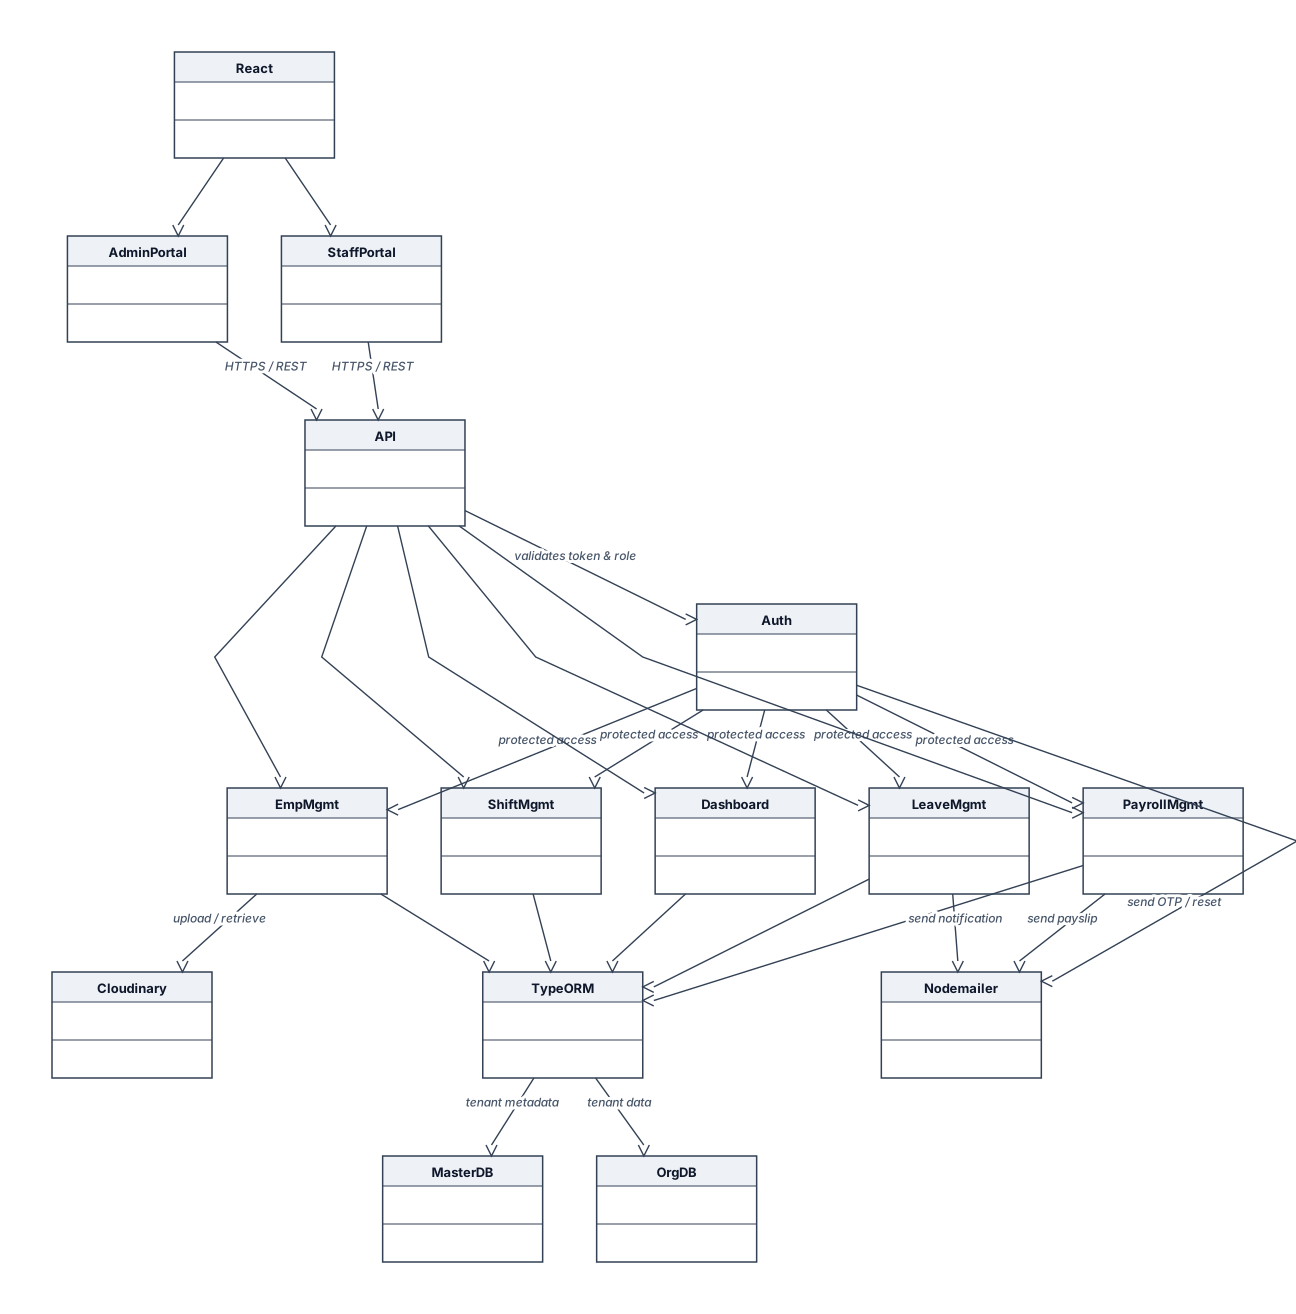
Create a professional **Software Component Diagram for a Human Resource Management System (HRMS)** for a B.Tech Information Technology project report. **Design requirements:** - White background with black text. - Thin purple borders and arrows. - Clean, simple, academic style. - Use standard UML component diagram notation. - Arrange components from top to bottom or left to right. - Keep labels readable and avoid unnecessary details. **Include these components and connections:** 1. **Frontend Layer** - React.js - Admin Portal - Staff Portal 2. **Backend Layer** - Node.js - Express.js REST API - Authentication and Authorization (JWT and Role-Based Access Control) - Employee Management - Shift and Attendance Management - Leave Management - Payroll Management - Dashboard and Reports 3. **Database Layer** - Master PostgreSQL Database - Organization-Specific PostgreSQL Databases - TypeORM for database communication 4. **External Services** - Cloudinary for file and image storage - Nodemailer for email notifications **Show the connections clearly:** - Admin Portal and Staff Portal communicate with the Express.js REST API. - The API connects to the backend HRMS modules. - Authentication and authorization control access to protected modules. - TypeORM connects the backend to the master database and organization-specific databases. - Cloudinary handles file uploads and storage. - Nodemailer sends email notifications. Use arrows to show communication and dependencies. Keep the master database visually separate from organization-specific databases to represent the multi-tenant architecture. The final diagram should be suitable for inserting into a project report as **Figure 6.6: Software Component Diagram**. Do not add unsupported technologies or unnecessary components.
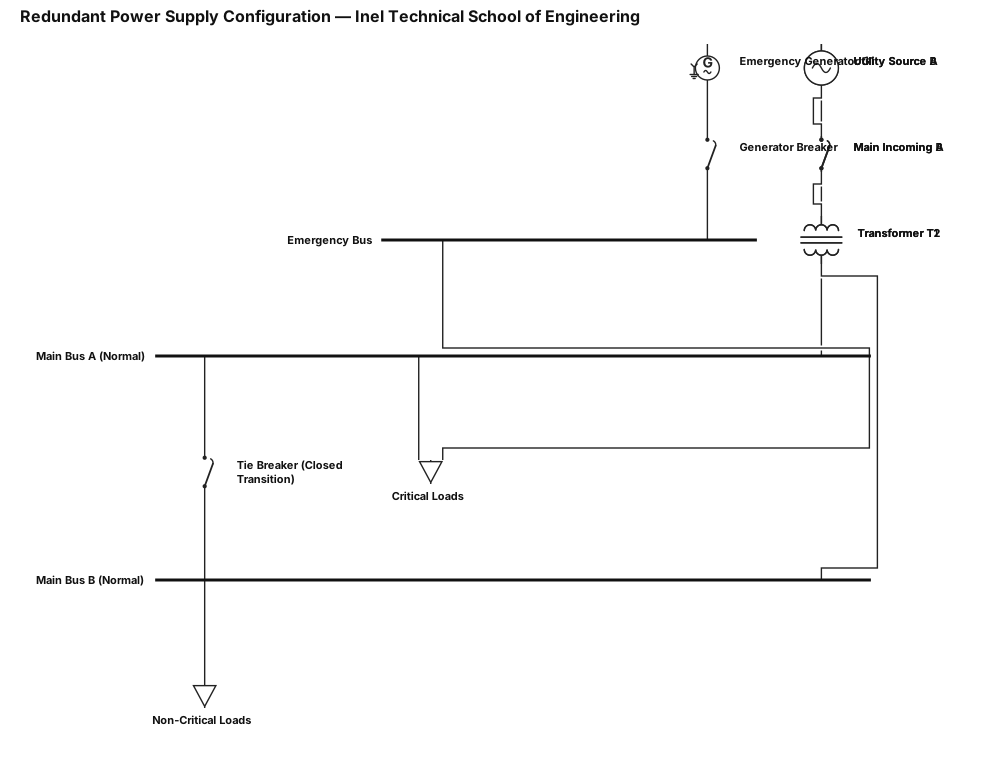
2.1. The system configuration must be redundant; this means there will be two independent power sources and a generator, operating under different conditions: * Normal operation: both main sources are operating * Critical operation: one transformer is lost, and the other takes on the entire load Inel – Technical School of Engineering Final Project | Power Quality Instructor: Daniel Sanchez * Emergency operation: the generator takes on the load via closed transition 2.2. Based on what was covered in class, present a configuration using a single-line diagram that includes all the minimum required elements discussed in class.
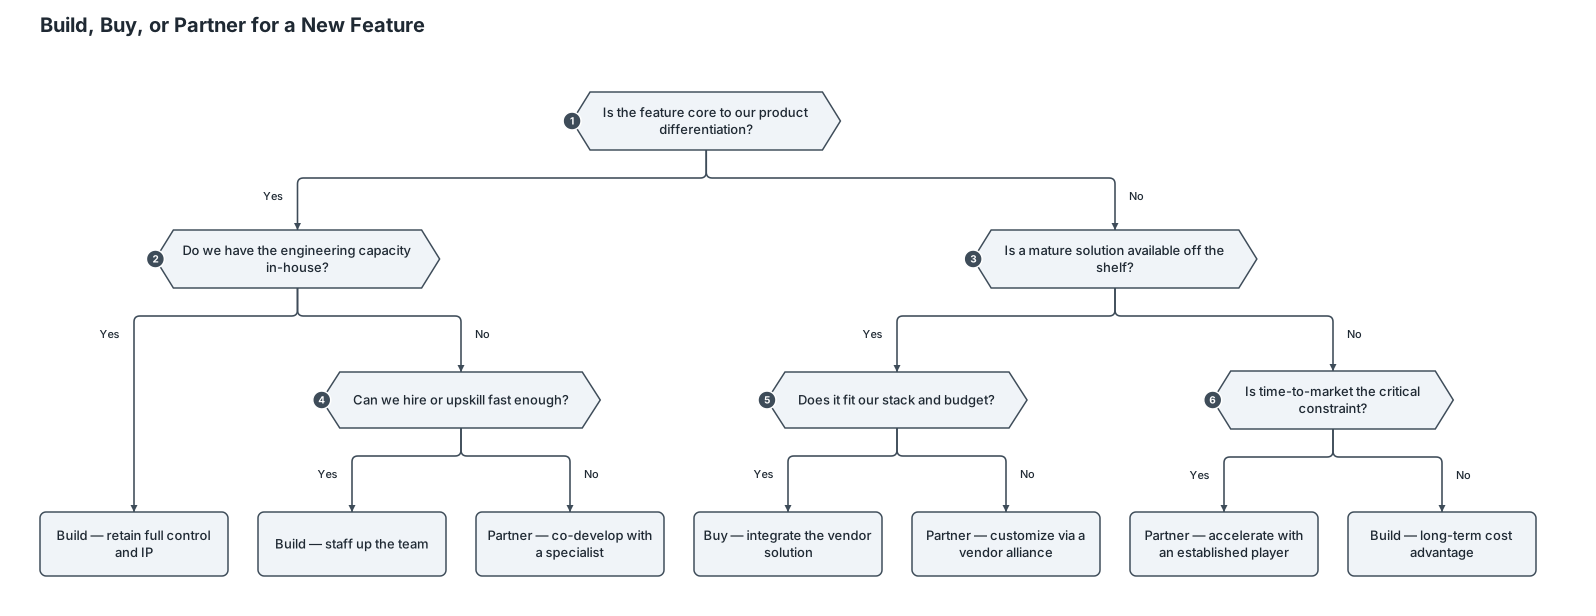
A decision tree for whether a startup should build, buy, or partner for a new feature1. Diagrama de jerarquía CONSTRUCCIÓN DE CASA DE 1 PISO (Resp: Ing. Residente) 1.1 CIMENTACIÓN Y OBRAS PRELIMINARES (Resp: Maestro Mayor de Obra) 1.1.1 Limpieza y Replanteo (Resp: Topógrafo) 1.1.2 Excavación de Zanjas (Resp: Operador Maquinaria) 1.1.3 Vaciado de Concreto (Resp: Albañiles) 1.2 ESTRUCTURA Y ALBAÑILERÍA (Resp: Maestro Albañil) 1.2.1 Paredes y Muros (Resp: Albañiles) 1.2.2 Columnas y Vigas (Resp: Fierreros) 1.2.3 Techado de la Cubierta (Resp: Técnico Techador) 1.3 INSTALACIONES TÉCNICAS M.E.P. (Resp: Supervisor de Instalaciones) 1.3.1 Red de Plomería (Resp: Maestro Plomero) 1.3.2 Red Eléctrica (Resp: Técnico Electricista) 1.4 ACABADOS Y ENTREGA FINAL (Resp: Supervisor de Acabados) 1.4.1 Friso y Pintura (Resp: Pintor) 1.4.2 Colocación de Pisos (Resp: Ceramista) 1.4.3 Limpieza e Inspección (Resp: Capataz)

1. CONSTRUCCIÓN DE CASA DE 1 PISO (Resp: Ing. Residente) 1.1 CIMENTACIÓN Y OBRAS PRELIMINARES (Resp: Maestro Mayor de Obra) 1.1.1 Limpieza y Replanteo (Resp: Topógrafo) 1.1.2 Excavación de Zanjas (Resp: Operador Maquinaria) 1.1.3 Vaciado de Concreto (Resp: Albañiles) 1.2 ESTRUCTURA Y ALBAÑILERÍA (Resp: Maestro Albañil) 1.2.1 Paredes y Muros (Resp: Albañiles) 1.2.2 Columnas y Vigas (Resp: Fierreros) 1.2.3 Techado de la Cubierta (Resp: Técnico Techador) 1.3 INSTALACIONES TÉCNICAS M.E.P. (Resp: Supervisor de Instalaciones) 1.3.1 Red de Plomería (Resp: Maestro Plomero) 1.3.2 Red Eléctrica (Resp: Técnico Electricista) 1.4 ACABADOS Y ENTREGA FINAL (Resp: Supervisor de Acabados) 1.4.1 Friso y Pintura (Resp: Pintor) 1.4.2 Colocación de Pisos (Resp: Ceramista) 1.4.3 Limpieza e Inspección (Resp: Capataz)
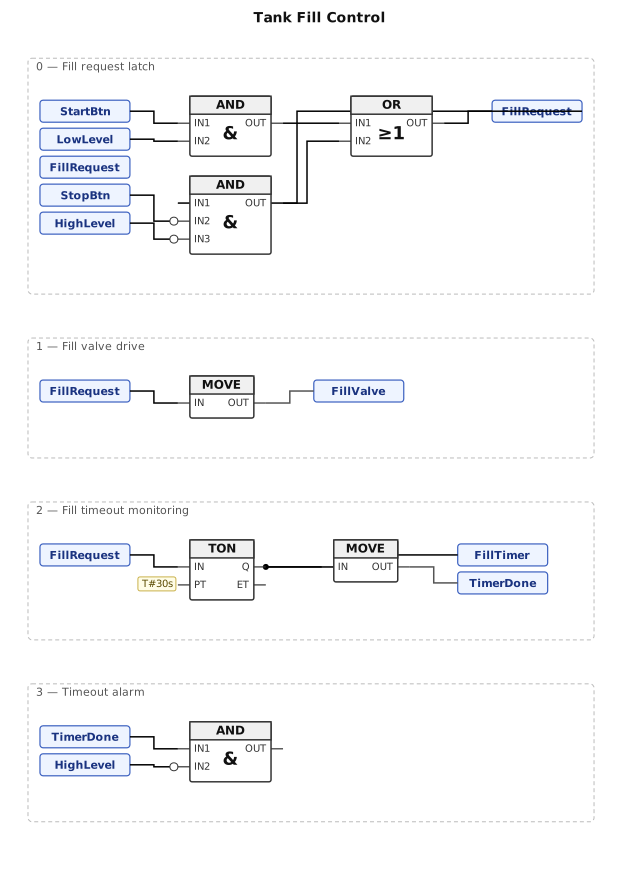
A function block diagram for a tank fill control using a TON timer and AND/OR logic
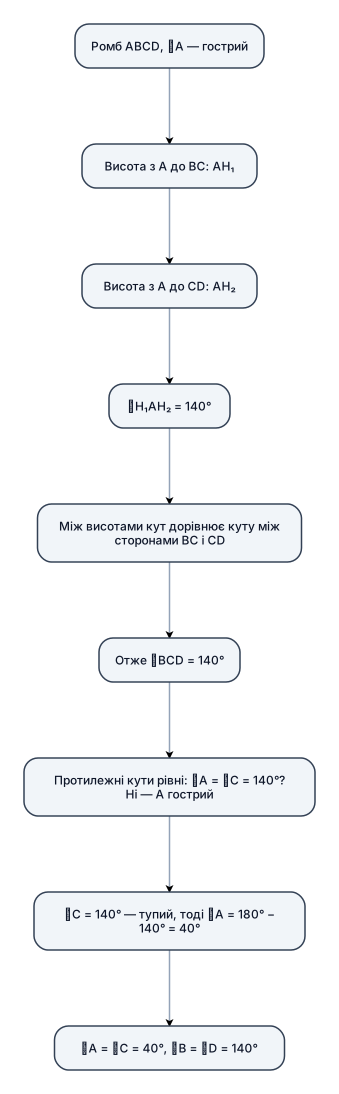
Висоти, проведені з вершини гострого кута ромба, утв рюють кут 140°. Знайдіть кути ромба. Намалюй малюнок
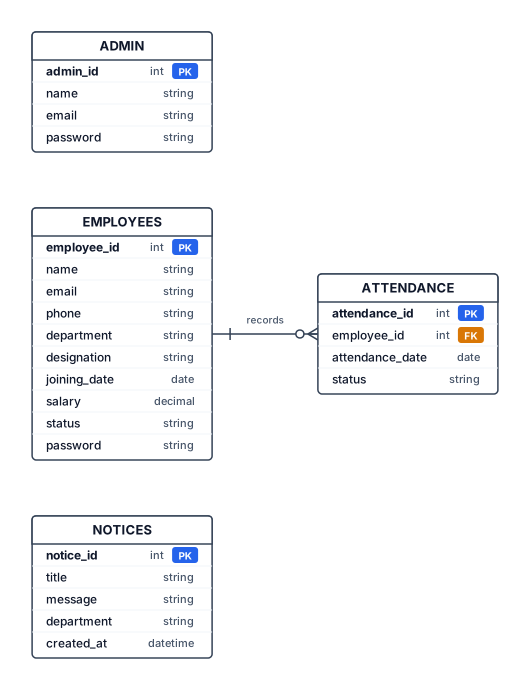
Create a professional ER diagram for an Employee Management System (EMS). Include entities ADMIN, EMPLOYEES, ATTENDANCE, and NOTICES. EMPLOYEES: employee_id (PK), name, email, phone, department, designation, joining_date, salary, status, password. ATTENDANCE: attendance_id (PK), employee_id (FK), attendance_date, status. ADMIN: admin_id (PK), name, email, password. NOTICES: notice_id (PK), title, message, department, created_at. Show one-to-many relationship between EMPLOYEES and ATTENDANCE. Mark all PKs and FKs clearly. Use Crow's Foot notation, a white background, navy-blue headers, and a clean academic layout. Do not invent relationships or foreign keys.
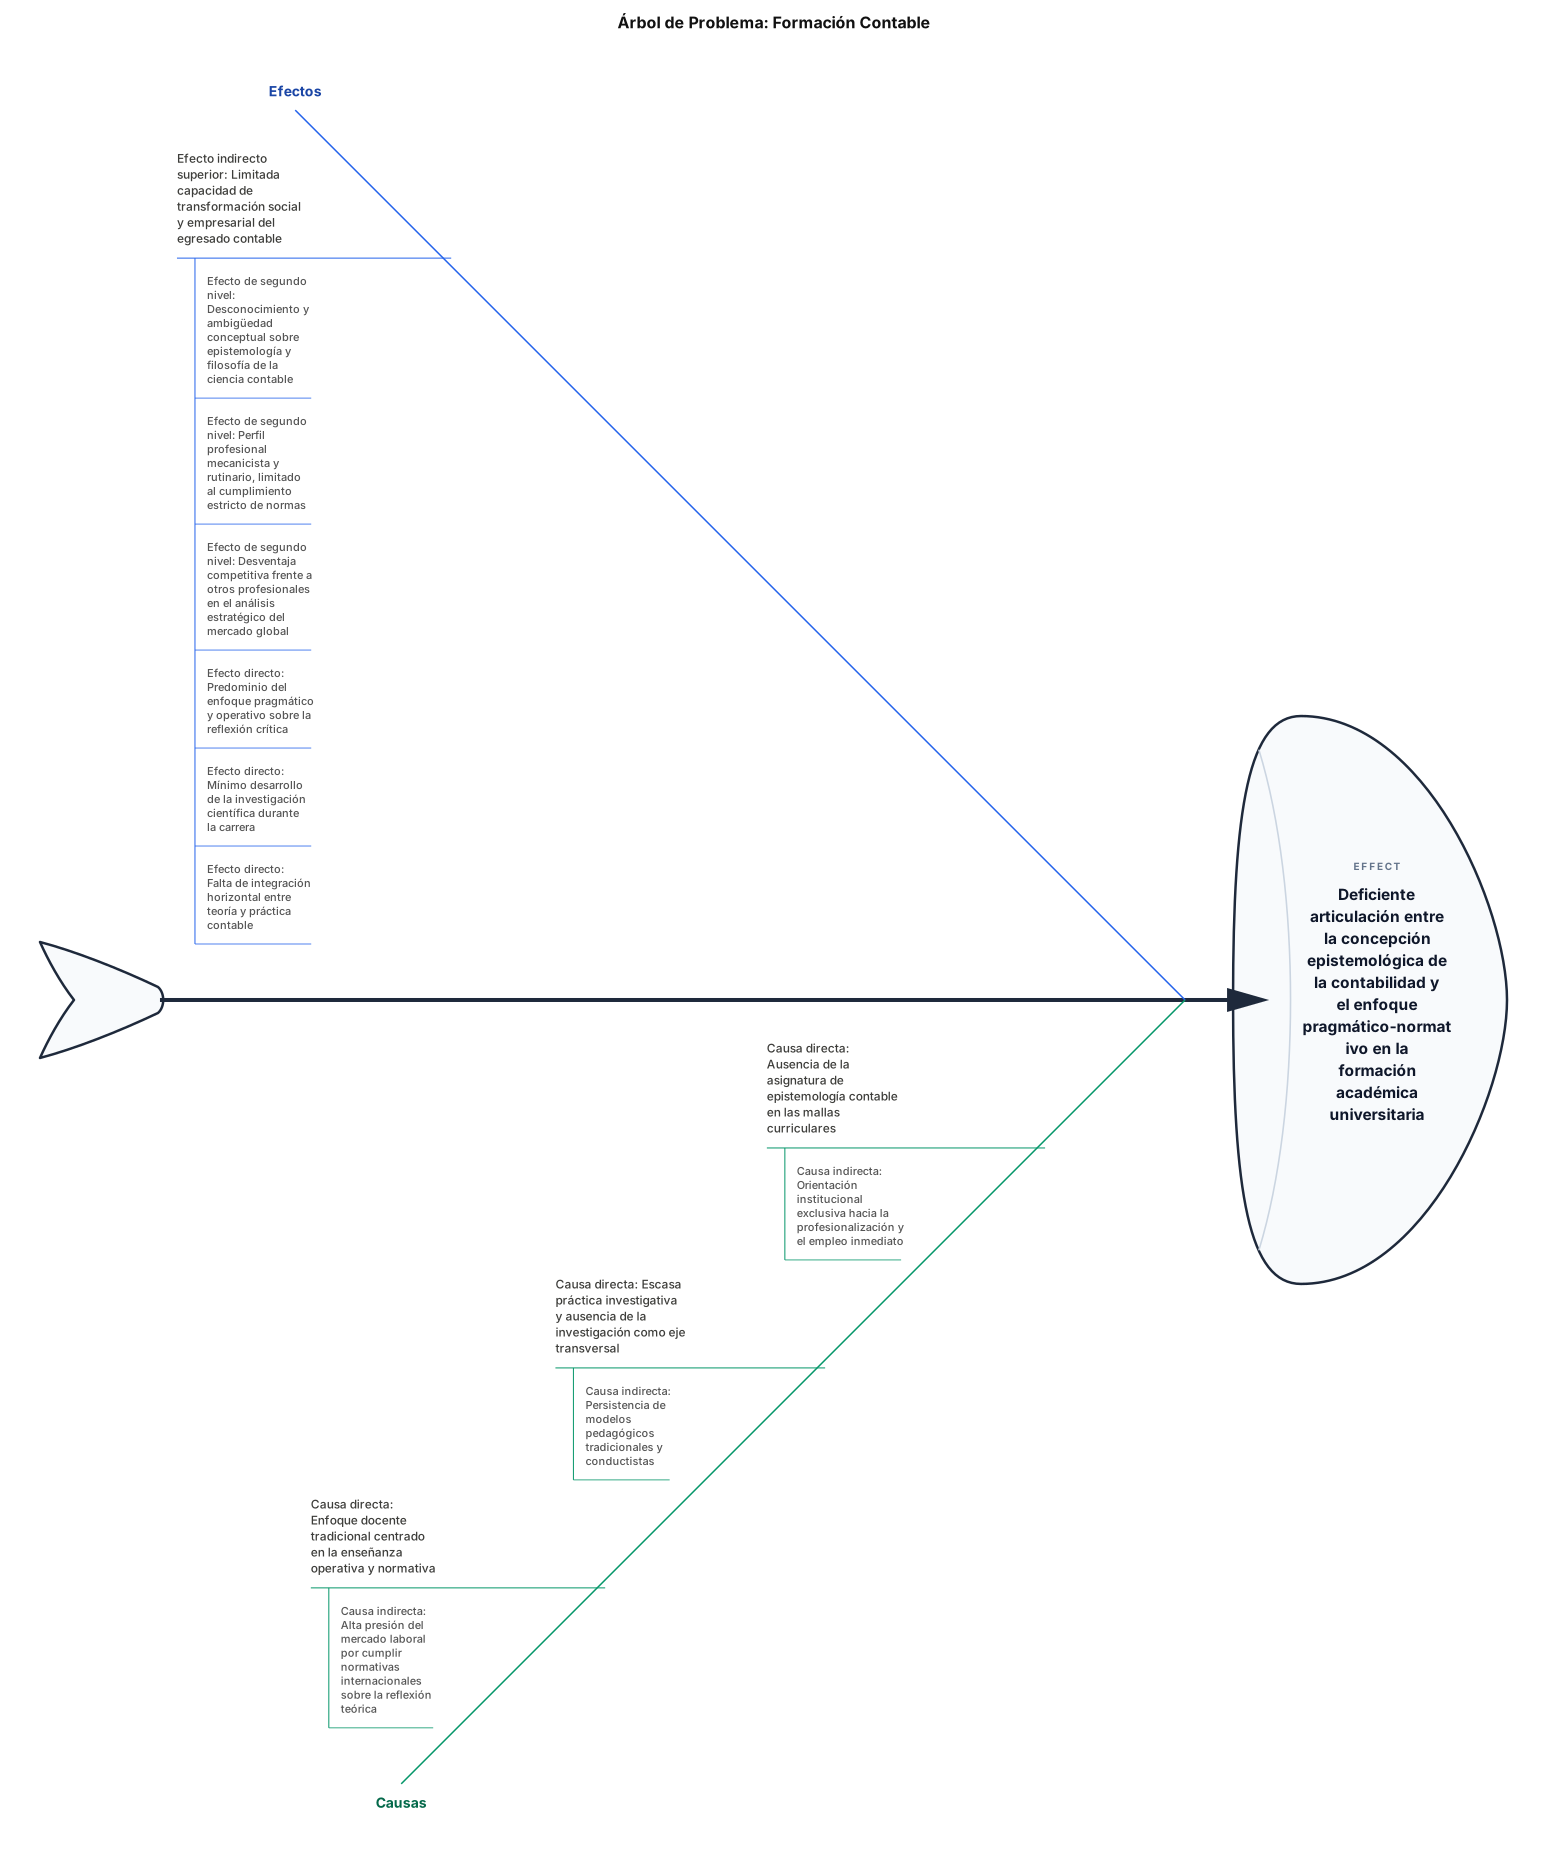
EFECTOS (Arriba)Efecto indirecto superior (Consecuencia final):Limitada capacidad de transformación social y empresarial por parte del egresado contable.Efectos de segundo nivel:Desconocimiento y ambigüedad conceptual sobre la epistemología y la filosofía de la ciencia contable. Perfil profesional eminentemente mecanicista y rutinario, limitado al cumplimiento estricto de normas. Desventaja competitiva frente a otros profesionales en el análisis estratégico del mercado global. Efectos directos (Primer nivel sobre el problema):Predominio del enfoque pragmático y operativo por encima de la reflexión crítica.Mínimo desarrollo de la investigación científica durante la carrera profesional. Falta de integración horizontal entre la teoría y la práctica contable. PROBLEMA CENTRAL (En el centro)Deficiente articulación entre la concepción epistemológica de la contabilidad y el enfoque pragmático-normativo en la formación académica universitaria. CAUSAS (Abajo)Causas directas (Primer nivel bajo el problema):Ausencia de la asignatura de epistemología contable en las mallas curriculares. Escasa práctica investigativa y ausencia de la investigación como eje transversal en el aula. Enfoque docente tradicional, centrado exclusivamente en la enseñanza operativa y normativa. Causas indirectas (Raíces profundas):Orientación institucional de la carrera de forma exclusiva hacia la profesionalización y el empleo inmediato. Persistencia de modelos pedagógicos tradicionales y conductistas centrados en la acumulación vertical de contenidos. Alta presión del mercado laboral y del entorno comercial local por cumplir normativas internacionales y financieras por encima de la reflexión teórica. HAZMELO TIPO ARBOL PROBLEMA CENTRAL EN EL CENTRO, EFECTOS DIRECTO PRIMER NIVEL SOBRE EL PROBLEMA, EFECTOS EL SEGUNDO NIVEL Y ARRIBA DEL TODO EFECTO INDIRECTO SUPERIOR DEPUES ANAJO DEL PROBLEMA CAUSAS DIRECTAS, Y DEPUES CAUSAS INDIRECTAS ABAJO DEL TODO
EFECTOS (Arriba)Efecto indirecto superior (Consecuencia final): Limitada capacidad de transformación social y empresarial por parte del egresado contable. Efectos de segundo nivel: Desconocimiento y ambigüedad conceptual sobre la epistemología y la filosofía de la ciencia contable. Perfil profesional eminentemente mecanicista y rutinario, limitado al cumplimiento estricto de normas. Desventaja competitiva frente a otros profesionales en el análisis estratégico del mercado global. Efectos directos (Primer nivel sobre el problema): Predominio del enfoque pragmático y operativo por encima de la reflexión crítica. Mínimo desarrollo de la investigación científica durante la carrera profesional. Falta de integración horizontal entre la teoría y la práctica contable. PROBLEMA CENTRAL (En el centro)Deficiente articulación entre la concepción epistemológica de la contabilidad y el enfoque pragmático-normativo en la formación académica universitaria. CAUSAS (Abajo)Causas directas (Primer nivel bajo el problema): Ausencia de la asignatura de epistemología contable en las mallas curriculares. Escasa práctica investigativa y ausencia de la investigación como eje transversal en el aula. Enfoque docente tradicional, centrado exclusivamente en la enseñanza operativa y normativa. Causas indirectas (Raíces profundas) :Orientación institucional de la carrera de forma exclusiva hacia la profesionalización y el empleo inmediato. Persistencia de modelos pedagógicos tradicionales y conductistas centrados en la acumulación vertical de contenidos. Alta presión del mercado laboral y del entorno comercial local por cumplir normativas internacionales y financieras por encima de la reflexión teórica.
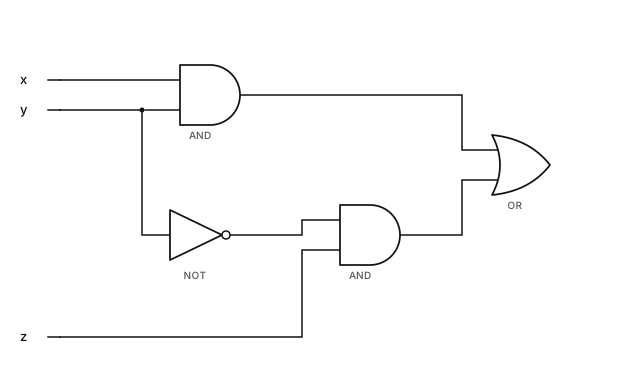
\[ F=xy+y'z \]
NOT gate: \(y \rightarrow y'\) AND gate 1: \(x,y \rightarrow xy\) AND gate 2: \(y',z \rightarrow y'z\) OR gate: \(xy,y'z \rightarrow F\)
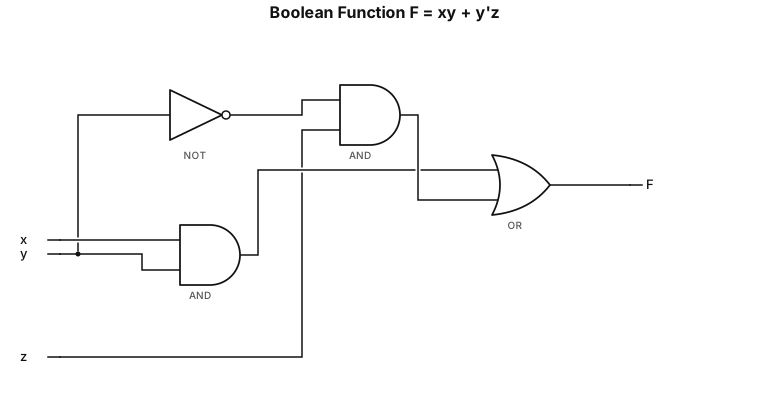
NOT gate: \(y \rightarrow y'\) AND gate 1: \(x,y \rightarrow xy\) AND gate 2: \(y',z \rightarrow y'z\) OR gate: \(xy,y'z \rightarrow F\)
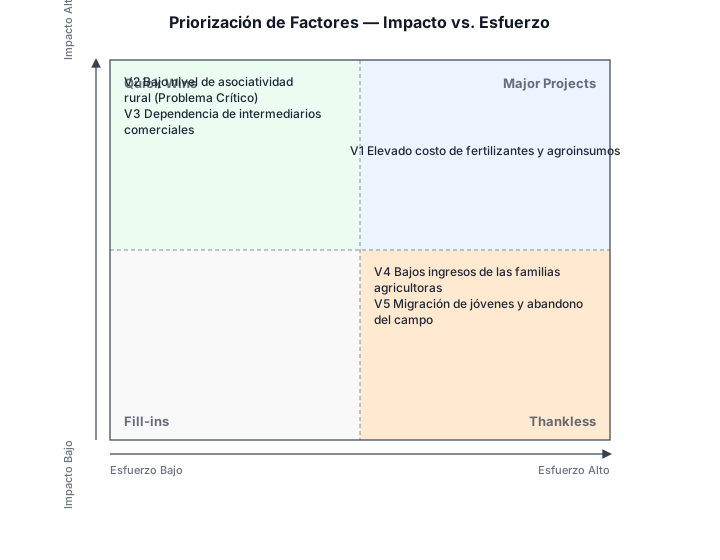
A 2x2 priority matrix plotting features by impact versus effort Código Variable / Factor de Estudio Clasificación según Matriz de Vester Descripción de la Dinámica Causal V1 Elevado costo de fertilizantes y agroinsumos Variable Activa (Causa) Ejerce alta influencia sobre los costos finales pero es independiente del control local. V2 Bajo nivel de asociatividad y organización rural Problema Crítico (Variable Central) Presenta alta influencia y alta dependencia; es el eje motriz donde se debe intervenir. V3 Dependencia de intermediarios comerciales locales Variable Activa (Causa) Factor determinante que reduce directamente el margen de ganancia del campesino. V4 Bajos ingresos económicos de las familias agricultoras Variable Pasiva (Efecto) Consecuencia directa de la baja asociatividad y la intermediación comercial. V5 Migración de jóvenes y abandono generacional del campo Variable Pasiva (Efecto) Impacto social a largo plazo derivado de la escasa rentabilidad de la actividad agrícola. que sea toda en español, se puede?