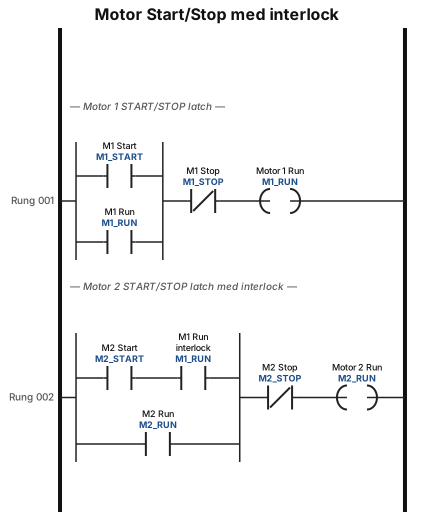
2 motorer betjenes fra hver sin START-STOP kontakt. Motor nummer 2 må kun kunne starte, når motor nummer I kører. Hvis motor nummer I stoppes, skal motor nummer 2 kunne køre videre.
NODE ARCHIVE · REAL DIAGRAM BRIEFS
Diagram Examples from Real Visitor Prompts
Browse eligible diagrams shared by FreeDiagram visitors, inspect the exact prompts, and build your own version.
Browse 1014 real creationsCOMMUNITY OUTPUTS · EXACT PROMPTS
Main diagram studio
Showing 1–24 of 606. No stock examples or system defaults. Choose a tool, study a real result, then reopen its prompt as your starting point.
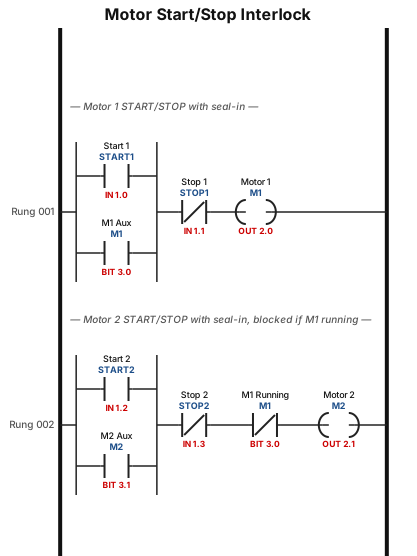
Kan du lave et ladderdiargram ud fra dette?:2 motorer betjenes fra hver sin START-STOP kontakt. Hvis motor nr. 1 startes først, må motor nr. 2 ikke kunne startes. Hvis motor nr. 2 startes først, skal motor nr. 1 kunne startes derefter, uden at udkoble motor nr. 2.
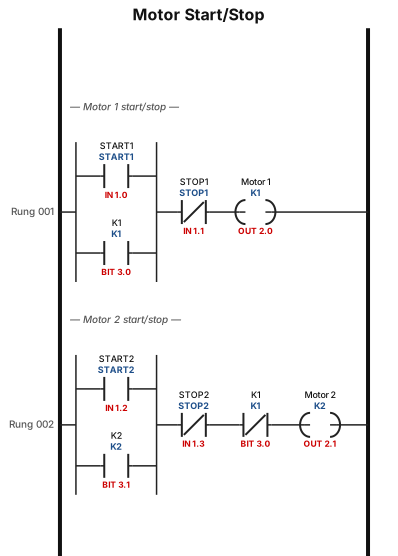
2 motorer betjenes fra hver sin START-STOP kontakt. Hvis motor nr. 1 startes først, må motor nr. 2 ikke kunne startes. Hvis motor nr. 2 startes først, skal motor nr. 1 kunne startes derefter, uden at udkoble motor nr. 2.
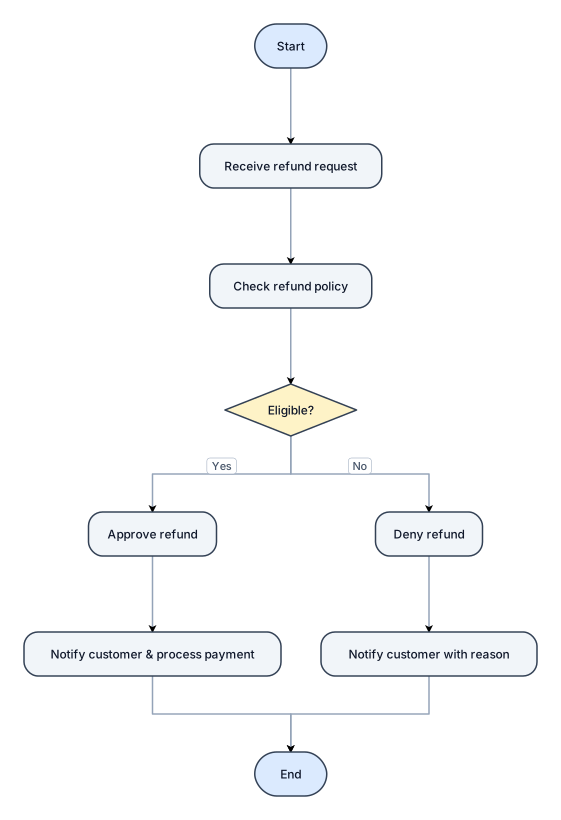
A flowchart for handling a customer refund request, with approve and deny paths
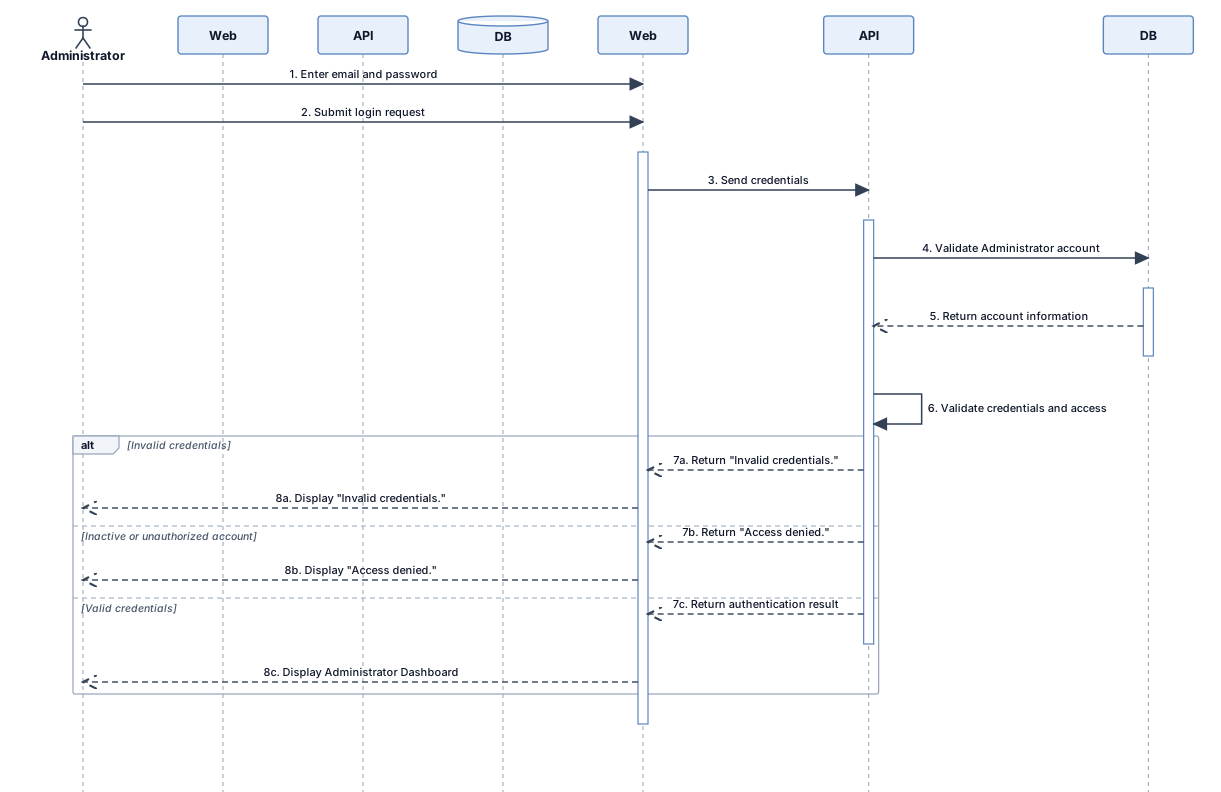
Create **SD-01 Administrator Authentication** as a UML Sequence Diagram for the **Church Management Information System (CMIS)**. Use the **attached instructor reference image** as the guide for the diagram layout, UML structure, spacing, numbering, lifelines, activation bars, and overall academic appearance. Keep it clean and compact. **Actor:** Administrator **Participants:** * Administrator * Administrator Web Platform * CMIS API * tbl_users **Flow:** 1. Administrator enters email and password. 2. Administrator submits the login request. 3. Administrator Web Platform sends the credentials to the CMIS API. 4. CMIS API validates the Administrator account using tbl_users. 5. tbl_users returns the account information. 6. CMIS API validates the credentials and Administrator access. 7. CMIS API returns the authentication result. 8. Administrator Web Platform displays the Administrator Dashboard. **Alternative flows:** * Invalid credentials → display “Invalid credentials.” * Inactive or unauthorized account → display “Access denied.” Follow the instructor reference and represent this flow as a proper UML sequence diagram. Do not make the diagram unnecessarily complex.

Create a SIMPLE, CLEAN, PROFESSIONAL flowchart titled: **“ANNAPRAJÑA – How the System Works”** Use only 16–18 shapes. Flow: START / POWER ON ↓ SYSTEM SELF-CHECK ↓ AUTOMATIC CAMERA MAST DEPLOYMENT ↓ CAMERA & LIGHTING CALIBRATION ↓ TILT / LEVEL CHECK ↓ PLACE FOOD ↓ MEASURE FOOD WEIGHT ↓ CAPTURE FOOD IMAGE ↓ OPENROUTER API ↓ GEMINI AI ANALYSIS ↓ FOOD IDENTIFICATION + AI PORTION/WEIGHT ESTIMATION ↓ NUTRITION CALCULATION ↓ FINAL VALIDATION ↓ DISPLAY NUTRITION RESULT ↓ ANALYZE ANOTHER FOOD? YES → return to PLACE FOOD NO → FOLD CAMERA MAST ↓ END Use one diamond only for: “Analyze another food?” Use simple rounded rectangles for all other steps. Do NOT add individual shapes for sensors, wires, motors, limit switches, API internals, calibration substeps, error handling, or individual nutrients. Keep the diagram visually simple, spacious, readable, and suitable for a school Innovation Cell presentation. Use a modern technical style with minimal colours and clear arrows. The entire diagram should be understandable in less than 10 seconds.

Create a 3-level SCI Q1 journal-quality hierarchy diagram. Top Level: Environmental Sustainability Criteria Main Criteria: GHG (Greenhouse Gas) Emissions (C1) Energy (C2) Waste (C3) Water (C4) Workplaces & Ecosystems (C5) Management (C6) Subcriteria: C1 → Emissions Inventory Reporting (C11); Operational Emissions Reduction and Compensation (C12); Decarbonizing the Supply Chain (C13) C2 → Reducing Energy Consumption (C21); Energy Efficiency (C22); Renewable Energy Integration (C23) C3 → Effective Waste Diversion (C31); Data Center Hardware (C32) C4 → Water Consumption for Resource Conservation (C41); Water Discharge (C42) C5 → Green Building Certifications (C51); Sustainable Commuting Infrastructure (C52) C6 → ISO 14001 (Environmental Management System) Compliance (C61); ISO 50001 (Energy Management System) Compliance (C62)

Create a 3-level SCI Q1 journal-quality hierarchy diagram. Top Level: Environmental Sustainability Criteria Main Criteria: GHG (Greenhouse Gas) Emissions (C1) Energy (C2) Waste (C3) Water (C4) Workplaces & Ecosystems (C5) Management (C6) Subcriteria: C1 → Emissions Inventory Reporting (C11); Operational Emissions Reduction and Compensation (C12); Decarbonizing the Supply Chain (C13) C2 → Reducing Energy Consumption (C21); Energy Efficiency (C22); Renewable Energy Integration (C23) C3 → Effective Waste Diversion (C31); Data Center Hardware (C32) C4 → Water Consumption for Resource Conservation (C41); Water Discharge (C42) C5 → Green Building Certifications (C51); Sustainable Commuting Infrastructure (C52) C6 → ISO 14001 (Environmental Management System) Compliance (C61); ISO 50001 (Energy Management System) Compliance (C62)

Create a 3-level SCI Q1 journal-quality hierarchy diagram. Top Level: Environmental Sustainability Criteria Main Criteria: GHG (Greenhouse Gas) Emissions (C1) Energy (C2) Waste (C3) Water (C4) Workplaces & Ecosystems (C5) Management (C6) Subcriteria: C1 → Emissions Inventory Reporting (C11); Operational Emissions Reduction and Compensation (C12); Decarbonizing the Supply Chain (C13) C2 → Reducing Energy Consumption (C21); Energy Efficiency (C22); Renewable Energy Integration (C23) C3 → Effective Waste Diversion (C31); Data Center Hardware (C32) C4 → Water Consumption for Resource Conservation (C41); Water Discharge (C42) C5 → Green Building Certifications (C51); Sustainable Commuting Infrastructure (C52) C6 → ISO 14001 (Environmental Management System) Compliance (C61); ISO 50001 (Energy Management System) Compliance (C62) Preserve all names and codes exactly. Place each code after its criterion name in parentheses, as shown above. Use a clean, symmetrical academic vector design suitable for an SCI Q1 journal: rounded pastel boxes, thin aligned connectors, white background, Arial/Helvetica font, centered text, equal spacing, and readable typography. Optimize the layout for readability across an A4 journal page.
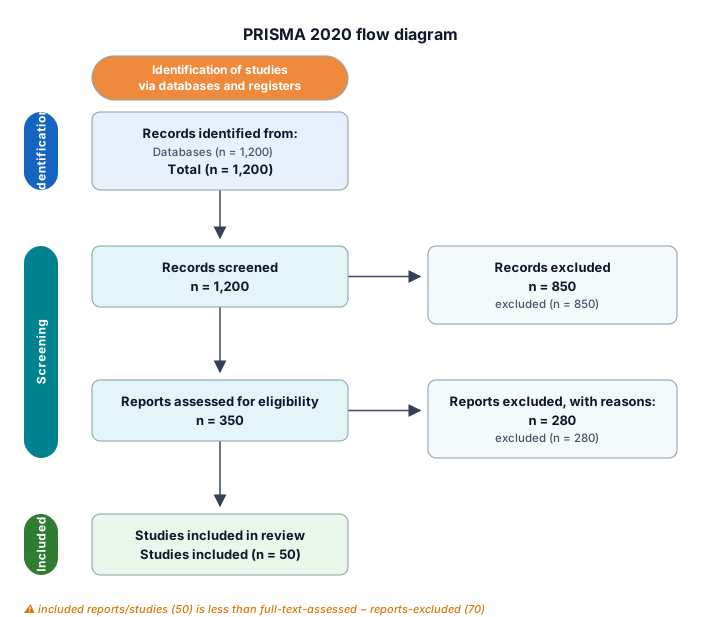
prısma diagram.
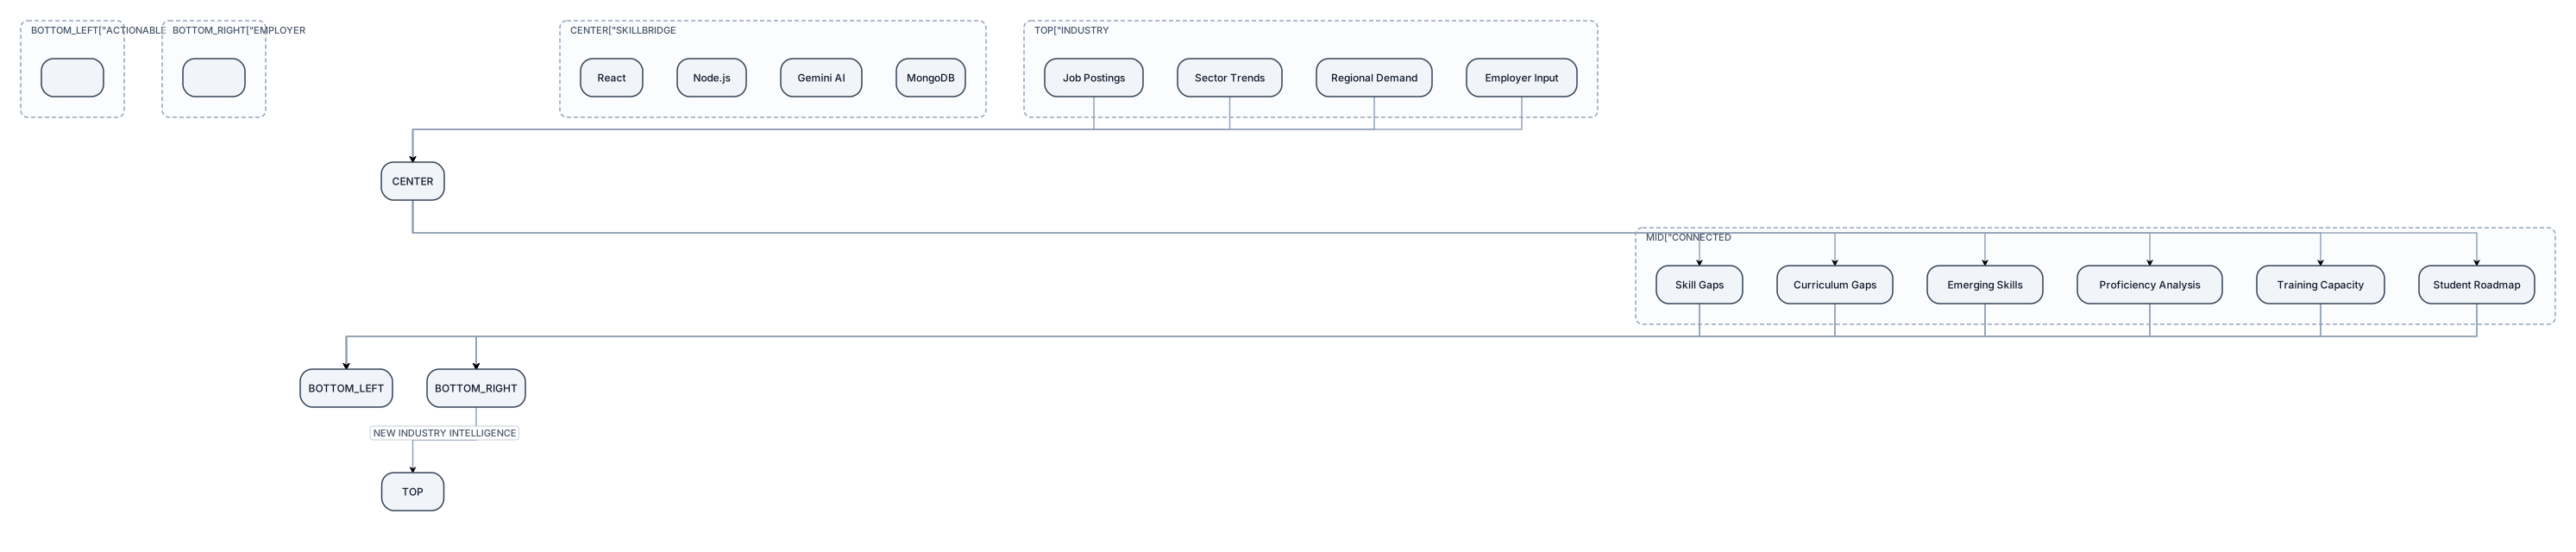
Create a professional 16:9 system architecture flowchart for “SkillBridge AI”. Follow this EXACT visual structure: 1. TOP — a wide horizontal container titled: “INDUSTRY & WORKFORCE SIGNALS” Inside it, place 4 equal boxes in ONE ROW: Job Postings | Sector Trends | Regional Demand | Employer Input All 4 boxes connect downward to the next section. 2. CENTER — a large horizontal box titled: “SKILLBRIDGE AI” Subtitle: “AI-Powered Skill & Labour-Market Intelligence” Inside the lower part of this box show: React | Node.js | Gemini AI | MongoDB 3. BELOW — a wide horizontal container titled: “CONNECTED WORKFORCE INTELLIGENCE” Inside it, place 6 equal boxes in ONE ROW: Skill Gaps | Curriculum Gaps | Emerging Skills | Proficiency Analysis | Training Capacity | Student Roadmap 4. BELOW THIS — create TWO separate dark-blue boxes SIDE BY SIDE: Left: “ACTIONABLE WORKFORCE OUTCOMES” Right: “EMPLOYER & PLACEMENT FEEDBACK” Connect the intelligence section to both boxes. 5. CLOSED FEEDBACK LOOP: From “EMPLOYER & PLACEMENT FEEDBACK”, draw an arrow to the right side. Add a small label: “NEW INDUSTRY INTELLIGENCE” Then draw the arrow upward and back into: “INDUSTRY & WORKFORCE SIGNALS” The complete flow must be: INDUSTRY & WORKFORCE SIGNALS ↓ SKILLBRIDGE AI ↓ CONNECTED WORKFORCE INTELLIGENCE ↓ ACTIONABLE WORKFORCE OUTCOMES + EMPLOYER & PLACEMENT FEEDBACK ↓ NEW INDUSTRY INTELLIGENCE ↺ INDUSTRY & WORKFORCE SIGNALS STYLE: - Clean professional SIH presentation - White background - Navy blue / medium blue - Thin straight connector lines - Rounded rectangular boxes - Simple professional icons - Symmetrical alignment - Lots of clean whitespace - 16:9 landscape - Vector-style, sharp and readable - No mind map - No 3D - No gradients - No neon - No glassmorphism - No decorative graphics - No extra text - Keep all text exactly as provided
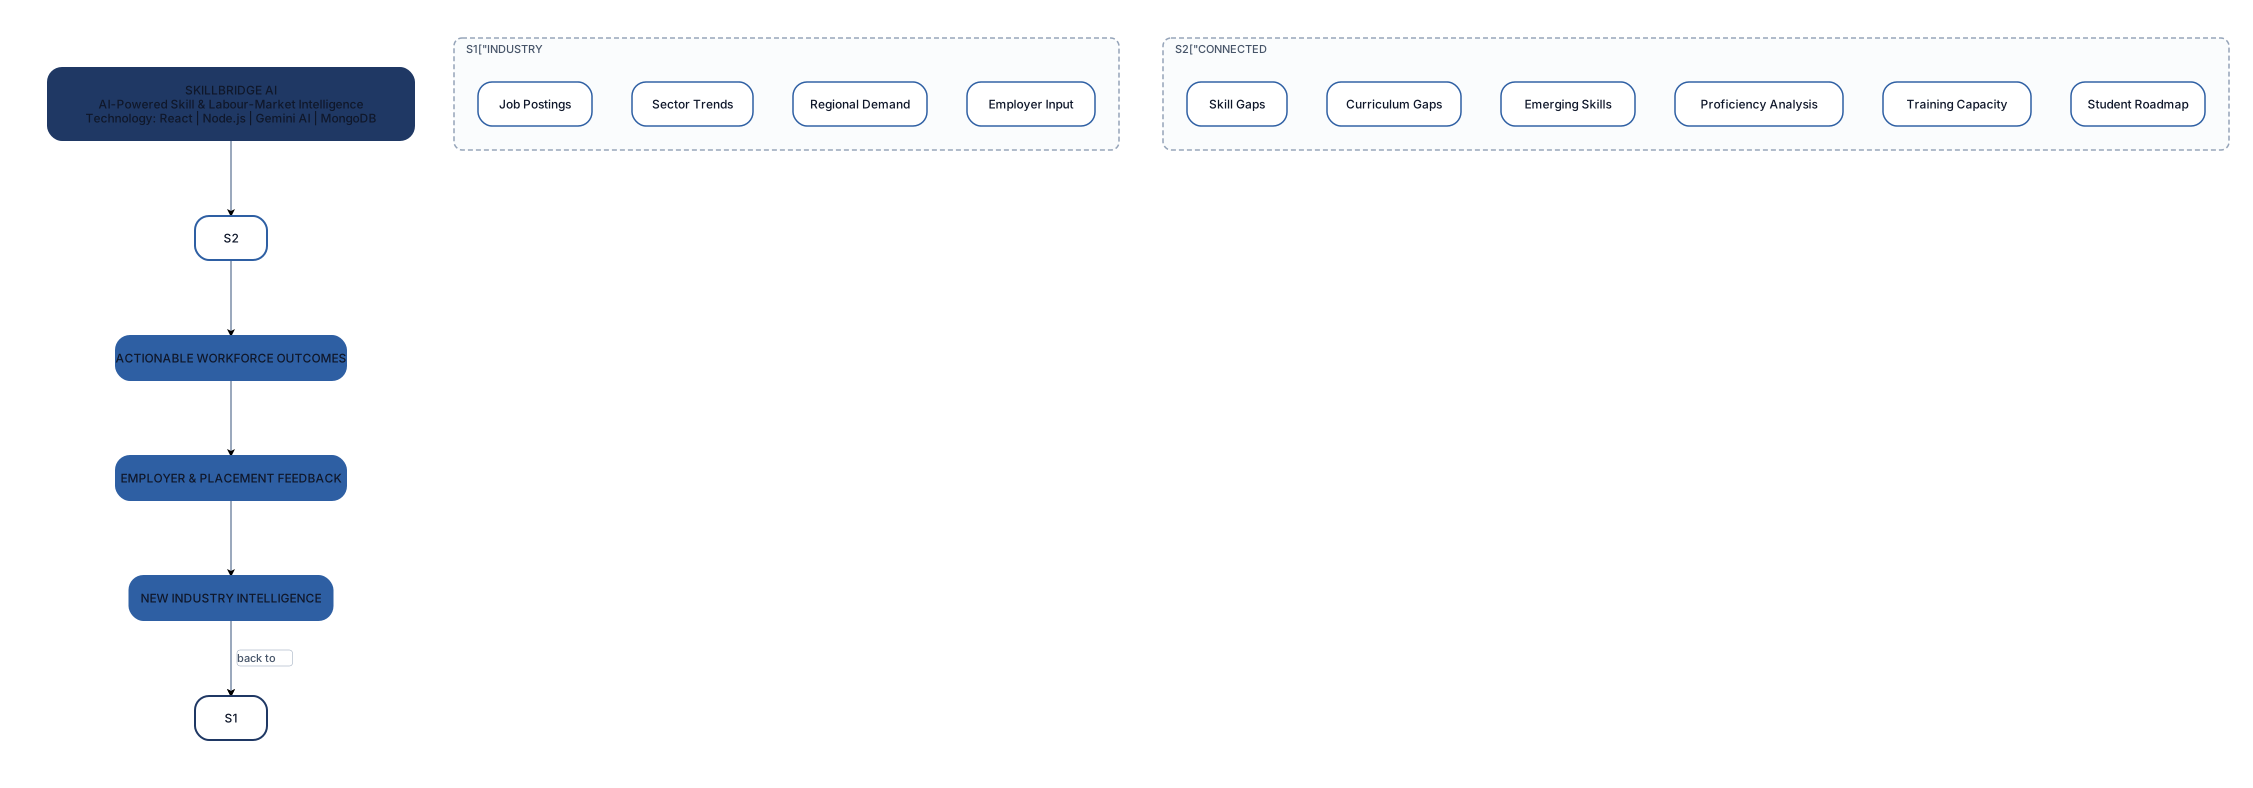
Create a professional 16:9 system architecture flowchart for a Smart India Hackathon 2026 project called “SkillBridge AI”. Use a clean top-to-bottom architecture, NOT a mind map. FLOW: [INDUSTRY & WORKFORCE SIGNALS] | ├── Job Postings ├── Sector Trends ├── Regional Demand └── Employer Input | ↓ [SKILLBRIDGE AI] AI-Powered Skill & Labour-Market Intelligence Technology: React | Node.js | Gemini AI | MongoDB | ↓ [CONNECTED WORKFORCE INTELLIGENCE] | ├── Skill Gaps ├── Curriculum Gaps ├── Emerging Skills ├── Proficiency Analysis ├── Training Capacity └── Student Roadmap | ↓ [ACTIONABLE WORKFORCE OUTCOMES] | ↓ [EMPLOYER & PLACEMENT FEEDBACK] | ↓ [NEW INDUSTRY INTELLIGENCE] | └──────────────────────→ back to [INDUSTRY & WORKFORCE SIGNALS] DESIGN REQUIREMENTS: - Clean professional corporate/SIH presentation style - White background - Navy blue and medium blue accents - Rectangular rounded boxes - Thin clean connector arrows - Clear hierarchy and spacing - Use simple professional icons where appropriate - 16:9 landscape - Vector/editable diagram - Exact readable text - No blurry text - No gradients - No neon - No glassmorphism - No 3D - No decorative illustrations - No stock photos - No unnecessary elements IMPORTANT: The feedback loop must clearly show: Industry Signals → SkillBridge AI → Workforce Intelligence → Action → Employer Feedback → New Industry Intelligence → Industry Signals. Do not merge different sections. Do not turn this into a mind map. Keep all labels exactly as written.
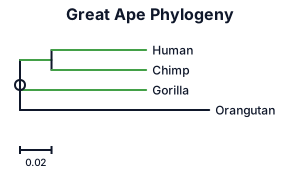
A phylogenetic tree of the great apes showing humans, chimps, gorillas, and orangutans
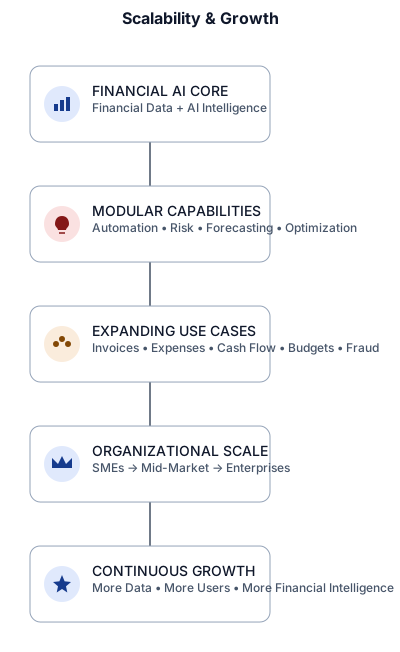
An org chart For SCALABILITY & GROWTH, the flowchart should show how the platform expands from a core financial intelligence system to broader capabilities and larger organizations. Precise flowchart matter FINANCIAL AI CORE Financial Data + AI Intelligence → MODULAR CAPABILITIES Automation • Risk • Forecasting • Optimization → EXPANDING USE CASES Invoices • Expenses • Cash Flow • Budgets • Fraud → ORGANIZATIONAL SCALE SMEs → Mid-Market → Enterprises → CONTINUOUS GROWTH More Data • More Users • More Financial Intelligence with sizes 2.83 height and 5.9 is width in ppt version make sure it cretas correct outlines for the matter and follow the sizes
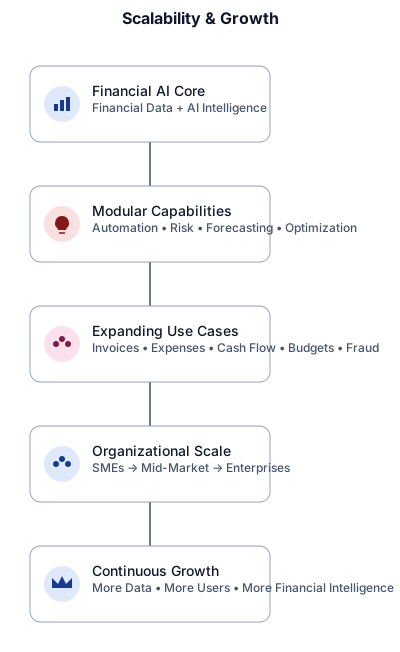
An org chart For SCALABILITY & GROWTH, the flowchart should show how the platform expands from a core financial intelligence system to broader capabilities and larger organizations. Precise flowchart matter FINANCIAL AI CORE Financial Data + AI Intelligence → MODULAR CAPABILITIES Automation • Risk • Forecasting • Optimization → EXPANDING USE CASES Invoices • Expenses • Cash Flow • Budgets • Fraud → ORGANIZATIONAL SCALE SMEs → Mid-Market → Enterprises → CONTINUOUS GROWTH More Data • More Users • More Financial Intelligence with sizes 2.83 height and 5.9 is width
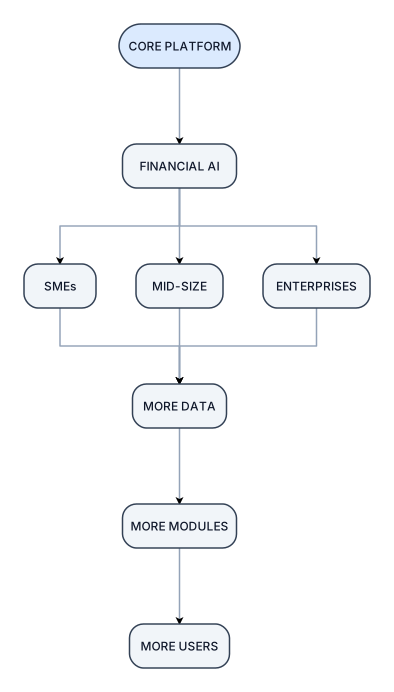
ok lets do another diagram CORE PLATFORM │ ▼ ┌───────────────┐ │ FINANCIAL AI │ └───────┬───────┘ │ ┌──────┼──────┐ ▼ ▼ ▼ SMEs MID-SIZE ENTERPRISES │ │ │ └──────┼──────┘ ▼ MORE DATA • MORE MODULES • MORE USERS this is the basic structure and these are the sizes 2.83 height and 5.9 is width and we have to strictly follow this and based on the given structure create a diagram based on the given flowchart with cool color and smmoth animation for linking the blocks in the flowchart
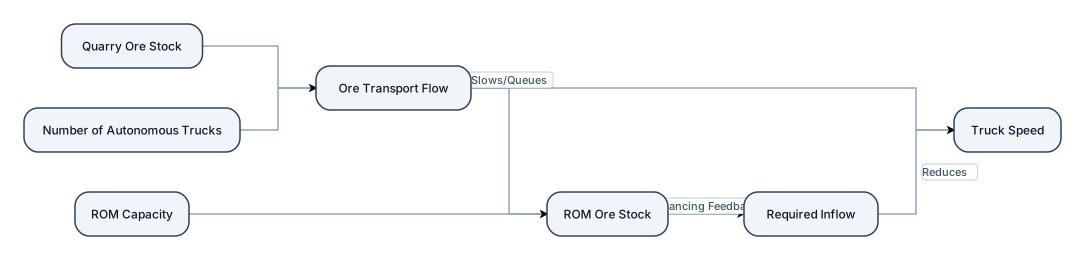
Create an SFD using only simple blocks, arrows, and text. No images, icons, or illustrations. Blocks: Quarry Ore Stock → Ore Transport Flow → ROM Ore Stock Add text boxes for: Number of Autonomous Trucks Truck Speed Required Inflow ROM Capacity Show a balancing feedback loop where increasing ROM stock reduces required inflow, causing trucks to slow/queue and reducing the ore transport flow.
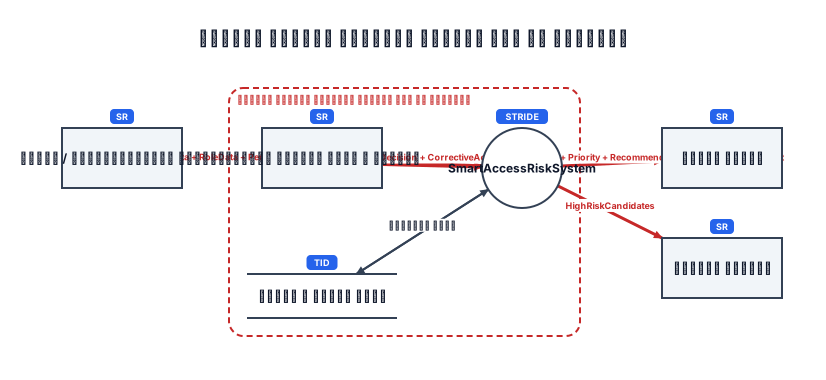
حالا شکل DFD0 پروژه 33 فصل 6 را بصورت PNGمتن زیر با توجه به متنی که قبلا دادی یعنی این : ۶-۶-2. نمودار جریان داده سطح صفر (DFD0) نمودار جریان داده سطح صفر، نمای کلی و سطح بالای سامانه را ارائه میکند و نشان میدهد که سامانه چگونه با موجودیتهای بیرونی ارتباط برقرار میکند. در پروژه ۳۳، فرآیند اصلی میتواند به صورت سامانه هوشمند ارزیابی دسترسی امن به اطلاعات تعریف شود. در این سطح، جزئیات داخلی الگوریتم یا مراحل مختلف قیف نمایش داده نمیشوند؛ بلکه هدف، مشخص کردن ورودیهای اصلی، خروجیهای اصلی و ارتباط سامانه با محیط بیرونی است. موجودیتهای بیرونی اصلی عبارتاند از: کاربر یا درخواستکننده دسترسی؛ مسئول امنیت؛ سامانه دیریت هویت و دسترسی؛ منابع و مخازن داده؛ ارزیاب انسانی. دادههای ورودی اصلی عبارتاند از: UserData + RoleData + PermissionData + ResourceData + AccessData + ContextData و خروجیهای اصلی عبارتاند از: RiskLevel+RiskExplanation+Priority+Recommendation+ManagementReportRiskLevel+ RiskExplanation+ Priority+ Recommendation+ ManagementReport در این سطح، سامانه باید نشان دهد که چگونه دادههای دسترسی را دریافت کرده و پس از تحلیل، نتیجهای قابل استفاده برای کنترل دسترسی تولید میکند. جریان اصلی ریسک AccessData → RiskAssessment → RiskLevel دادههای دسترسی ارزیابی میشوند و در نهایت سطح ریسک دسترسی تعیین میشود. جریان اصلی قیف AccessData → AccessFunnel → HighRiskCandidates ادههای دسترسی از قیف تحلیل عبور میکنند و دسترسیهای پرریسک برای بررسی و ارزیابی بیشتر شناسایی میشوند. جریان اصلی هوشمندی HighRiskCandidates → IntelligentAnalysis → RiskClassification → Decision موارد پرریسک با تحلیل هوشمند بررسی، سطح ریسک آنها طبقهبندی و سپس تصمیم امنیتی مناسب اتخاذ میشود. جریان ترکیبی DFD سطح صفر AccessData → SmartAccessRiskSystem → RiskDecision → CorrectiveAction در این سطح، هدف اصلی نمایش مرز سامانه و ارتباط آن با محیط است؛ جزئیات مربوط به چگونگی انجام هر فرآیند در سطوح یک و دو DFD توسعه داده خواهد شد. بده البته فارسی و ریسک و قیف و هوشمندی DFD0 را برای این پروژه هم داشته باشد
reate a professional 16:9 executive manufacturing diagram. Show Production and Engineering as two equal teams working together, with their existing reporting structures remaining unchanged. Put "Shared Manufacturing Priorities" between them with a bidirectional connection. Above Production show Director of Operations; above Engineering show Engineering Director. Around the shared priorities show four priorities: Safety, Quality, Customer/Production Commitments, and Continuous Improvement. Below show the process: Identify Issue → Assess Business & Technical Impact → Agree Priority → Assign Owner → Set Target Date → Execute → Escalate if Blocked → Close. At the bottom show the outcomes: Visibility, Accountability, Faster Resolution, Better Manufacturing Performance. Use navy blue, manufacturing blue, engineering green, white background, clean corporate style, minimal text, executive leadership presentation quality.

Create a clean professional academic flowchart for a final-year Computer Science project titled "Proposed Methodology / System Architecture" for a "Waste Management Analytics System". Create a single horizontal left-to-right workflow with 7 connected rounded rectangular boxes and clear arrows between them. Box 1: Dataset 300 Records Box 2: Data Preprocessing Clean & Validate Box 3: Data Analysis Waste Quantities Box 4: Performance Indicators Collection, Treatment & Recycling Rates Box 5: Priority Classification High, Medium & Normal Box 6: Streamlit Dashboard Interactive Visualization Box 7: Insights & Visualization Trends, Comparisons & Rule-Based Insights Use a professional university presentation style with a white background, dark blue and teal boxes, clear black or dark text, consistent typography, equal spacing, straight arrows, and a clean academic appearance. Make all text large and highly readable. Keep the diagram simple and uncluttered. Use 16:9 landscape proportions. Do not add any extra boxes, text, icons, statistics, logos, or decorative elements.
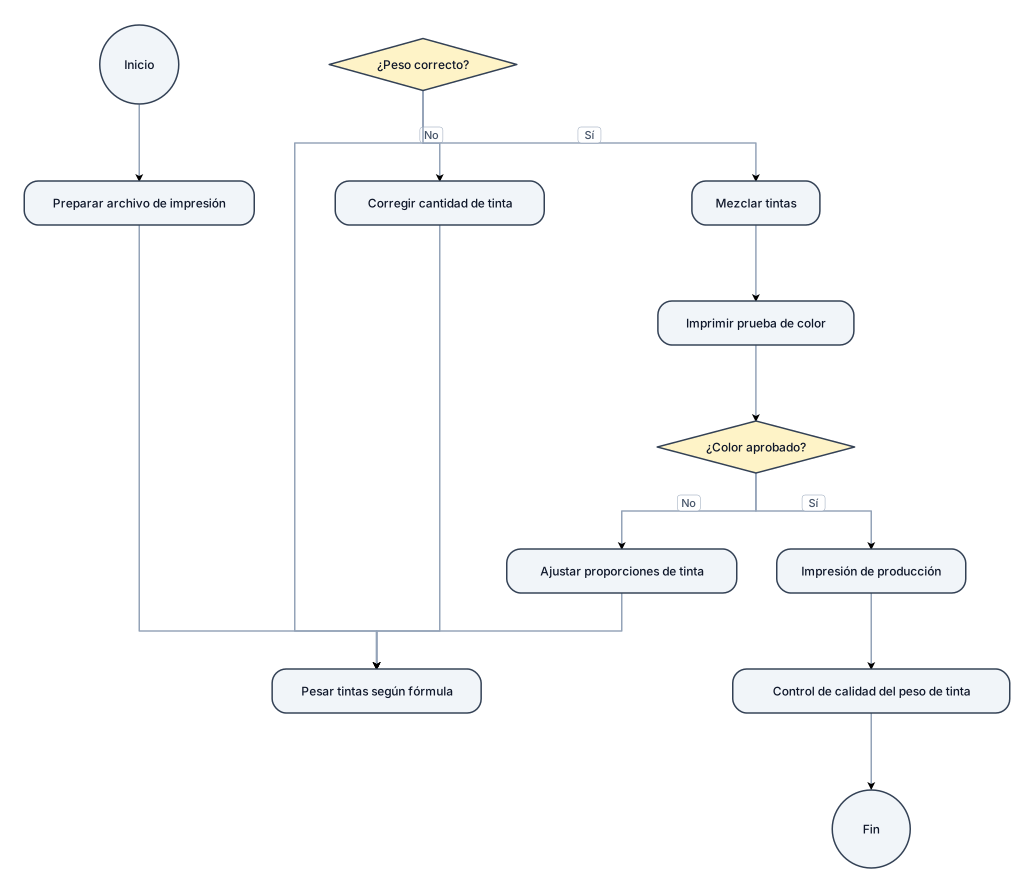
diagrama de flujo para proceso de impresion con peso de tintas
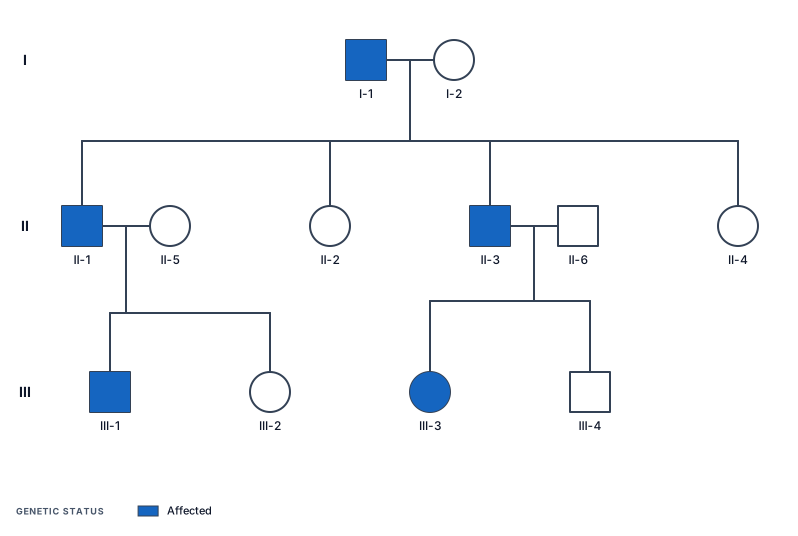
A pedigree chart showing autosomal dominant inheritance across three generations with carrier status

create a entity structure diagram of a full stacked Adaptive Orchestration via Multi-Agent Systems (MAS) a framework that operates on a Bi-Directional Recursive Feedback Loop Layout
a entity mindmap of a full stacked Adaptive Orchestration via Multi-Agent Systems (MAS) a framework that operates on a Bi-Directional Recursive Feedback Loop Layout
Focused examples and prompt ideas
Start with the complete visitor wall above, then use these focused collections when you want a narrower subject and more prompt context.
The first curated collection is being prepared.