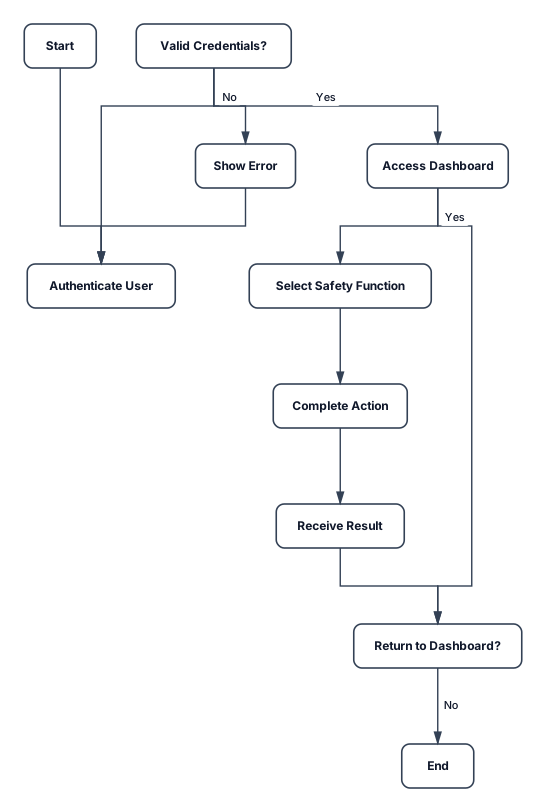
Activity Diagram Shows the workflow from authentication and dashboard access to selecting a safety function, completing the action, receiving a result, and returning to the dashboard.
NODE ARCHIVE · REAL DIAGRAM BRIEFS
Diagram Examples from Real Visitor Prompts
Browse eligible diagrams shared by FreeDiagram visitors, inspect the exact prompts, and build your own version.
Browse 3322 real creationsCOMMUNITY OUTPUTS · EXACT PROMPTS
All visitor creations
Showing 2641–2664 of 3322. No stock examples or system defaults. Choose a tool, study a real result, then reopen its prompt as your starting point.
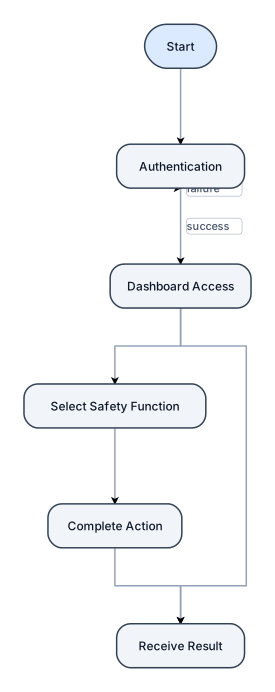
Shows the workflow from authentication and dashboard access to selecting a safety function, completing the action, receiving a result, and returning to the dashboard.
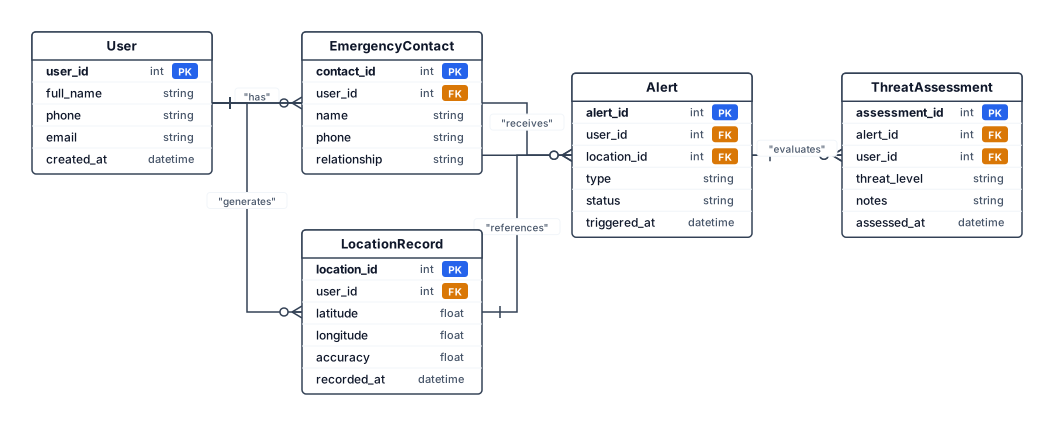
Entity Relationship Diagram Shows logical relationships among core entities such as User, Emergency Contact, Alert, Location Record, and Threat Assessment where implemented.
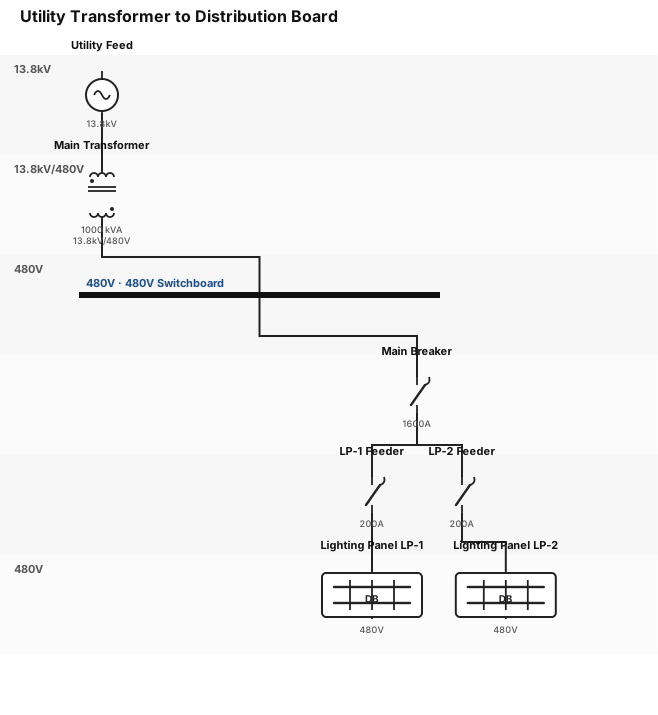
A single-line diagram for a connection from a transformer to a DB: utility feed through a main transformer to a 480V switchboard, then to lighting panels
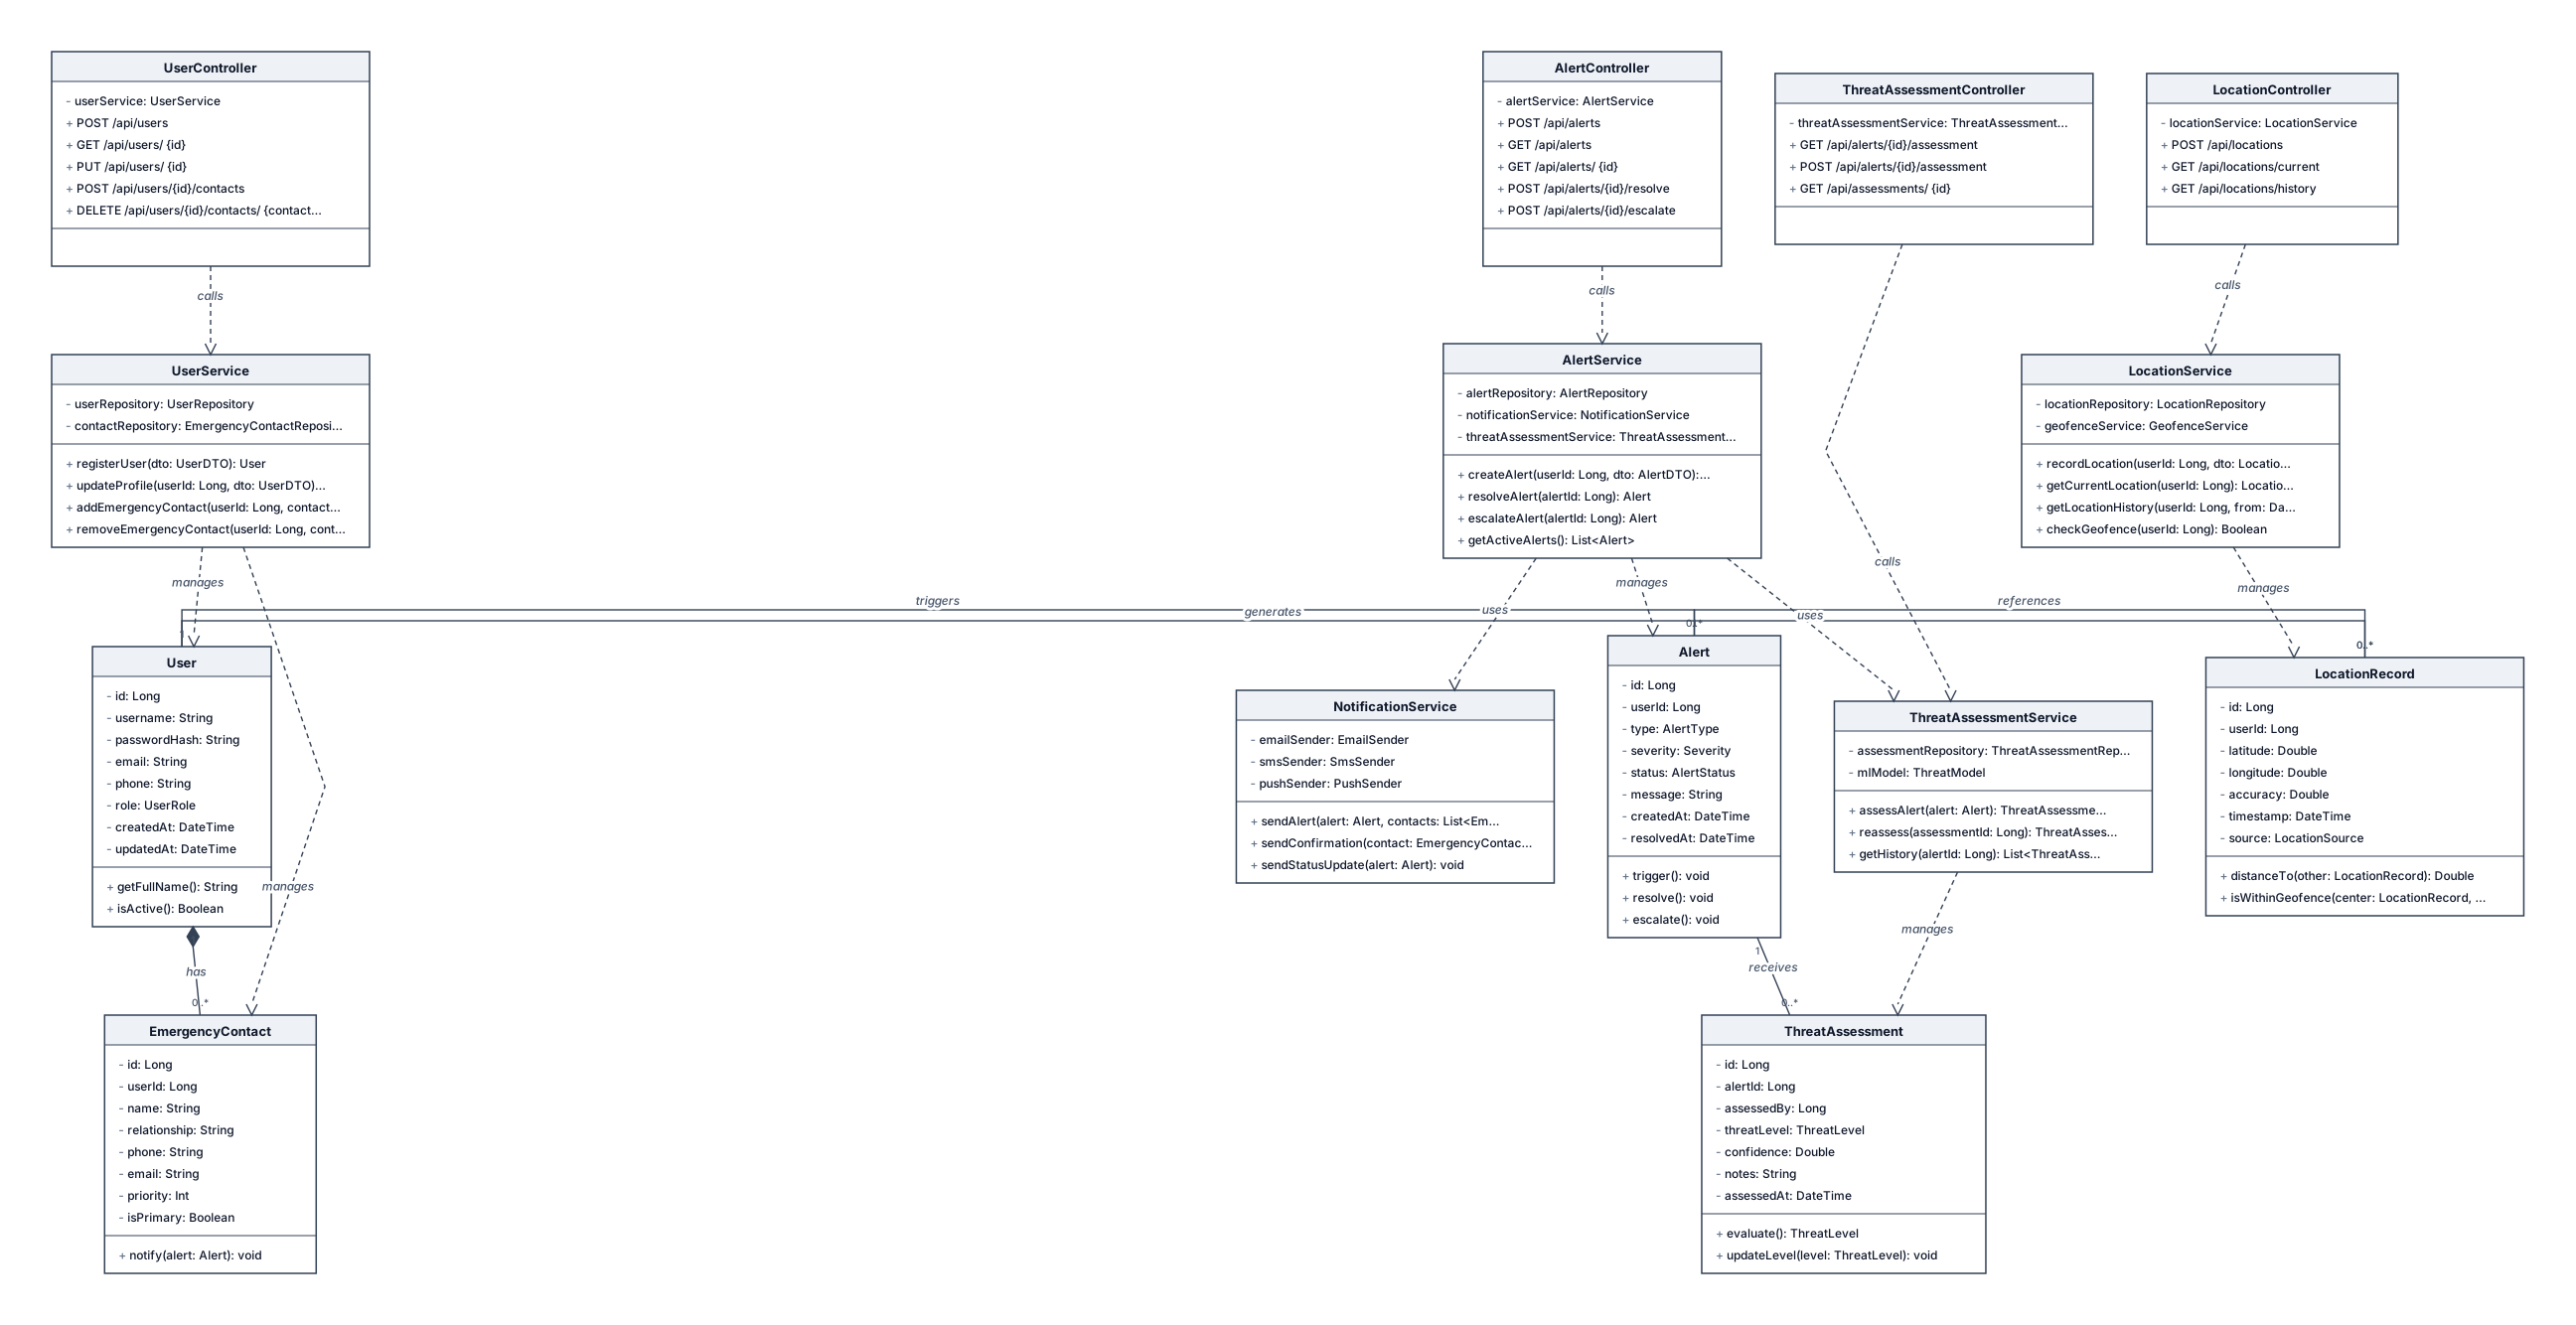
[ INSERT CLASS DIAGRAM HERE ] The final class diagram should be generated from the actual implementation. Typical logical entities may include User, EmergencyContact, Alert, ThreatAssessment, LocationRecord, and related service/controller classes if they exist in the project.
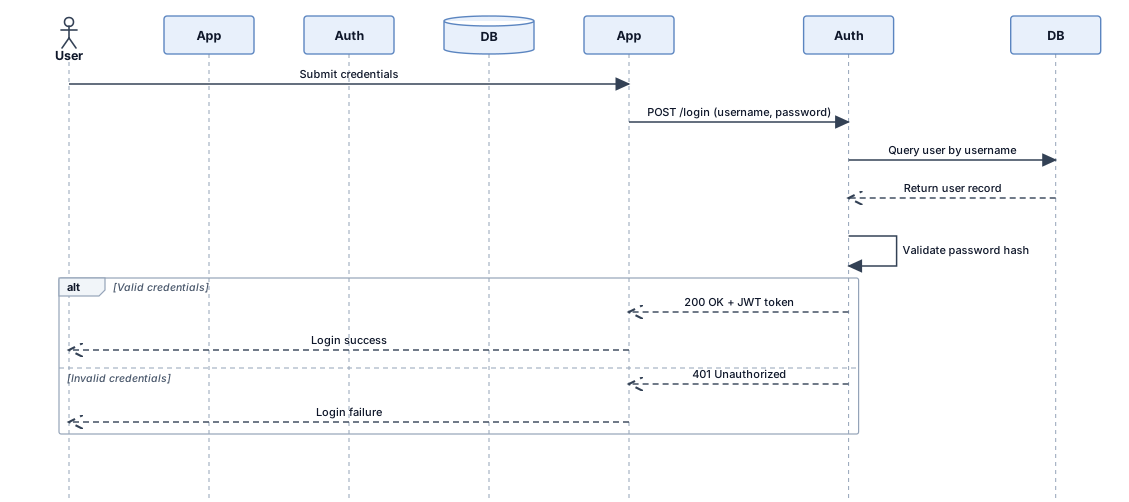
[ INSERT SEQUENCE DIAGRAM HERE ] A sequence diagram can illustrate a login flow: user submits credentials, interface sends a request, authentication logic validates credentials, database is queried, and the system returns success or failure. A second sequence may be prepared for SOS or emergency contact operations.
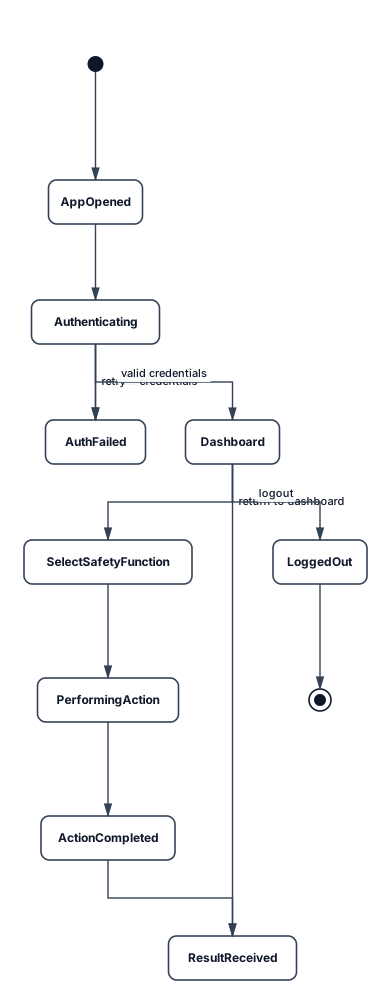
[ INSERT ACTIVITY DIAGRAM HERE ] The activity diagram should represent the user journey from opening the application to authentication, dashboard access, selecting a safety function, completing the action, receiving a result, and returning to the dashboard or logging out.

STAFFING PRESSURES 3 • Absenteeism ↑ 8% → 21% 4 • Turnover ↑ 15% → 23% 5 • Vacancy Rate ↑ 21% 6 • Understaffed shifts 7 ──────────────────────╲ 8 9 ╲ 10 11 FATIGUE & COGNITIVE ╲ 12 OVERLOAD ╲ 13 • High workload ╲ 14 • Interruptions ╲ 15 • Multitasking ╲ 16 • Reduced concentration ╲ 17 ──────────────────────────────╲ 18 19 ╲ 20 ╲ 21 ╲ 22 ► INCREASE IN 23 MEDICATION ERRORS 24 (4% → 11%) 25 ◄ 26 ╱ 27 ╱ 28 29 CONTINUITY OF CARE ╱ 30 • Part-time staff ↑ ╱ 31 20% → 43% ╱ 32 • More handovers ╱ 33 • Information loss ╱ 34 • Omissions/duplication ╱ 35 ────────────────────────╱ 36 37 COMMUNICATION FAILURES ╱ 38 • Unclear medication ╱ 39 orders ╱ 40 • Prescriber-nurse ╱ 41 communication gaps ╱ 42 • Verbal order errors ╱ 43 ─────────────────────╱ 44 45 PROCESS NON-COMPLIANCE SYSTEMS & TECHNOLOGY 46 • Reduced double-checking • Alert fatigue 47 • Missed safety checks • Complex eMeds systems 48 • Audit compliance ↓ • Duplicate documentation 49 • Administration errors • Workflow inefficiencies 50 ──────────────────────╱ ╲────────────────────────
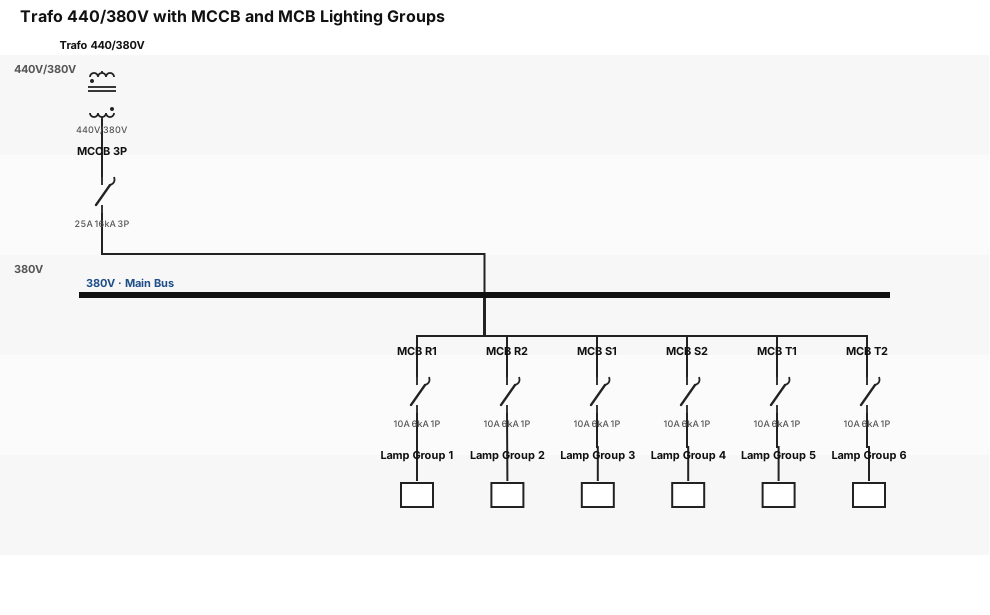
A single-line diagram with trafo 440 to 380 next to MCCB 3pole 25A 16kA, phase R to 2 MCB 1Pole 10A 6kA to lamp grup 1 and grup2 , phase S to 2 MCB 1 Pole 10A 6kA to lamp grup 3 and grup 4, and phase T to 2 mcb 1pole 10A 6kA to lamp grup 5 and grup 6

Indicator DeteriorationPotential Root Cause PathwayMedication errors (4% → 11%)Staffing shortages → Increased workload → Interruptions during medication administration → Increased error rateFalls (0.30% → 0.49%)Reduced staffing availability → Delayed patient surveillance → Missed falls prevention interventionsSurgical site infections (17% → 24%)Workforce pressures → Reduced protocol compliance → Increased infection riskStaphylococcus Aureus infections (0.26 → 0.52)Workload and process variation → Inconsistent infection prevention practicesConsumer complaints (120 → 350)Delays in care and communication → Reduced consumer satisfaction → Increased complaintsComplaints managed within 30 days (95% → 73%)Complaint volume exceeded capacity → Delayed investigation and responseStaff absenteeism (8% → 21%)Burnout and workplace stress → Increased unplanned leaveStaff turnover (15% → 23%)Workload pressures and reduced job satisfaction → Workforce attritionVacancy rate (9% → 21%)Recruitment challenges → Ongoing staffing shortages → Sustained workload pressures

eople (Workforce)ProcessesEnvironment / WorkloadLeadership & GovernanceIncreased staff turnover (15% → 23%)Medication administration processes not consistently followedIncreased patient demand and acuityDelayed response to deteriorating quality indicatorsHigh absenteeism (8% → 21%)Inconsistent falls risk assessment and prevention practicesHigh workload and competing prioritiesInadequate workforce planningIncreased proportion of part-time staff (20% → 43%) resulting in reduced continuity of careDelays in patient review and escalation processesFrequent workflow interruptions and multitaskingLimited monitoring of emerging risksSkill mix and experience variabilityInconsistent handover practicesStaff fatigue and burnoutInsufficient staffing contingency planningPotential reliance on casual/agency staffDelays in complaint management and resolutionIncreased pressure on existing workforce due to vacanciesDelayed implementation of quality improvement initiativesReduced organisational knowledge retentionVariable compliance with infection prevention practicesReduced opportunity for education and trainingLimited visibility of frontline operational challenges

A fishbone diagram analysing why checkout conversion dropped 18% last week: categories for Code, Infrastructure, UX, and Payment
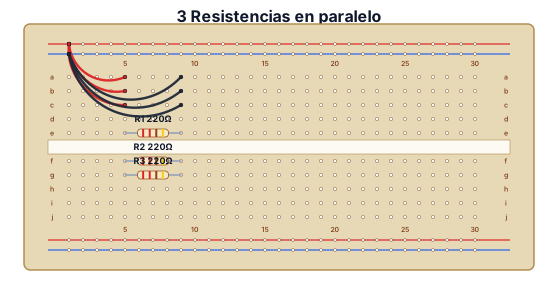
3 Resistencias conectadas en paralelo
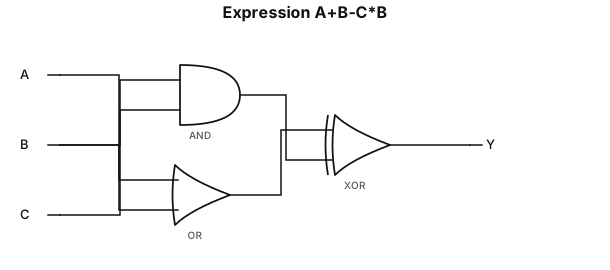
A+B - C * B
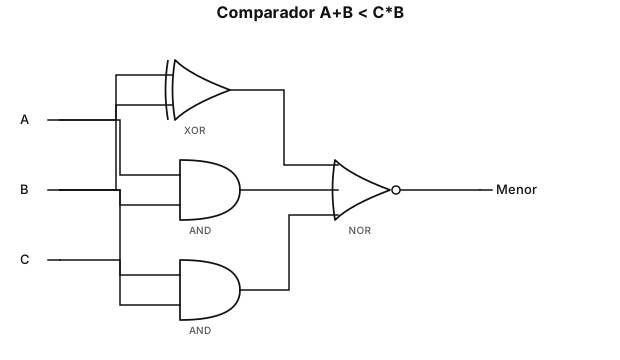
Expresar A+B es menor que C * B
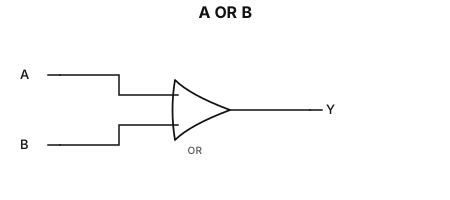
Expresar A+B
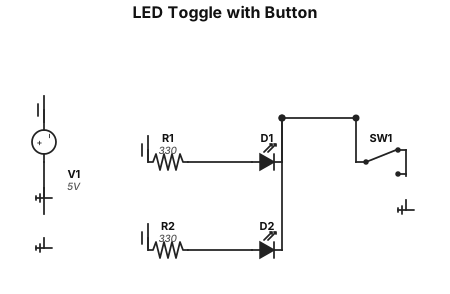
2 LEDs conectadas a un boton que apague uno y encienda el otro
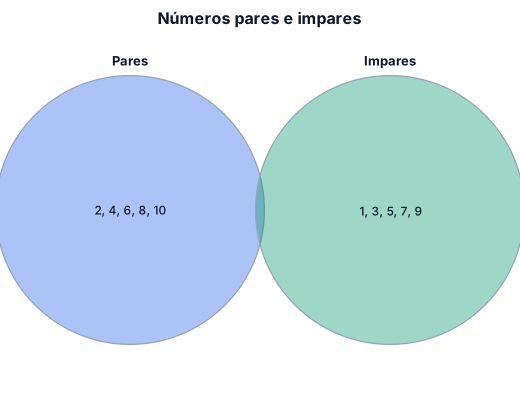
Diagrama de Venn de numeros pares junto a numeros impares
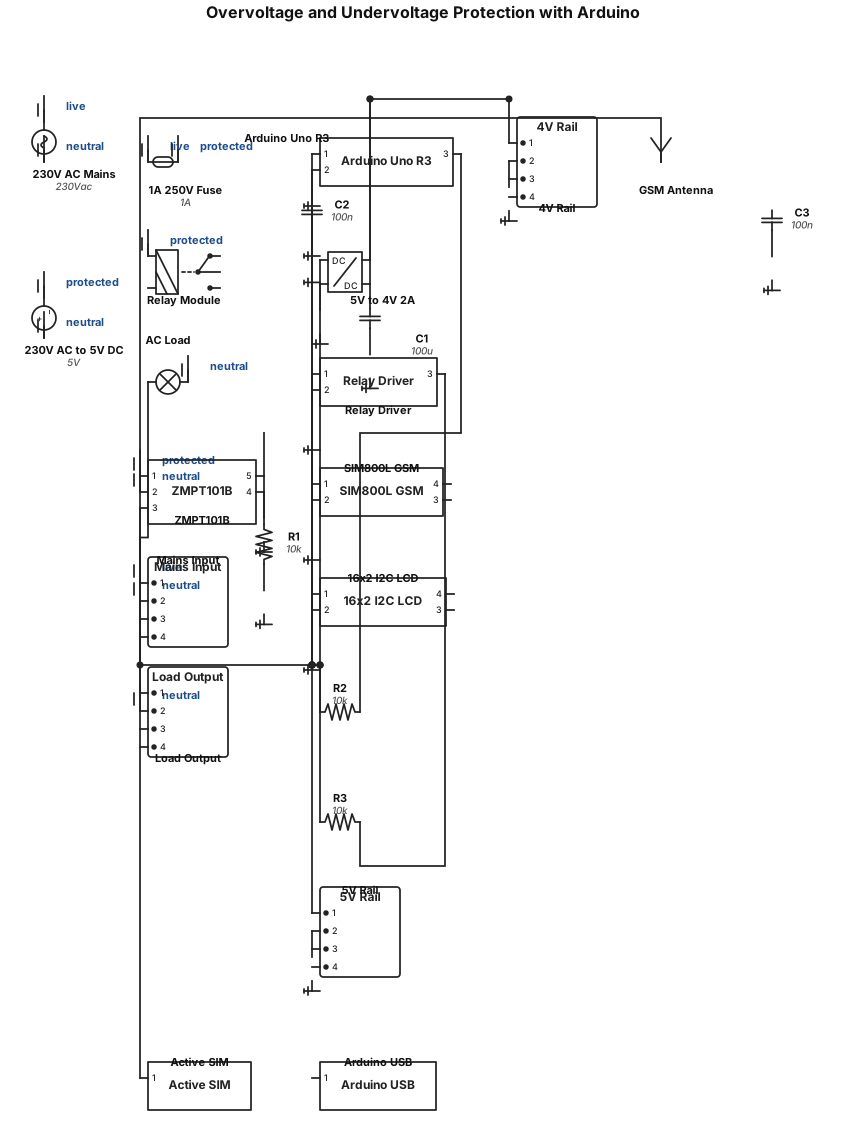
draw an overvoltage and undervoltage protection with these components are Arduino Uno R3, ZMPT101B AC voltage sensor module, 1-channel 5V relay module, SIM800L GSM module, 16×2 I²C LCD display, 230V AC to 5V DC regulated power supply, 5V DC to 4V DC 2A converter, 1A 250V AC fuse, 5×20mm fuse holder, full-size 830-point solderless breadboard, Dupont jumper wires, 230V AC mains input connector, AC appliance/load, AC outlet/load socket, SIM800L GSM antenna, active SIM card, and Arduino USB cable.
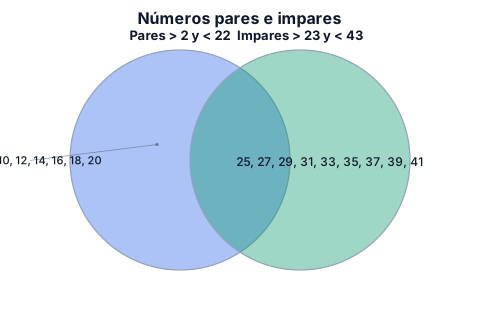
Diagrama de Venn de numeros pares mayores que 2 y menores que 22, junto a numeros impares mayores que 23 y menores que 43
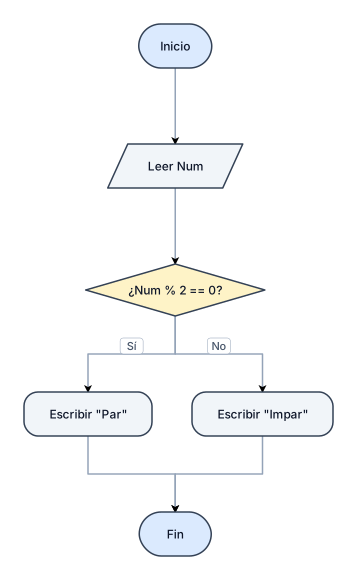
Diagrama de flujo de un programa que lea el valor "Num" y determine si es un numero par y escriba "Par" sino "Impar"
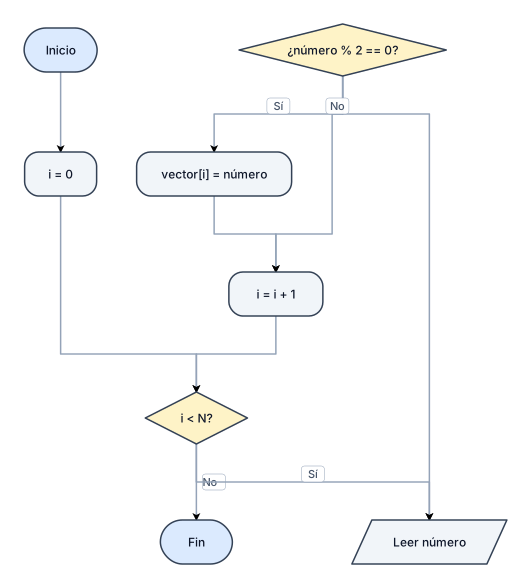
Diagramas de flujo para cargar un vector con numeros pares
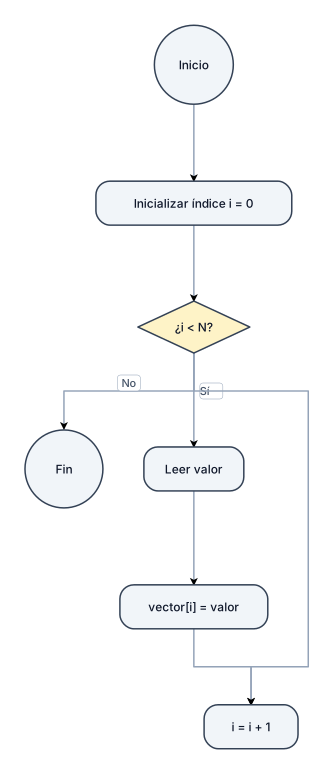
Diagramas de flujo para cargar un vector
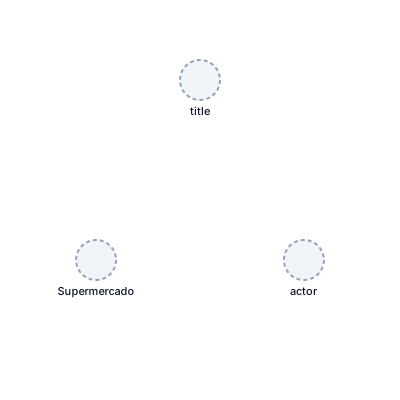
Sociograma sobre el transporte de productos lacteos entre una empresa de Supermercado y una empresa dedicada a la venta de productos vacunos