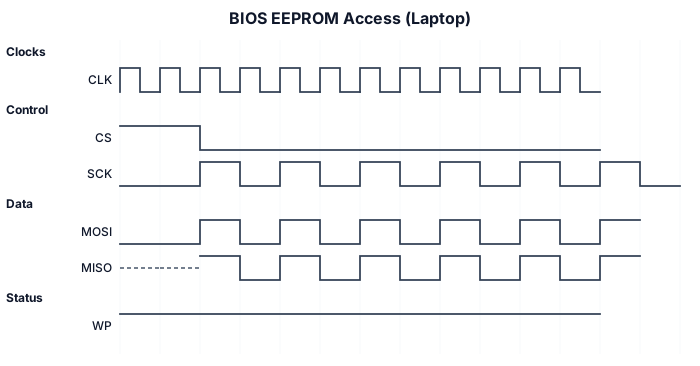
bios eeprom laptop
NODE ARCHIVE · REAL DIAGRAM BRIEFS
Diagram Examples from Real Visitor Prompts
Browse eligible diagrams shared by FreeDiagram visitors, inspect the exact prompts, and build your own version.
Browse 3261 real creationsCOMMUNITY OUTPUTS · EXACT PROMPTS
Timing Diagrams
Showing 25–48 of 77. No stock examples or system defaults. Choose a tool, study a real result, then reopen its prompt as your starting point.

CAN waveform at 500KBPS baud rate, address 0x12, type standard, DLC 2 and data 0xAABB
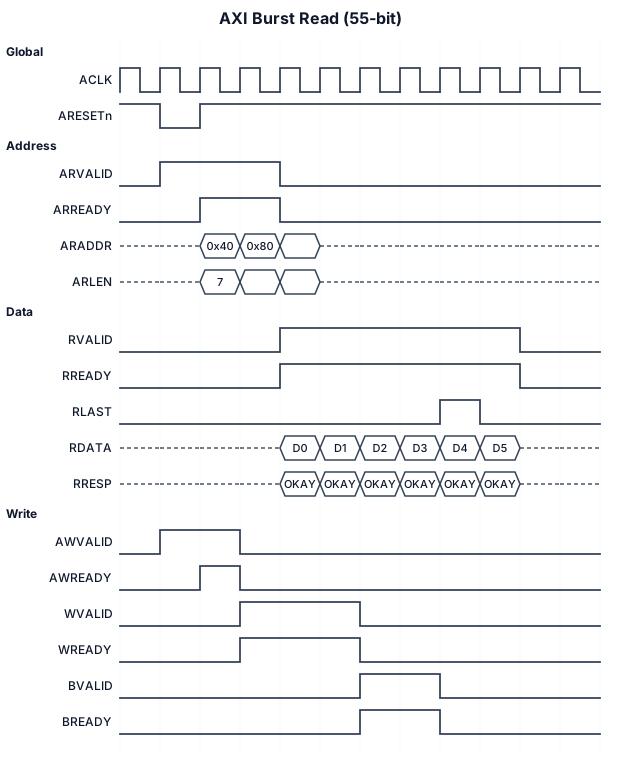
AXI burst 55 bit
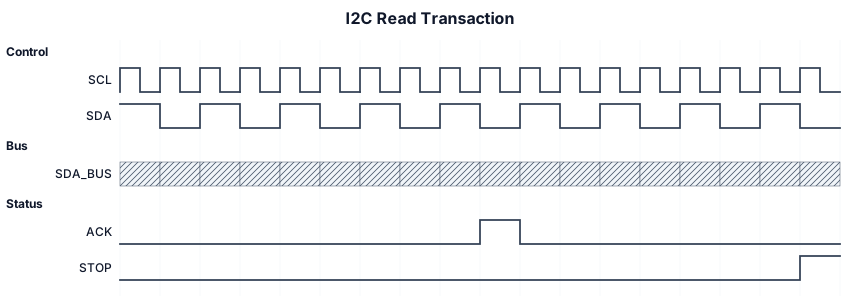
A timing diagram for an I2C read transaction: SCL clock, SDA with START condition, 7-bit address byte, ACK bit, data byte, and STOP condition
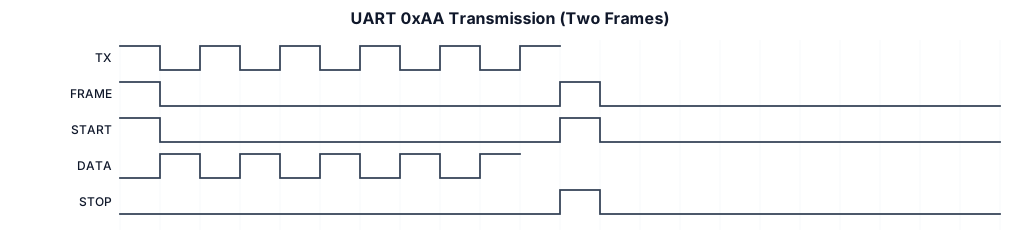
two serial UART 0xAA transmissions with start and stop bits identified
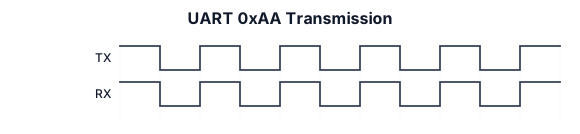
two serial UART 0xAA transmissions
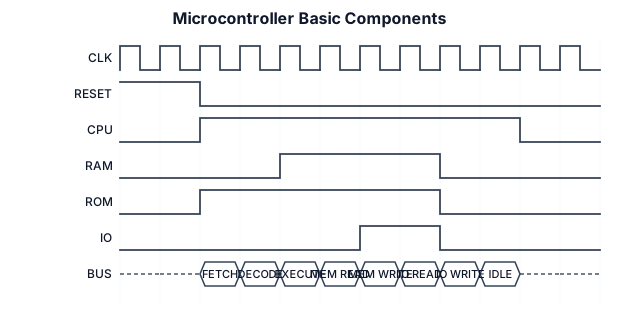
I sketch and label the basic components in a microcontroller
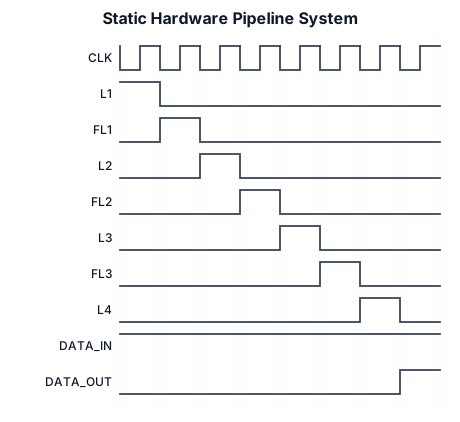
A clean, minimalist engineering schematic diagram of a static hardware pipeline system, on a plain solid white background. The diagram shows a horizontal sequence of four vertical black lines representing latches, labeled from left to right as 'L1', 'L2', 'L3', and 'L4'. Between the latches are rectangular boxes representing functional logic, labeled as 'FL1', 'FL2', and 'FL3'. Horizontal solid black arrows connect the blocks from left to right, showing data flow from 'data in' on the far left to 'data out' on the far right. A thin grey clock signal line labeled 'CLK' runs horizontally beneath the main path, with small inverted clock bubbles triggering the bottom of each latch. At the very bottom, dimension lines with arrows indicate propagation delays for each component precisely aligned vertically: 5ns under L1, 25ns under FL1, 5ns under L2, 30ns under FL2, 5ns under L3, 40ns under FL3, and 5ns under L4. At the top of the image, neat centered text reads: 'L : NGT-Triggered Latch' 'FL : Functional Logic (asynchronous circuit)' The entire image uses crisp vector style, black text, clean sans-serif font, sharp lines, and zero noise or gradient.

• Stage 1 (L1 + FL1): \(5\text{ ns} + 25\text{ ns} = 30\text{ ns}\) • Stage 2 (L2 + FL2): \(5\text{ ns} + 30\text{ ns} = 35\text{ ns}\) • Stage 3 (L3 + FL3): \(5\text{ ns} + 40\text{ ns} = 45\text{ ns}\)
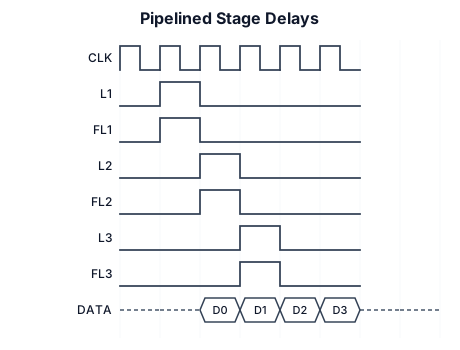
Stage 1 delay: L1 delay (5NS ) FL1 (25NS) Stage 2 delay: L2 delay(5NS) FL2 (30NS) Stage 3 delay: L3 delay (5NS) FL3 (40NS) DATA OUT
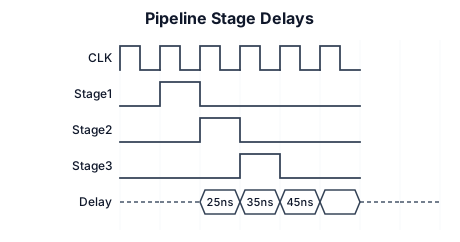
Stage 1 delay: L1 delay (5NS ) FL1 (25NS) Stage 2 delay: L2 delay + FL2 delay = 5 ns + 30 ns = 35 ns Stage 3 delay: L3 delay + FL3 delay = 5 ns + 40 ns = 45 ns (Bottleneck Stage)
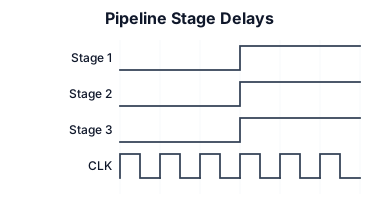
Stage 1 delay: L1 delay + FL1 delay = 5 ns + 25 ns = 30 ns Stage 2 delay: L2 delay + FL2 delay = 5 ns + 30 ns = 35 ns Stage 3 delay: L3 delay + FL3 delay = 5 ns + 40 ns = 45 ns (Bottleneck Stage)

FL1=25 FL2=30 FL3=40

A timing diagram for an I2C read transaction: SCL clock, SDA with START condition, 7-bit address byte, ACK bit, data byte, and STOP condition
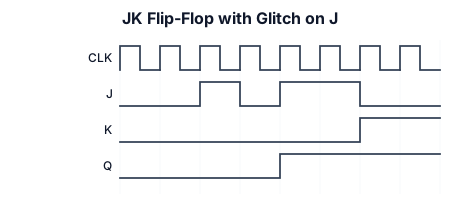
jk with glitch in one side only
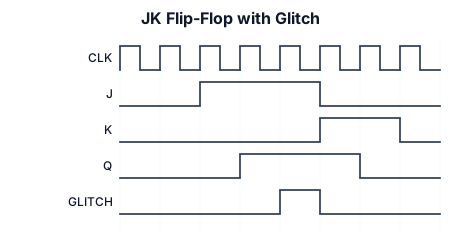
jk with glitch
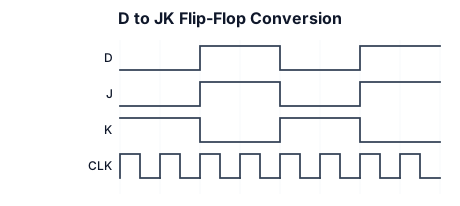
convert d to jk
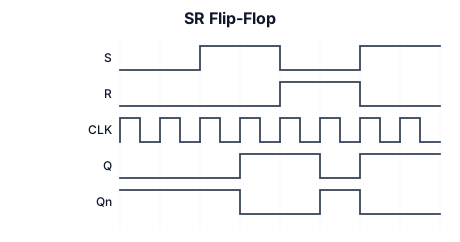
sr flipflop
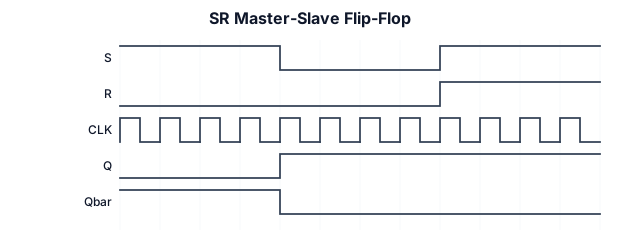
sr master slave flip flop initially s=1,r=0
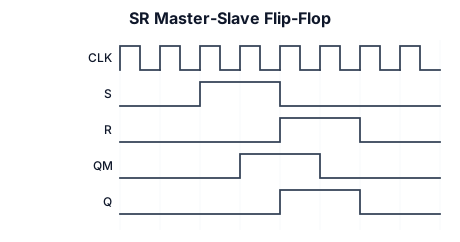
sr master slave flip flop
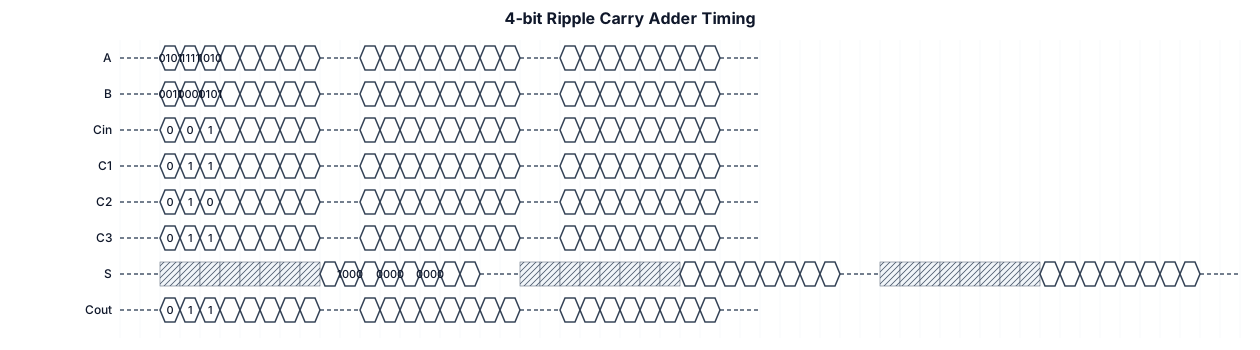
Create a digital timing diagram for a 4-bit ripple carry adder built from 4 full adders (FA0 to FA3). Signals (top to bottom): 1. A[3:0] (input bus) 2. B[3:0] (input bus) 3. Cin (input) 4. C1 (carry out of FA0) 5. C2 (carry out of FA1) 6. C3 (carry out of FA2) 7. S[3:0] (sum output bus) 8. Cout (carry out of FA3) Timing: - Time axis in nanoseconds, 0 to 100 ns. - Each full adder has a propagation delay of 5 ns, so the carry ripples C1 -> C2 -> C3 -> Cout, each 5 ns after the previous one. - The sum bits settle after their carry-in arrives, so S[3:0] is final about 20 ns after the inputs change. - Show the sum bus as "unknown/transitioning" (X or shaded) between the input change and the final settled value. Test cases (inputs change at 0 ns, 30 ns, and 60 ns): - 0 ns: A = 0101 (5), B = 0011 (3), Cin = 0 -> S = 1000 (8), Cout = 0 - 30 ns: A = 1111 (15), B = 0001 (1), Cin = 0 -> S = 0000 (0), Cout = 1 - 60 ns: A = 1010 (10), B = 0101 (5), Cin = 1 -> S = 0000 (0), Cout = 1 Formatting: - Show A, B and S as bus signals with hex/binary labels inside each bus segment. - Show Cin, C1, C2, C3 and Cout as single-bit digital waveforms (high/low). - Add vertical dashed lines at each input change. - Add an arrow or annotation showing the carry propagation delay from C1 to Cout. - Label the total worst-case delay (about 20 ns). - Clean, white background with clear gridlines and labeled signal names on the left.
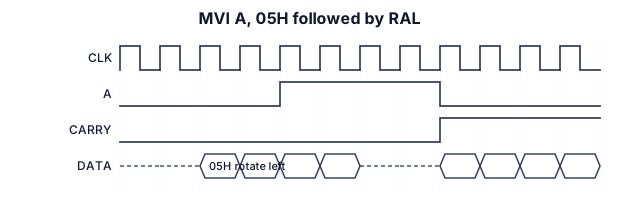
timing diagram of the following set of instructions. MVI A, 05H RAL

A timing diagram for an I2C read transaction: SCL clock, SDA with START condition, 7-bit address byte, ACK bit, data byte, and STOP condition
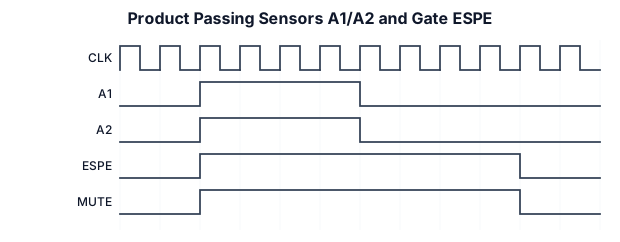
make a sequence/timing diagram showing how a product is moving past sensors A1 and A2 with a small delay, passing through a gate (ESPE) afterwards. as the product is triggering A1 and A2 simultaneously it will cause ESPE to enter a "mute" state. ESPE will retain its "mute" state until the product has passed all the way trhrough, after which it disables the "mute" state.