
An org chart for a 30-person startup with a CEO, CTO, CMO, and VP of Sales at the top — then engineering, product, marketing, and sales teams below with their leads
NODE ARCHIVE · REAL DIAGRAM BRIEFS
Diagram Examples from Real Visitor Prompts
Browse eligible diagrams shared by FreeDiagram visitors, inspect the exact prompts, and build your own version.
Browse 1025 real creationsCOMMUNITY OUTPUTS · EXACT PROMPTS
All visitor creations
Showing 889–912 of 1025. No stock examples or system defaults. Choose a tool, study a real result, then reopen its prompt as your starting point.
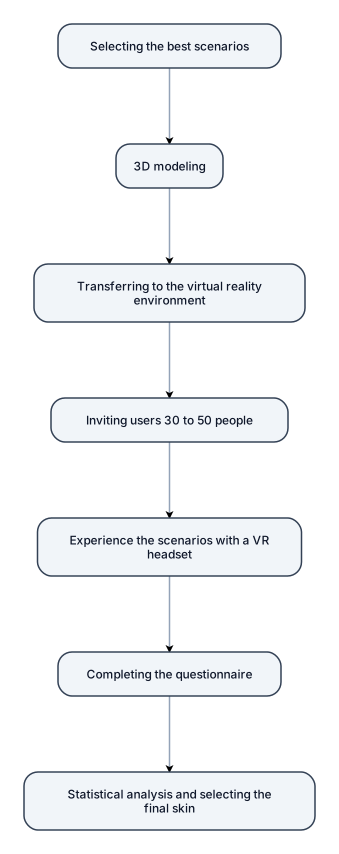
1-Selecting the best scenarios 2-3D modeling 3-Transferring to the virtual reality environment 4-Inviting users (30 to 50 people) 5-Experience the scenarios with a VR headset 6-Completing the questionnaire 7-Statistical analysis and selecting the final skin
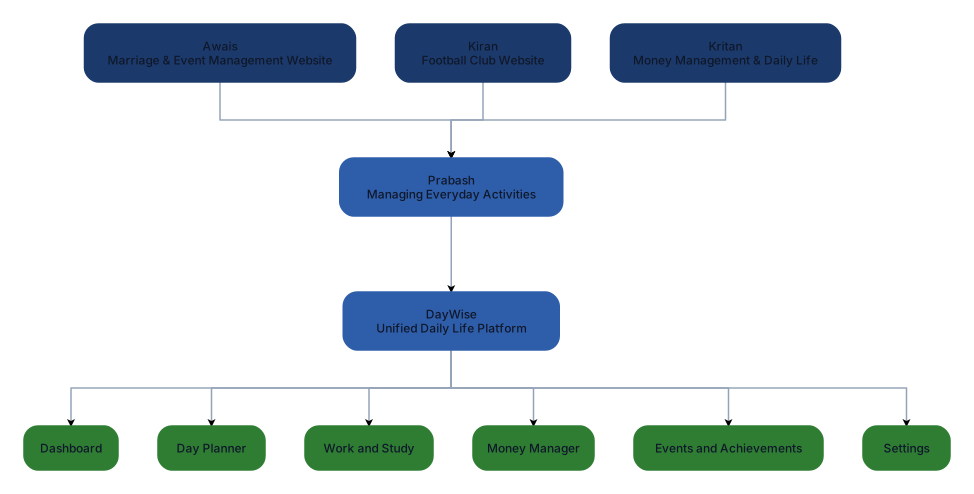
Create a professional academic flowchart showing the development of our DayWise project idea. Start with three team members and their initial ideas. Awais suggested a marriage and event management website. Kiran suggested a football club website for managing football activities and available grounds. Kritan suggested a website focused on money management and daily life. Prabash then combined these ideas with his own idea of managing everyday activities into one platform called DayWise. Show DayWise leading to its main features: Dashboard, Day Planner, Work and Study, Money Manager, Events and Achievements, and Settings. Use simple rounded rectangles, clear arrows, a white background, and navy, blue and green colours. Make it suitable for a university coursework report.
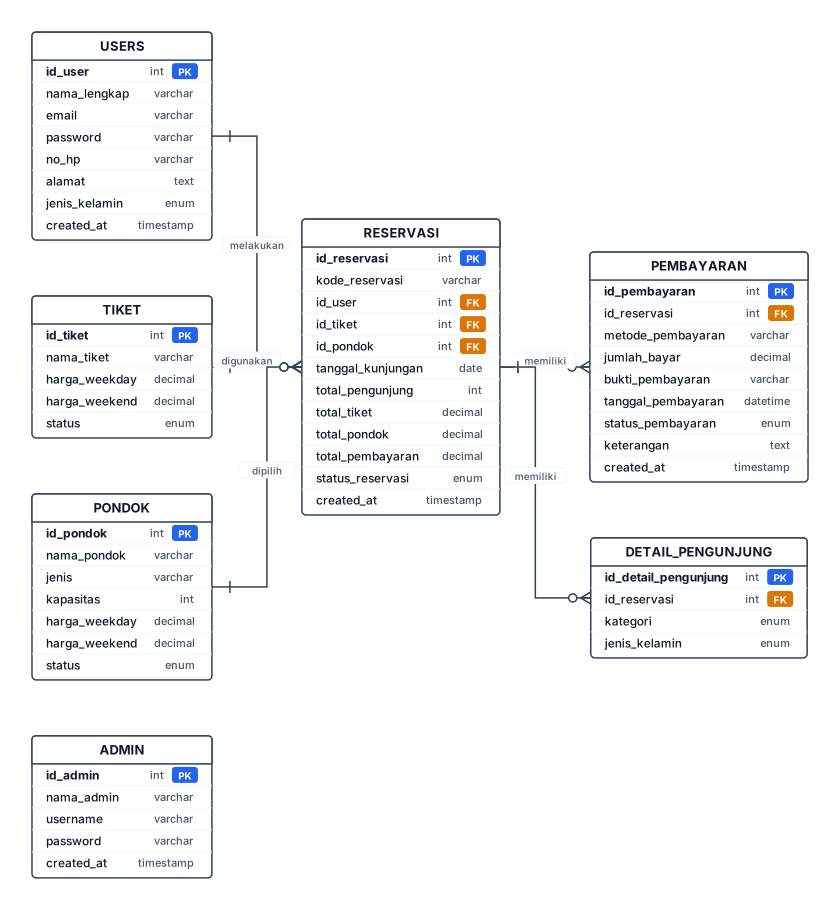
erDiagram USERS ||--o{ RESERVASI : melakukan TIKET ||--o{ RESERVASI : digunakan PONDOK ||--o{ RESERVASI : dipilih RESERVASI ||--o{ PEMBAYARAN : memiliki RESERVASI ||--o{ DETAIL_PENGUNJUNG : memiliki USERS { int id_user PK varchar nama_lengkap varchar email varchar password varchar no_hp text alamat enum jenis_kelamin timestamp created_at } TIKET { int id_tiket PK varchar nama_tiket decimal harga_weekday decimal harga_weekend enum status } PONDOK { int id_pondok PK varchar nama_pondok varchar jenis int kapasitas decimal harga_weekday decimal harga_weekend enum status } RESERVASI { int id_reservasi PK varchar kode_reservasi int id_user FK int id_tiket FK int id_pondok FK date tanggal_kunjungan int total_pengunjung decimal total_tiket decimal total_pondok decimal total_pembayaran enum status_reservasi timestamp created_at } PEMBAYARAN { int id_pembayaran PK int id_reservasi FK varchar metode_pembayaran decimal jumlah_bayar varchar bukti_pembayaran datetime tanggal_pembayaran enum status_pembayaran text keterangan timestamp created_at } DETAIL_PENGUNJUNG { int id_detail_pengunjung PK int id_reservasi FK enum kategori enum jenis_kelamin } ADMIN { int id_admin PK varchar nama_admin varchar username varchar password timestamp created_at }
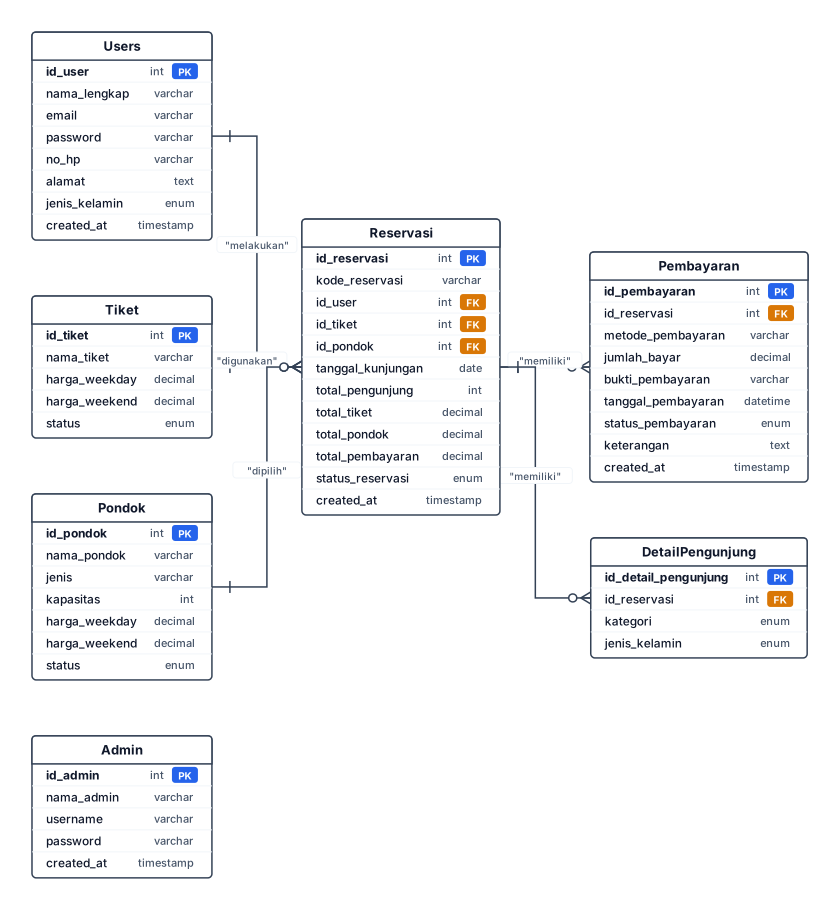
classDiagram class Admin { +id_admin : int +nama_admin : varchar +username : varchar +password : varchar +created_at : timestamp } class Users { +id_user : int +nama_lengkap : varchar +email : varchar +password : varchar +no_hp : varchar +alamat : text +jenis_kelamin : enum +created_at : timestamp } class Tiket { +id_tiket : int +nama_tiket : varchar +harga_weekday : decimal +harga_weekend : decimal +status : enum } class Pondok { +id_pondok : int +nama_pondok : varchar +jenis : varchar +kapasitas : int +harga_weekday : decimal +harga_weekend : decimal +status : enum } class Reservasi { +id_reservasi : int +kode_reservasi : varchar +id_user : int +id_tiket : int +id_pondok : int +tanggal_kunjungan : date +total_pengunjung : int +total_tiket : decimal +total_pondok : decimal +total_pembayaran : decimal +status_reservasi : enum +created_at : timestamp } class Pembayaran { +id_pembayaran : int +id_reservasi : int +metode_pembayaran : varchar +jumlah_bayar : decimal +bukti_pembayaran : varchar +tanggal_pembayaran : datetime +status_pembayaran : enum +keterangan : text +created_at : timestamp } class DetailPengunjung { +id_detail_pengunjung : int +id_reservasi : int +kategori : enum +jenis_kelamin : enum } Users "1" --> "0..*" Reservasi : melakukan Tiket "1" --> "0..*" Reservasi : digunakan Pondok "1" --> "0..*" Reservasi : dipilih Reservasi "1" --> "0..*" Pembayaran : memiliki Reservasi "1" --> "0..*" DetailPengunjung : memiliki

Why Choose a Level 3 UPPA Course Online? Nowadays, learners need flexibility, and that's exactly what our Level 3 Award in Understanding Principles and Practices of Assessment course provides. Rather than taking fixed classroom sessions, you can learn remotely while the learning materials, assessments, and tutor support are available online. Some important benefits of the Level 3 UPPA course online are: Flexible Study Schedule With learning remotely, you can study around your work, family and personal commitments. You can study at your own pace, in your own time, at a time that fits your schedule, no matter whether it's night, weekend, or specific hours of the day. Dedicated Tutor Support/Career Focused Skills A good online course will give you direction on your learning path. Tutors can help you with assignments, give feedback on them, and answer your questions at any time. Another benefit is the focus on career ready skills as our assessor course is geared towards helping you acquire assessor skills and knowledge that are directly relevant in the assessment industry, and thus equips learners for real-life educational situations.
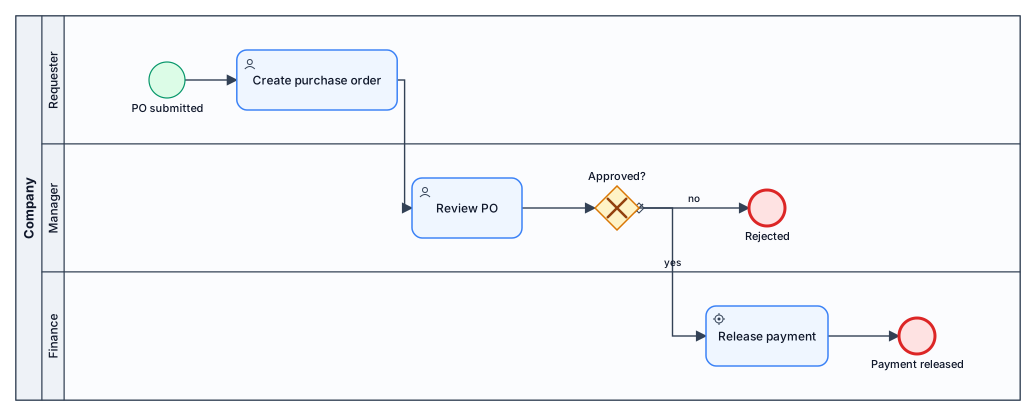
A BPMN diagram of a purchase-order approval process across three lanes: requester submits a PO, manager reviews and approves or rejects, finance releases payment
Swimlanes:Create a UML Activity Diagram for Login. Swimlanes: - User - System Flow: Start User opens Login page User enters Email and Password User clicks Login System validates login data Decision: Login valid? Yes: System creates session System opens Dashboard End No: System shows "Email atau Password salah" User returns to Login page User enters Email and Password again
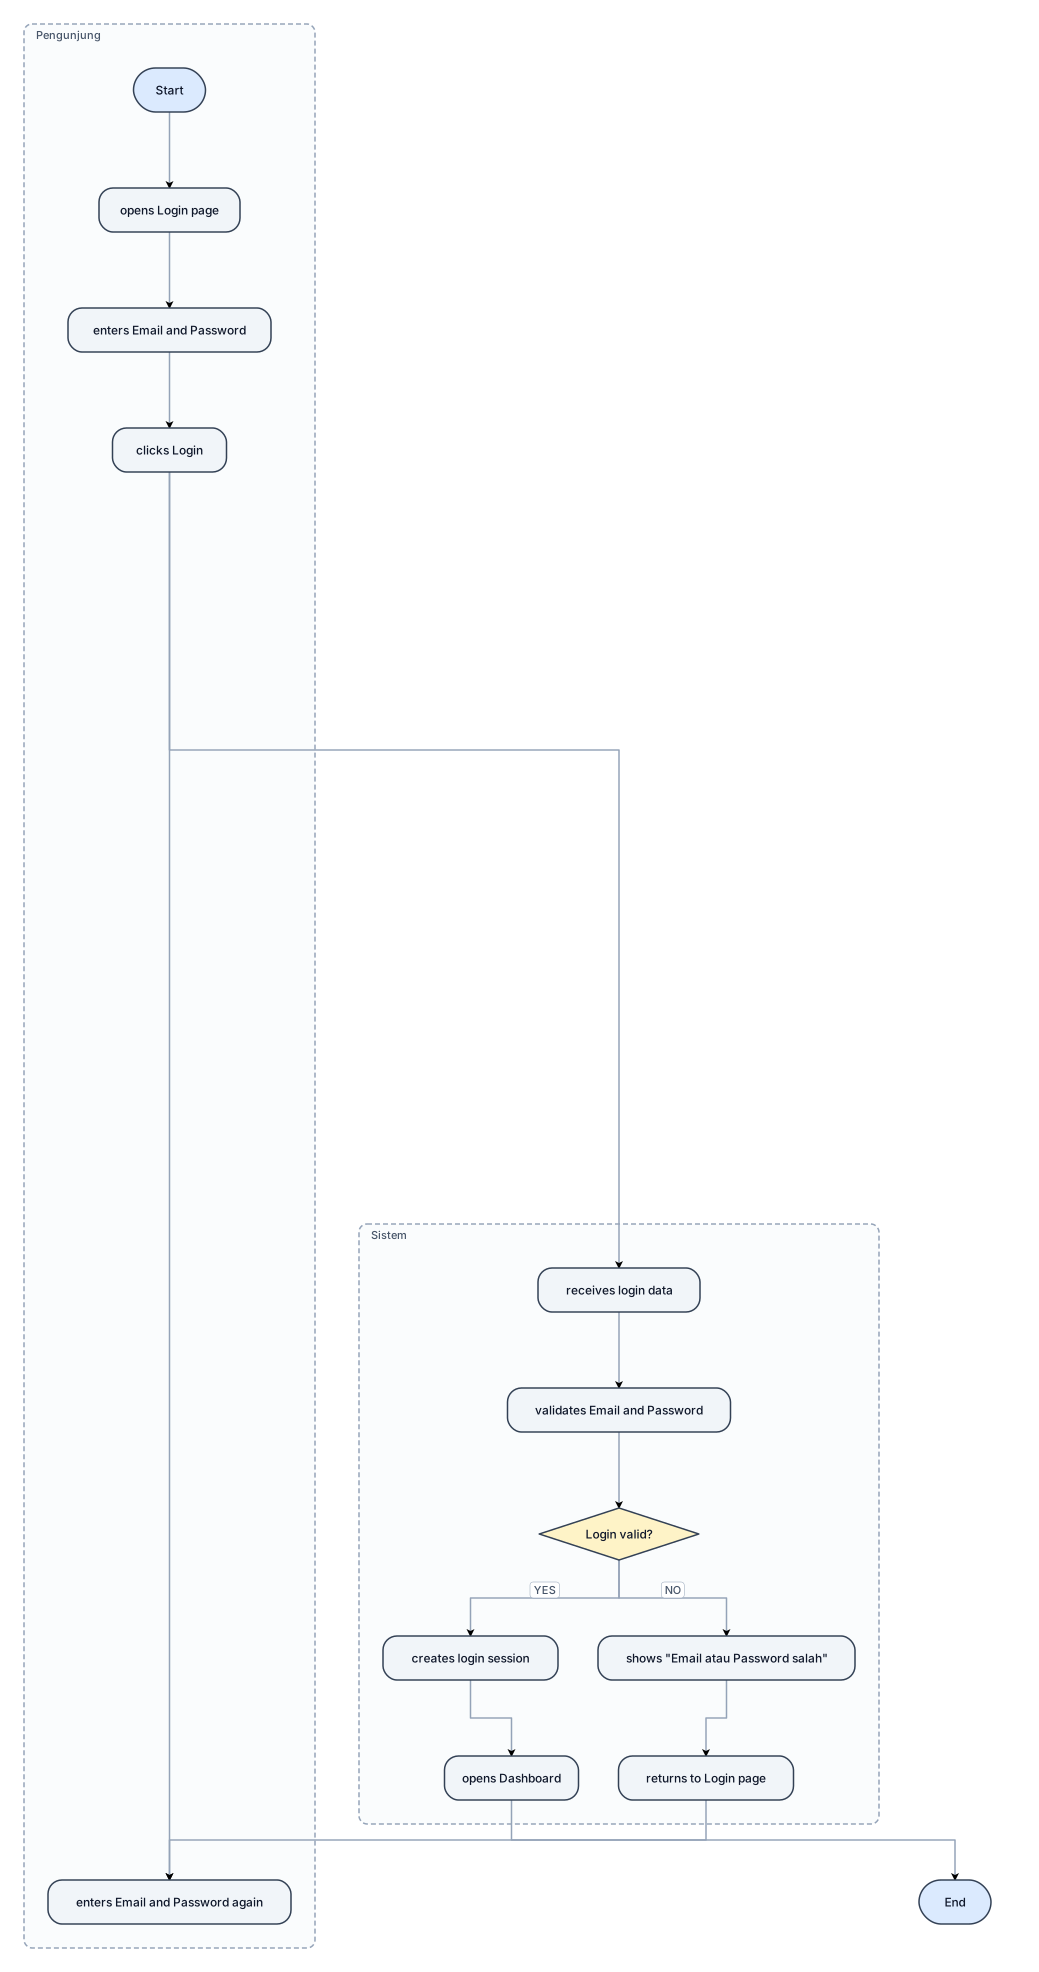
Use 2 vertical swimlanes: Pengunjung | Sistem Keep the diagram compact and horizontal where possible. Flow: Start Pengunjung opens Login page Pengunjung enters Email and Password Pengunjung clicks Login Sistem receives login data Sistem validates Email and Password Decision: Login valid? YES: Sistem creates login session Sistem opens Dashboard End NO: Sistem shows "Email atau Password salah" Pengunjung returns to Login page Pengunjung enters Email and Password again
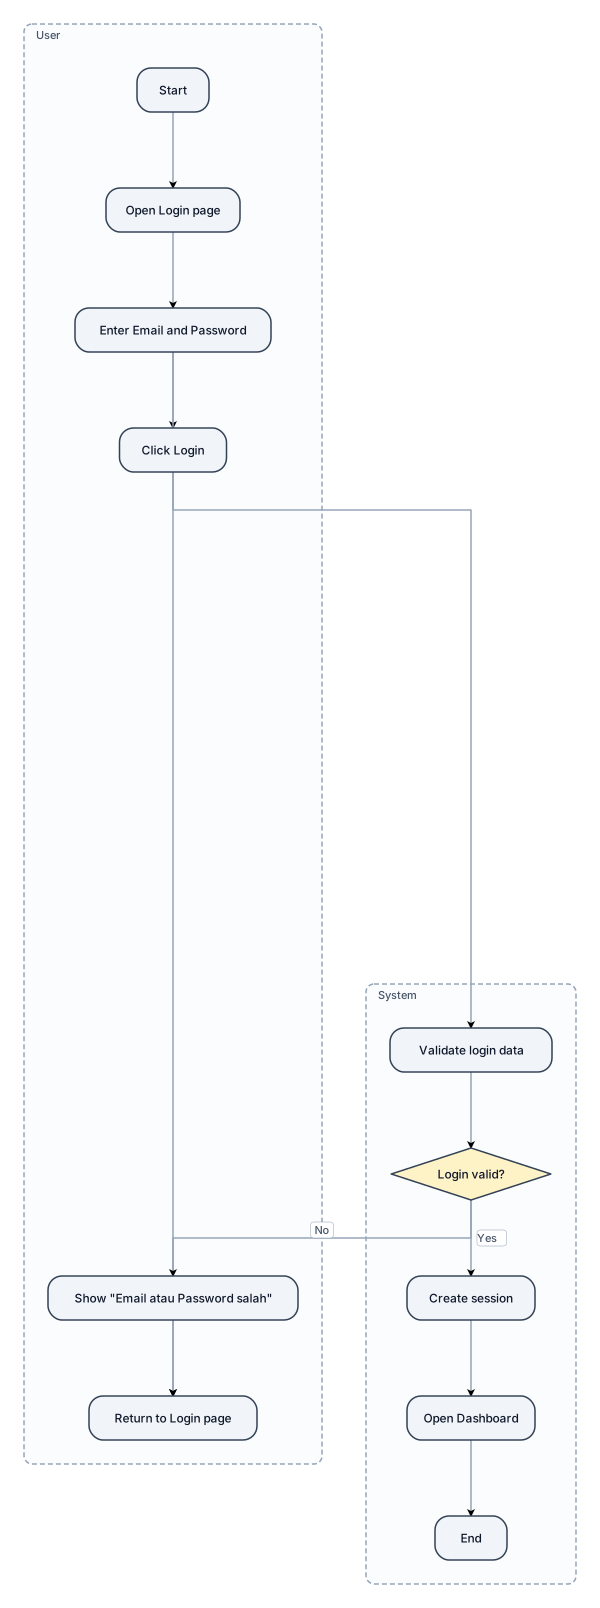
Swimlanes: - User - System Flow: Start User opens Login page User enters Email and Password User clicks Login System validates login data Decision: Login valid? Yes: System creates session System opens Dashboard End No: System shows "Email atau Password salah" User returns to Login page User enters Email and Password again
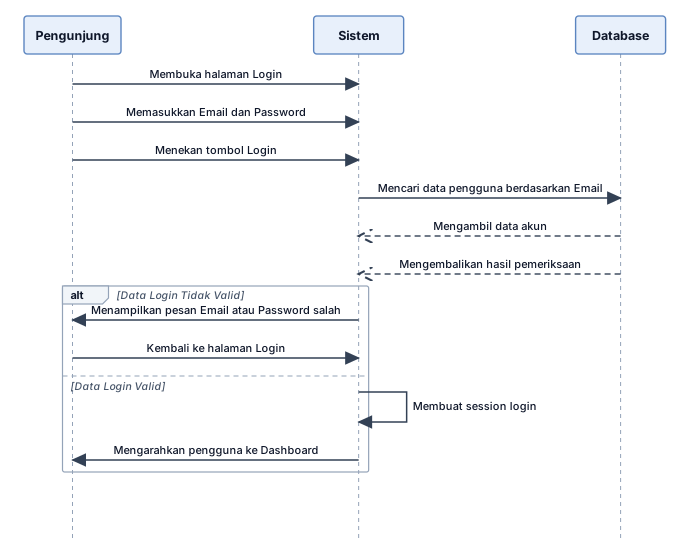
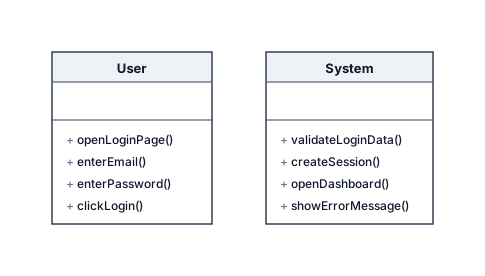
Pengunjung | Sistem | Database Alurnya: Pengunjung → Membuka halaman Login → Memasukkan Email dan Password → Menekan tombol Login Sistem → Menerima data login → Melakukan validasi Email dan Password Database → Mencari data pengguna berdasarkan Email → Mengambil data akun → Mengembalikan hasil pemeriksaan ke Sistem Sistem → Decision: Data Login Valid? Jika Tidak → Menampilkan pesan Email atau Password salah → Kembali ke halaman Login Jika Ya → Membuat session login → Mengarahkan pengguna ke Dashboard
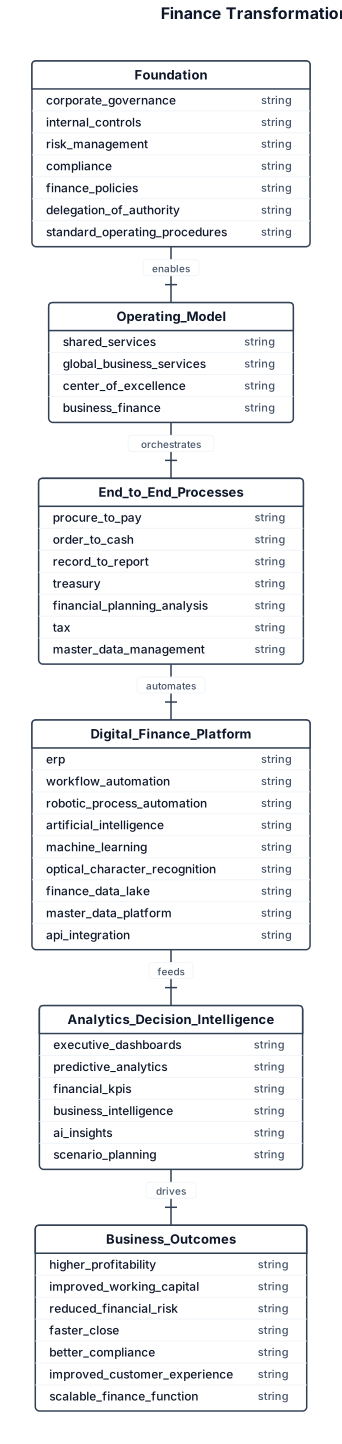
Create a world-class consulting style Finance Transformation Framework similar to the visual quality used by Deloitte, Accenture, PwC, EY and KPMG presentations. This is NOT a flowchart. Design it as a premium executive infographic with a modern business consulting style. Use a layered architecture from bottom to top. Layer 1 (Foundation) Corporate Governance Internal Controls Risk Management Compliance Finance Policies Delegation of Authority Standard Operating Procedures Layer 2 Finance Operating Model Shared Services Global Business Services Center of Excellence Business Finance Layer 3 End-to-End Finance Processes Procure-to-Pay (P2P) Order-to-Cash (O2C) Record-to-Report (R2R) Treasury Financial Planning & Analysis Tax Master Data Management Layer 4 Digital Finance Platform ERP Workflow Automation Robotic Process Automation Artificial Intelligence Machine Learning Optical Character Recognition Finance Data Lake Master Data Platform API Integration Layer 5 Analytics & Decision Intelligence Executive Dashboards Predictive Analytics Financial KPIs Business Intelligence AI Insights Scenario Planning Top Layer Business Outcomes Higher Profitability Improved Working Capital Reduced Financial Risk Faster Close Better Compliance Improved Customer Experience Scalable Finance Function Design requirements Use rounded modern rectangles. Use premium consulting colors. Use subtle gradients. Use clean typography. Use professional business icons. Maintain generous white space. No clipart. No cartoon style. No shadows. Minimal text. Balanced composition. Presentation quality suitable for a Fortune 500 CFO presentation. The final diagram should look like a proprietary consulting framework rather than a software architecture.
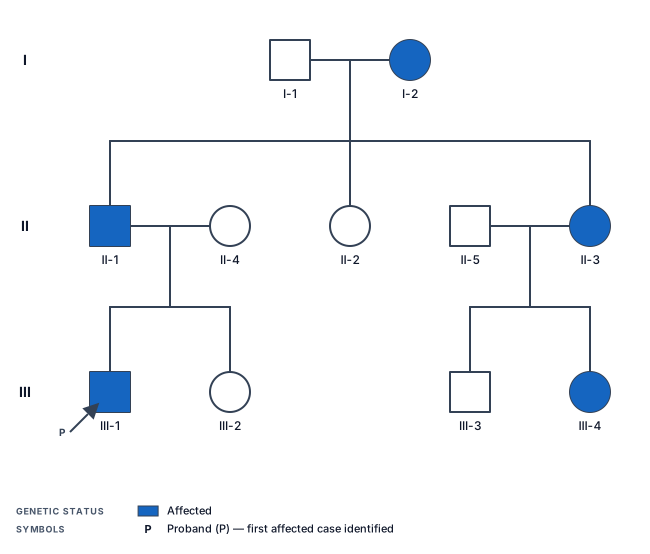
A three-generation pedigree chart showing autosomal dominant inheritance of Huntington disease, with the grandfather affected, two carrier children, and one affected grandchild
![Main diagram studio: [8/12, 2:00 AM] Kajuly: One of the most studied examples of inter-organ crosstalk is the gut–brain axis. This term describes the two-way communication](https://psvtykrtciekraoilfux.supabase.co/storage/v1/object/public/gallery-assets/freediagram/feed/38d1ac37-d3e9-4902-98a8-cc943e5a6dab.svg)
[8/12, 2:00 AM] Kajuly: One of the most studied examples of inter-organ crosstalk is the gut–brain axis. This term describes the two-way communication between the gastrointestinal tract and the brain. The gut contains trillions of microorganisms, collectively called the gut microbiota. These microorganisms are involved in digestion, metabolism, immune regulation, and the production of biologically active molecules. The gut can communicate with the brain through several pathways: Gut microbiota → microbial metabolites → blood → brain Gut → immune system → inflammatory signals → brain Gut → enteric nervous system → vagus nerve → brain Microorganisms can produce substances such as short-chain fatty acids (SCFAs), which are produced when certain bacteria break down dietary fiber. These molecules can influence intestinal cells, immune responses, metabolism, and potentially brain function. The communication also works in the opposite direction. The brain can influence the gut through the autonomic nervous system. Stress, neurological disease, medications, and changes in nervous system function can alter intestinal movement, secretion, and other gastrointestinal functions. An imbalance in the gut microbiota is called dysbiosis. Dysbiosis has been investigated in several neurodegenerative diseases, including ALS, FTD, Lewy body diseases, and MSA. However, finding differences in the microbiome does not prove that these differences cause neurodegeneration. Diet, medication, age, physical activity, constipation, and the disease itself can also change the microbiome. Generate a clean text free image with no description and spelling errors [8/12, 2:00 AM] Kajuly: add no extra info too

Start all signals at 0 besides LT03 A signal SV06 which and its timer SV06T which asserts after a 3 cycle delay if 51P or 51G1 asserts. Have 51P assert after 10 cycles for the duration of 20 cycles A signal SV05 and its dropout deay 3600 cycles, the dropout indicates that the signal SV05T will remain high as SV05 is high, if SV05 deasserts SV05T will dropout after 3600 cycles. The signal logic is R_TRIG SV06T AND (LT03 OR LT04) # TRIGGER FOR OVERCURRENT (RESET COUNTER WHEN TIMED OUT) SECTIONALIZER COUNT Provide LT03 signal as passivley active

A signal SV06 which and its timer SV06T which asserts after a 3 cycle delay if 51P or 51G1 asserts. Have 51P assert after 10 cycles for the duration of 20 cycles A signal SV05 and its dropout deay 3600 cycles, the dropout indicates that the signal SV05T will remain high as SV05 is high, if SV05 deasserts SV05T will dropout after 3600 cycles. The signal logic is R_TRIG SV06T AND (LT03 OR LT04) # TRIGGER FOR OVERCURRENT (RESET COUNTER WHEN TIMED OUT) SECTIONALIZER COUNT Provide LT03 signal as passivley active
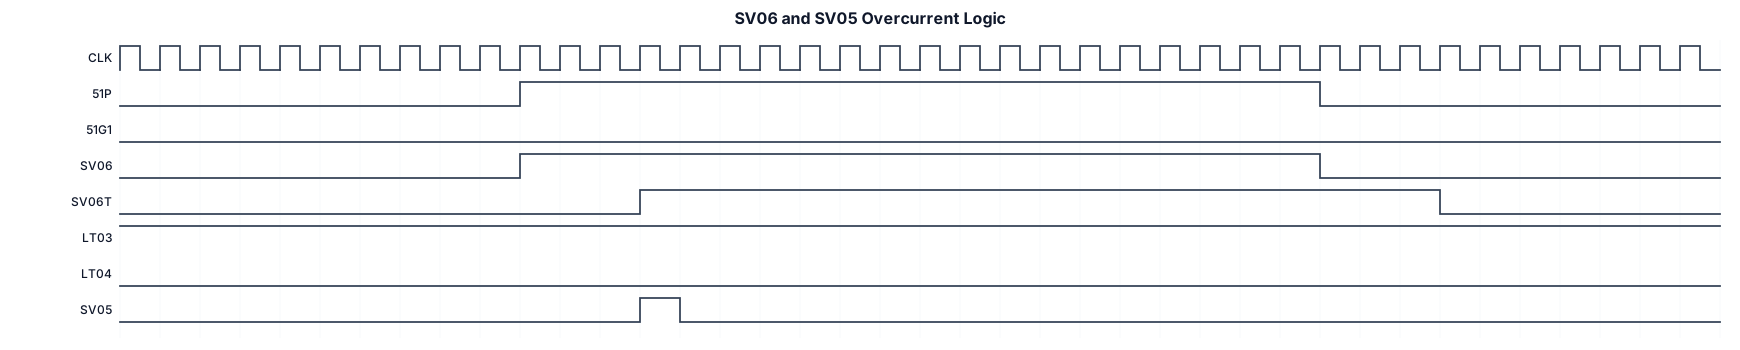
A signal SV06 which and its timer SV06T which asserts after a 3 cycle delay if 51P or 51G1 asserts. Have 51P assert after 10 cycles for the duration of 20 cycles A signal SV05 and its dropout deay 3600 cycles. The signal logic is R_TRIG SV06T AND (LT03 OR LT04) # TRIGGER FOR OVERCURRENT (RESET COUNTER WHEN TIMED OUT) SECTIONALIZER COUNT Provide LT03 signal as passivley active
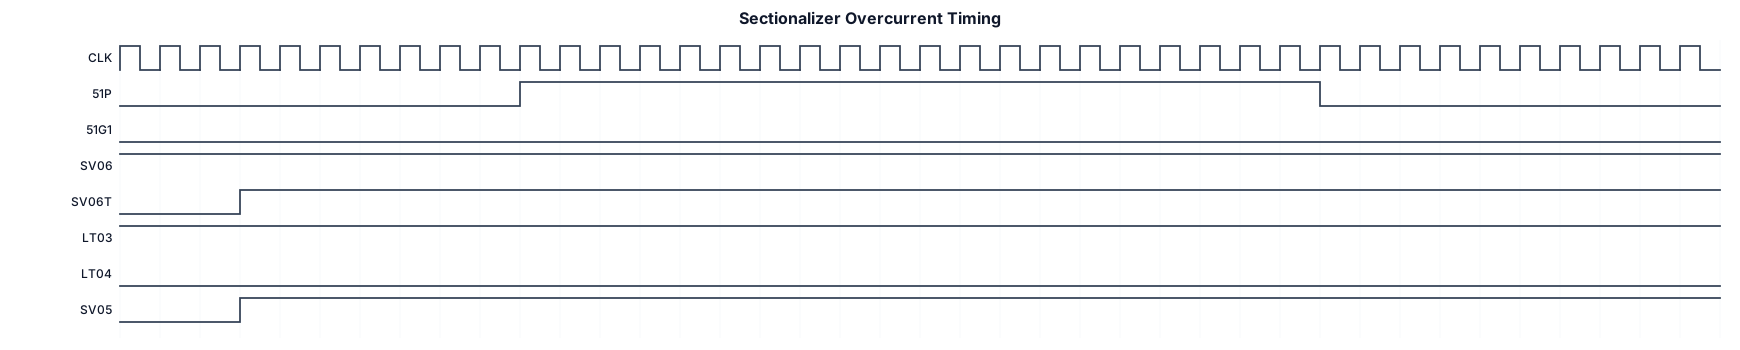
A signal SV06 which asserts immediately and its timer SV06T which asserts after a 3 cycle delay if 51P or 51G1 asserts. Have 51P assert after 10 cycles for the duration of 20 cycles A signal SV05 and its dropout deay 3600 cycles. The signal logic is R_TRIG SV06T AND (LT03 OR LT04) # TRIGGER FOR OVERCURRENT (RESET COUNTER WHEN TIMED OUT) SECTIONALIZER COUNT Provide LT03 signal as passivley active

A signal SV06 which asserts after a 3 cycle delay if 51P or 51G1 asserts. Have 51P assert after 10 cycles for the duration of 20 cycles

A signal SV06 which asserts if 51P or 51G1 asserts. Have 51P assert after 10 cycles for the duration of 20 cycles
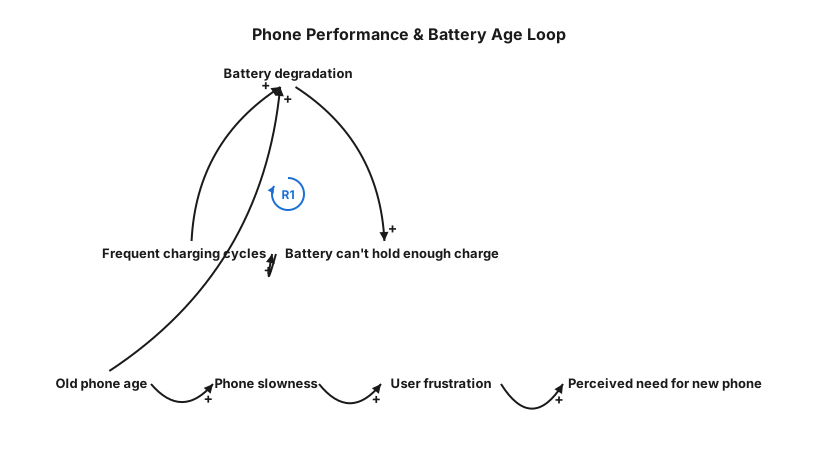
for the issue "My phone is too slow, and its battery can’t hold enough charge because it is old." We’ll use a tool called an annotated causal loop diagram to explore and understand the breadth of the problem at the system level, expanding the system boundary as needed and ensuring that our solution addresses leverage points for improvement. Because the diagram is two dimensional, it can be more effective than text for communicating for a complex, loopy story. Identify one specific aspect of the problem to solve. Choose a central variable that represents that specific aspect of the problem. (1 mark) Add 1-2 affecting variables and link them to the central variable. (1 mark) Add 1-2 affected variables and link them to the central variable. (1 mark) Add 1-2 links from the affected variables to the affecting variables. (1 mark) i wanted it created to be as clear as possible with no overlap
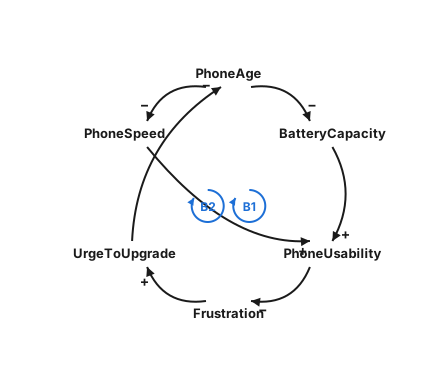
for the issue "My phone is too slow, and its battery can’t hold enough charge because it is old." We’ll use a tool called an annotated causal loop diagram to explore and understand the breadth of the problem at the system level, expanding the system boundary as needed and ensuring that our solution addresses leverage points for improvement. Because the diagram is two dimensional, it can be more effective than text for communicating for a complex, loopy story. Identify one specific aspect of the problem to solve. Choose a central variable that represents that specific aspect of the problem. (1 mark) Add 1-2 affecting variables and link them to the central variable. (1 mark) Add 1-2 affected variables and link them to the central variable. (1 mark) Add 1-2 links from the affected variables to the affecting variables. (1 mark)
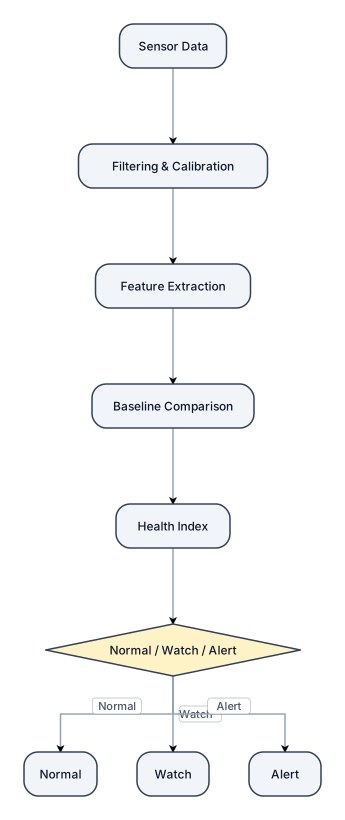
Sensor Data ↓ Filtering & Calibration ↓ Feature Extraction ↓ Baseline Comparison ↓ Health Index ↓ Normal / Watch / Alert
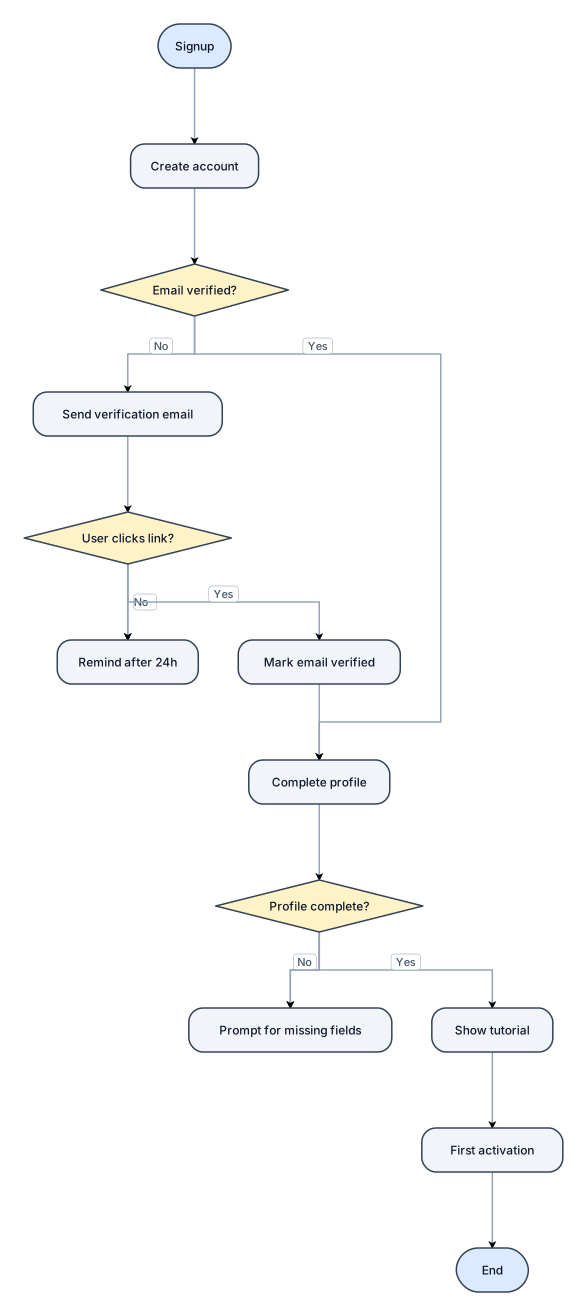
Sensor Data ↓ Filtering & Calibration ↓ Feature Extraction ↓ Baseline Comparison ↓ Health Index ↓ Normal / Watch / AlertA flowchart of a new-user onboarding flow from signup to first activation, with a verification branch
Focused examples and prompt ideas
Start with the complete visitor wall above, then use these focused collections when you want a narrower subject and more prompt context.
The first curated collection is being prepared.