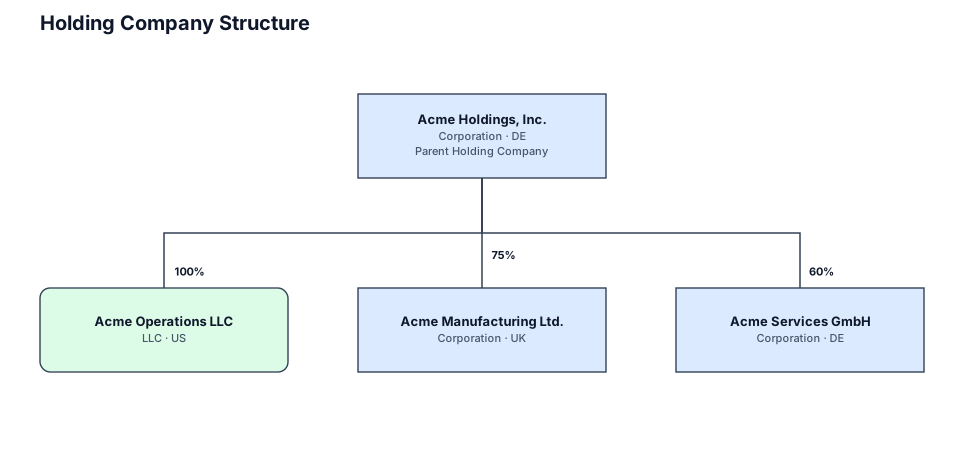
A legal entity structure for a holding company owning three operating subsidiaries with ownership percentages ┌─────────────────────┐ │ USER └──────────┬──────────┘ ▼ ┌─────────────────────┐ │ VIEW │ Flutter Widgets └──────────┬──────────┘ │ Events ▼ ┌─────────────────────┐ │ CONTROLLER │ │ Application Logic │ └──────────┬──────────┘ ▼ ┌─────────────────────┐ │ MODEL │ Data └─────────────────────┘
NODE ARCHIVE · REAL DIAGRAM BRIEFS
Diagram Examples from Real Visitor Prompts
Browse eligible diagrams shared by FreeDiagram visitors, inspect the exact prompts, and build your own version.
Browse 3286 real creationsCOMMUNITY OUTPUTS · EXACT PROMPTS
All visitor creations
Showing 1249–1272 of 3286. No stock examples or system defaults. Choose a tool, study a real result, then reopen its prompt as your starting point.
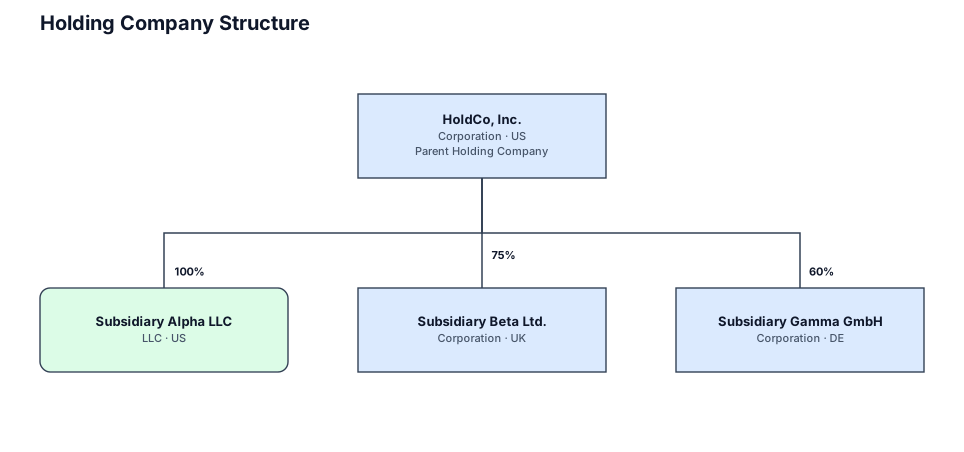
A legal entity structure for a holding company owning three operating subsidiaries with ownership percentages
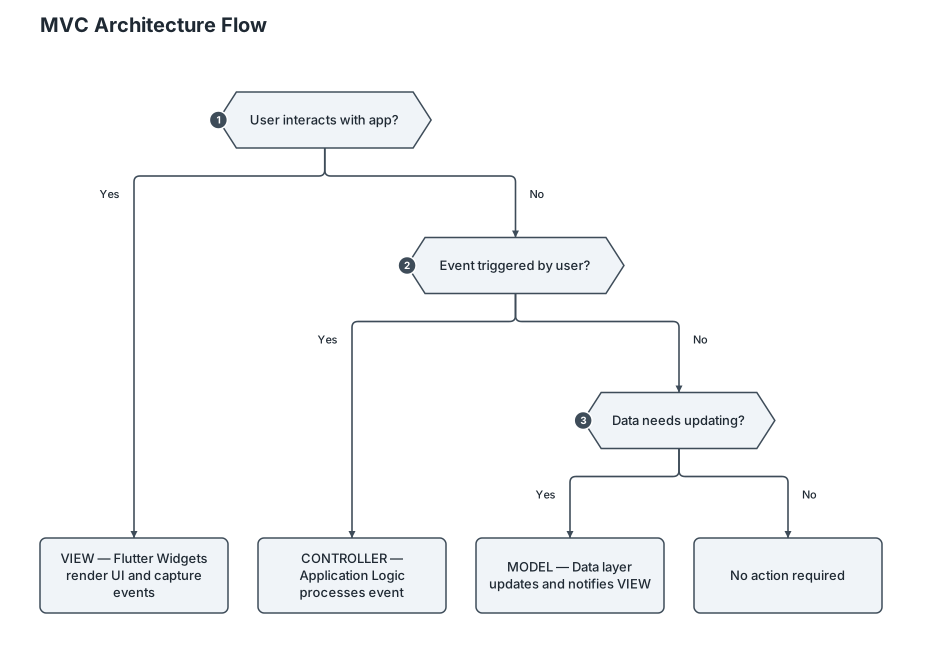
┌─────────────────────┐ │ USER └──────────┬──────────┘ ▼ ┌─────────────────────┐ │ VIEW │ Flutter Widgets └──────────┬──────────┘ │ Events ▼ ┌─────────────────────┐ │ CONTROLLER │ │ Application Logic │ └──────────┬──────────┘ ▼ ┌─────────────────────┐ │ MODEL │ Data └─────────────────────┘
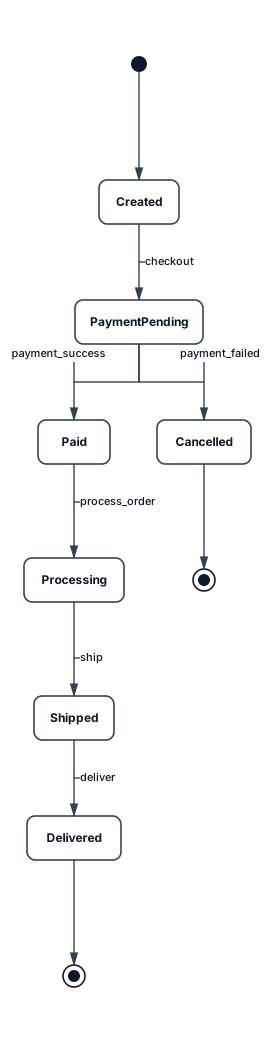
A state diagram for an e-commerce order: created, payment pending, paid, processing, shipped, delivered, and cancelled states with transitions between them
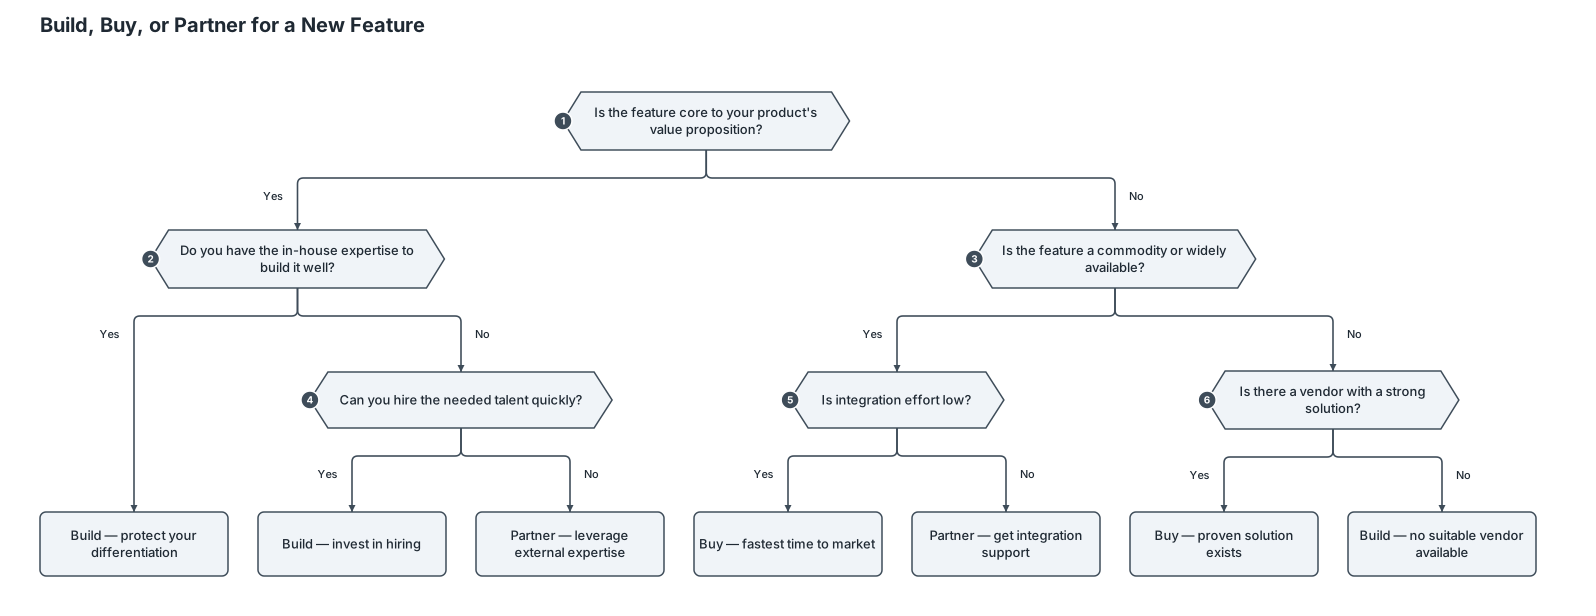
A decision tree for whether a startup should build, buy, or partner for a new feature ┌─────────────────────┐ │ USER └──────────┬──────────┘ ▼ ┌─────────────────────┐ │ VIEW │ Flutter Widgets └──────────┬──────────┘ │ Events ▼ ┌─────────────────────┐ │ CONTROLLER │ │ Application Logic │ └──────────┬──────────┘ ▼ ┌─────────────────────┐ │ MODEL │ Data └─────────────────────┘
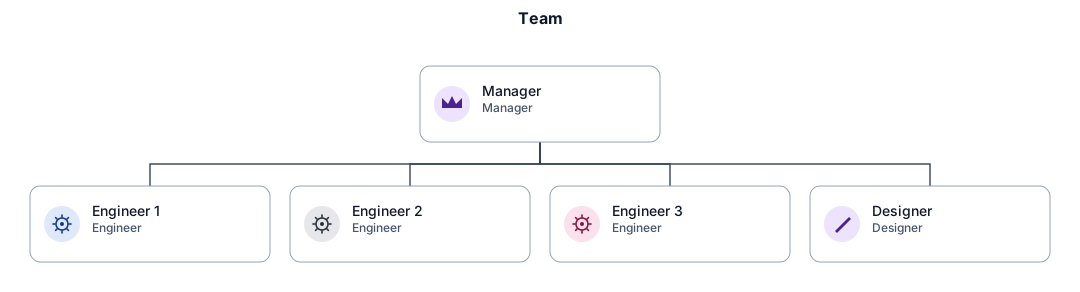
An org chart for a small team with a manager, three engineers, and a designer
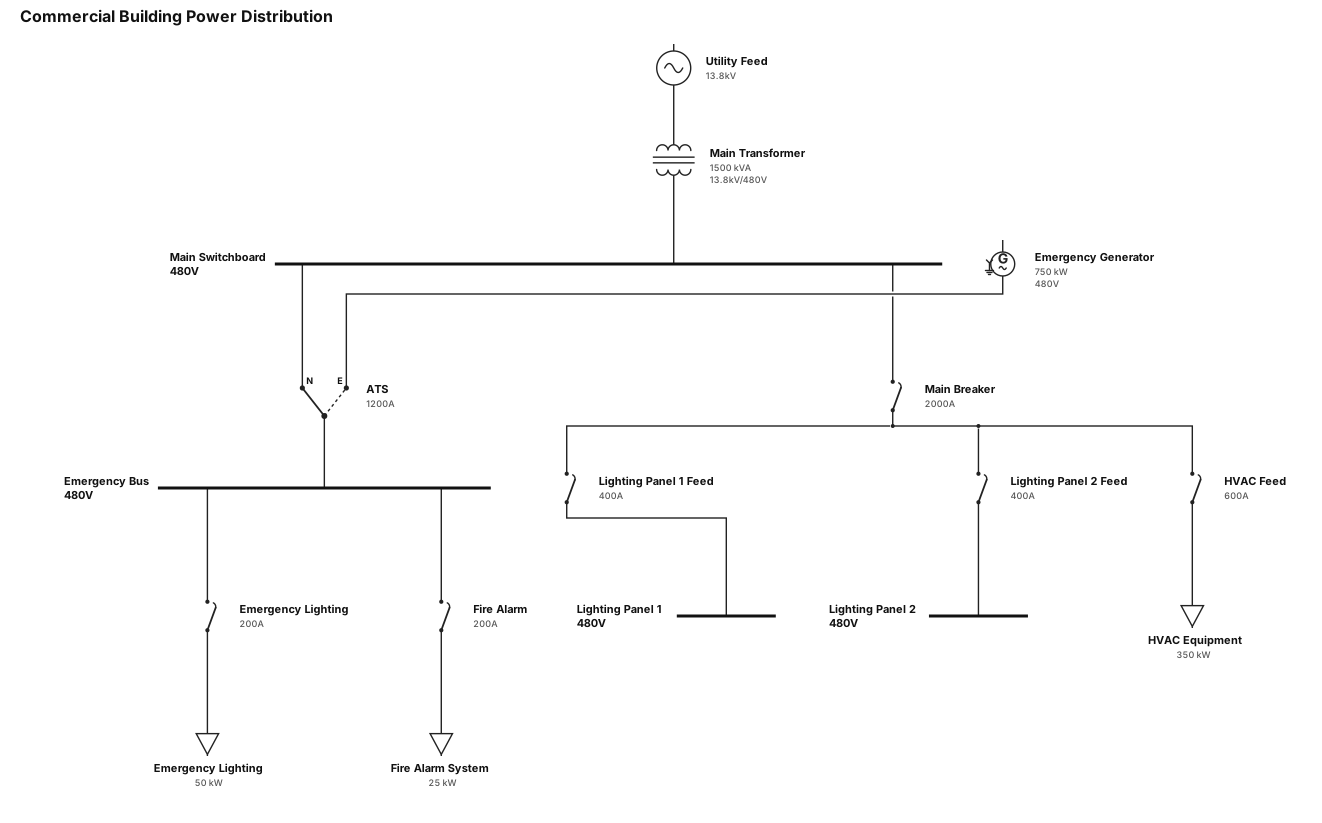
A single-line diagram for a commercial building: utility feed through a main transformer to a 480V switchboard, then to lighting panels, HVAC equipment, and an emergency generator with ATS
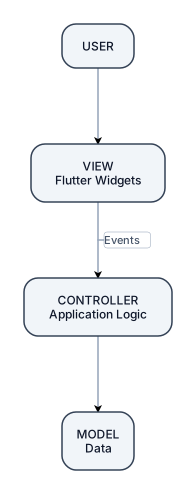
┌─────────────────────┐ │ USER └──────────┬──────────┘ ▼ ┌─────────────────────┐ │ VIEW │ Flutter Widgets └──────────┬──────────┘ │ Events ▼ ┌─────────────────────┐ │ CONTROLLER │ │ Application Logic │ └──────────┬──────────┘ ▼ ┌─────────────────────┐ │ MODEL │ Data └─────────────────────┘
Нарисуй схему подключения двух TMC2209 от TWOTREES к ESP32-S3-WROOM-1 по UART к пинам GPIO21, GPIO47, EN1 ->GPIO42, EN2 ->GPIO41, STEP1 -> GPIO1, DIR1 -> GPIO2, STEP2 -> GPIO40, DIR2 -> GPIO39. Подробнее остановись на UART соединениях. Укажи необходимые елементы защиты линий и цепей. Используй Datasheet на драйверы и микроконтроллер
Draw a diagram showing how to connect two TMC2209 drivers from TWOTREES to the ESP32-S3-WROOM-1 via UART to the following pins: GPIO21, GPIO47, EN1 -> GPIO42, EN2 -> GPIO41, STEP1 -> GPIO1, DIR1 -> GPIO2, STEP2 -> GPIO40, DIR2 -> GPIO39. Focus in more detail on the UART connections. Specify the necessary protection elements for the lines and circuits. Use the datasheet for the drivers and the microcontroller.
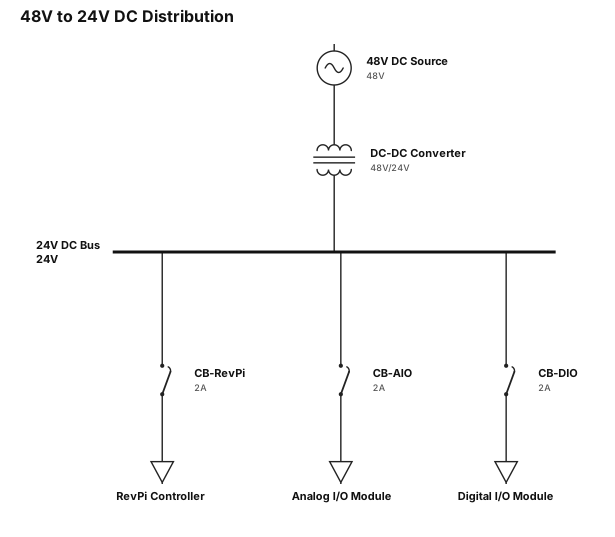
A single-line diagram for 48v -> DCDC 24v -> Revpi, AIO, DIO

Main Header • DATA VISUALISATION & ANALYSIS Categories & Subcategories • DATA • Structured • Unstructured • COLLECTION • Observation • Survey • Measurement • Digital • STORAGE • Database • Spreadsheet • Text/Media • ORGANISING • clean • Remove errors • Arrange • Group • VISUALISATION • Bar → Compare • Line → Time • Pie → Whole Flowchart Progression (Bottom Section) • DATA ANALYSIS • Patterns • Trends • Conclusions • PRECISION & ACCURACY • VALID DATA a mind map on this info
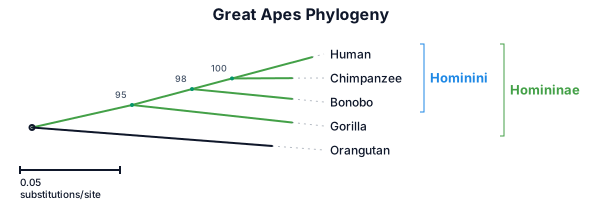
A phylogenetic tree of the great apes: humans, chimpanzees, bonobos, gorillas, and orangutans, with branch lengths and bootstrap support values
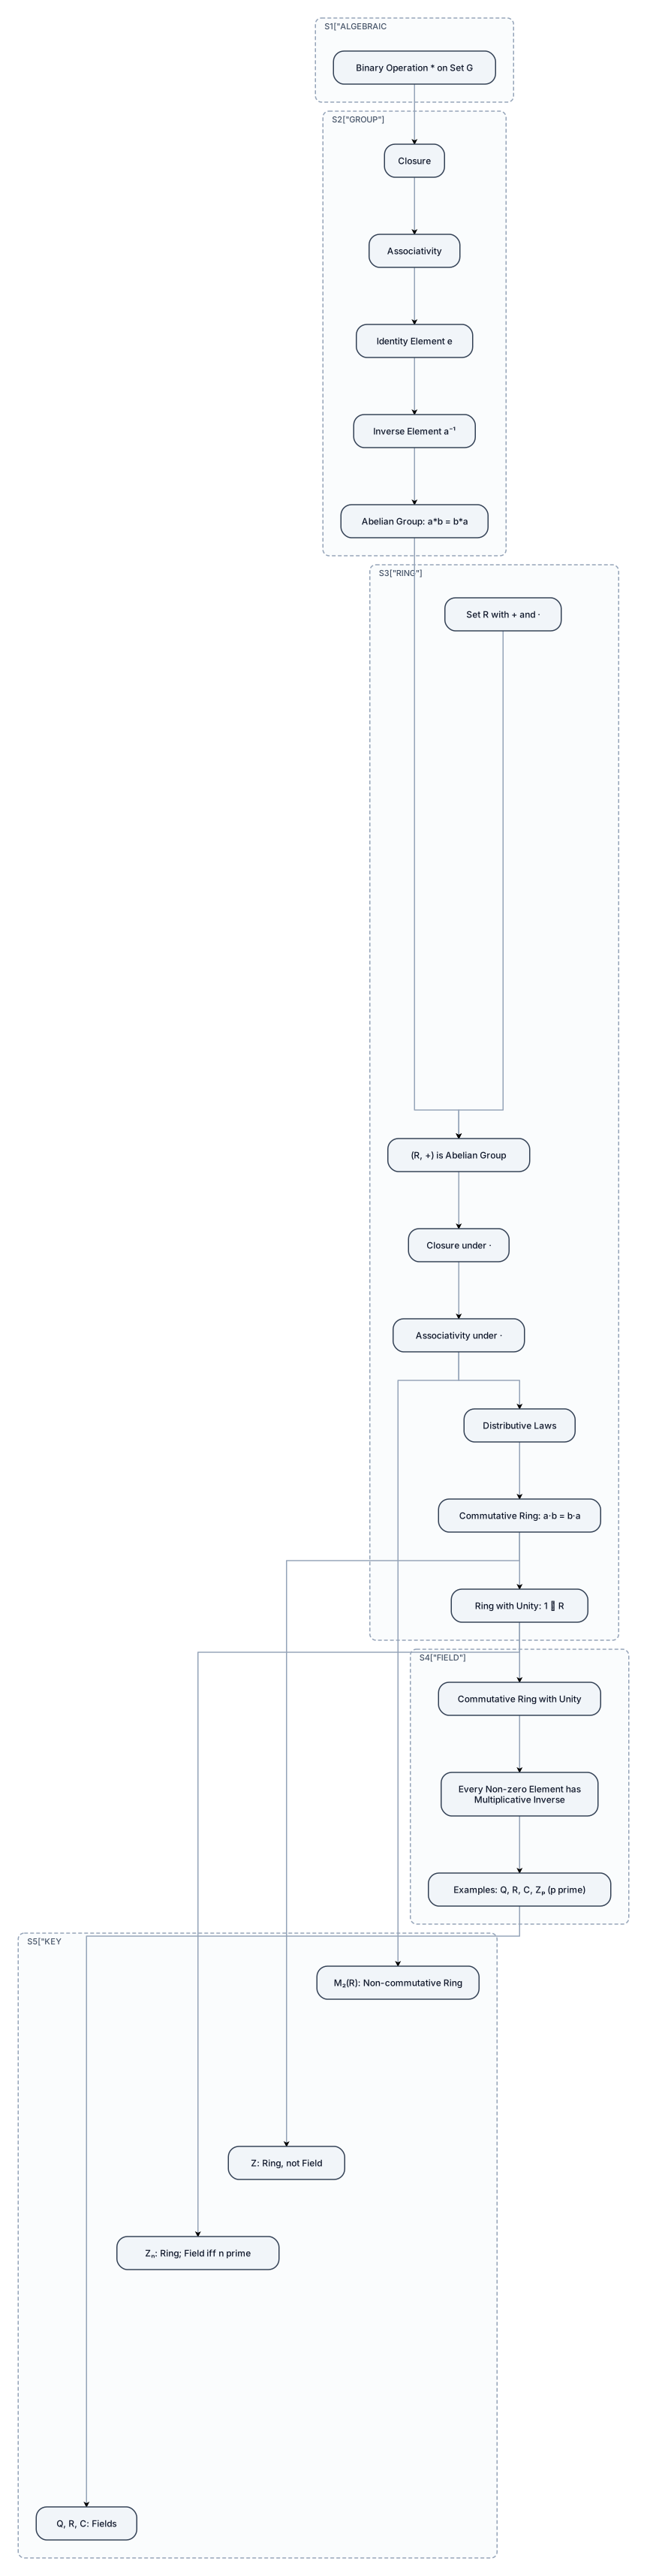
create a beautiful and attractive concept map in the flowchart format on the topic rings and fields of the unit algebraic structures in an engineering mathematics
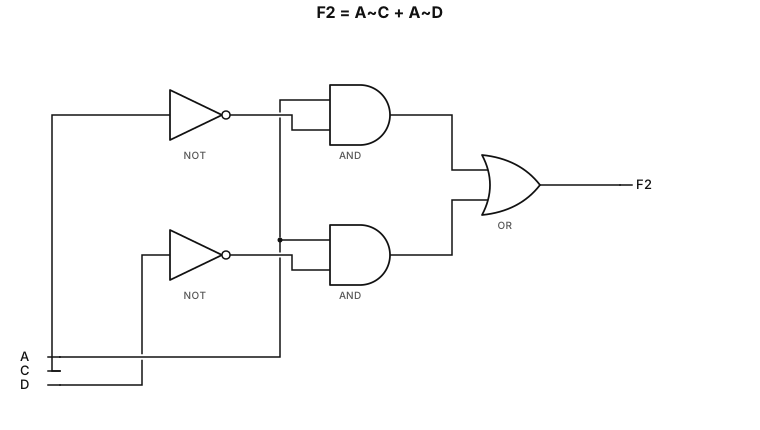
$F_2 = A\overline{C} + A\overline{D}$
$F_2 = A\overline{C} + A\overline{D}$
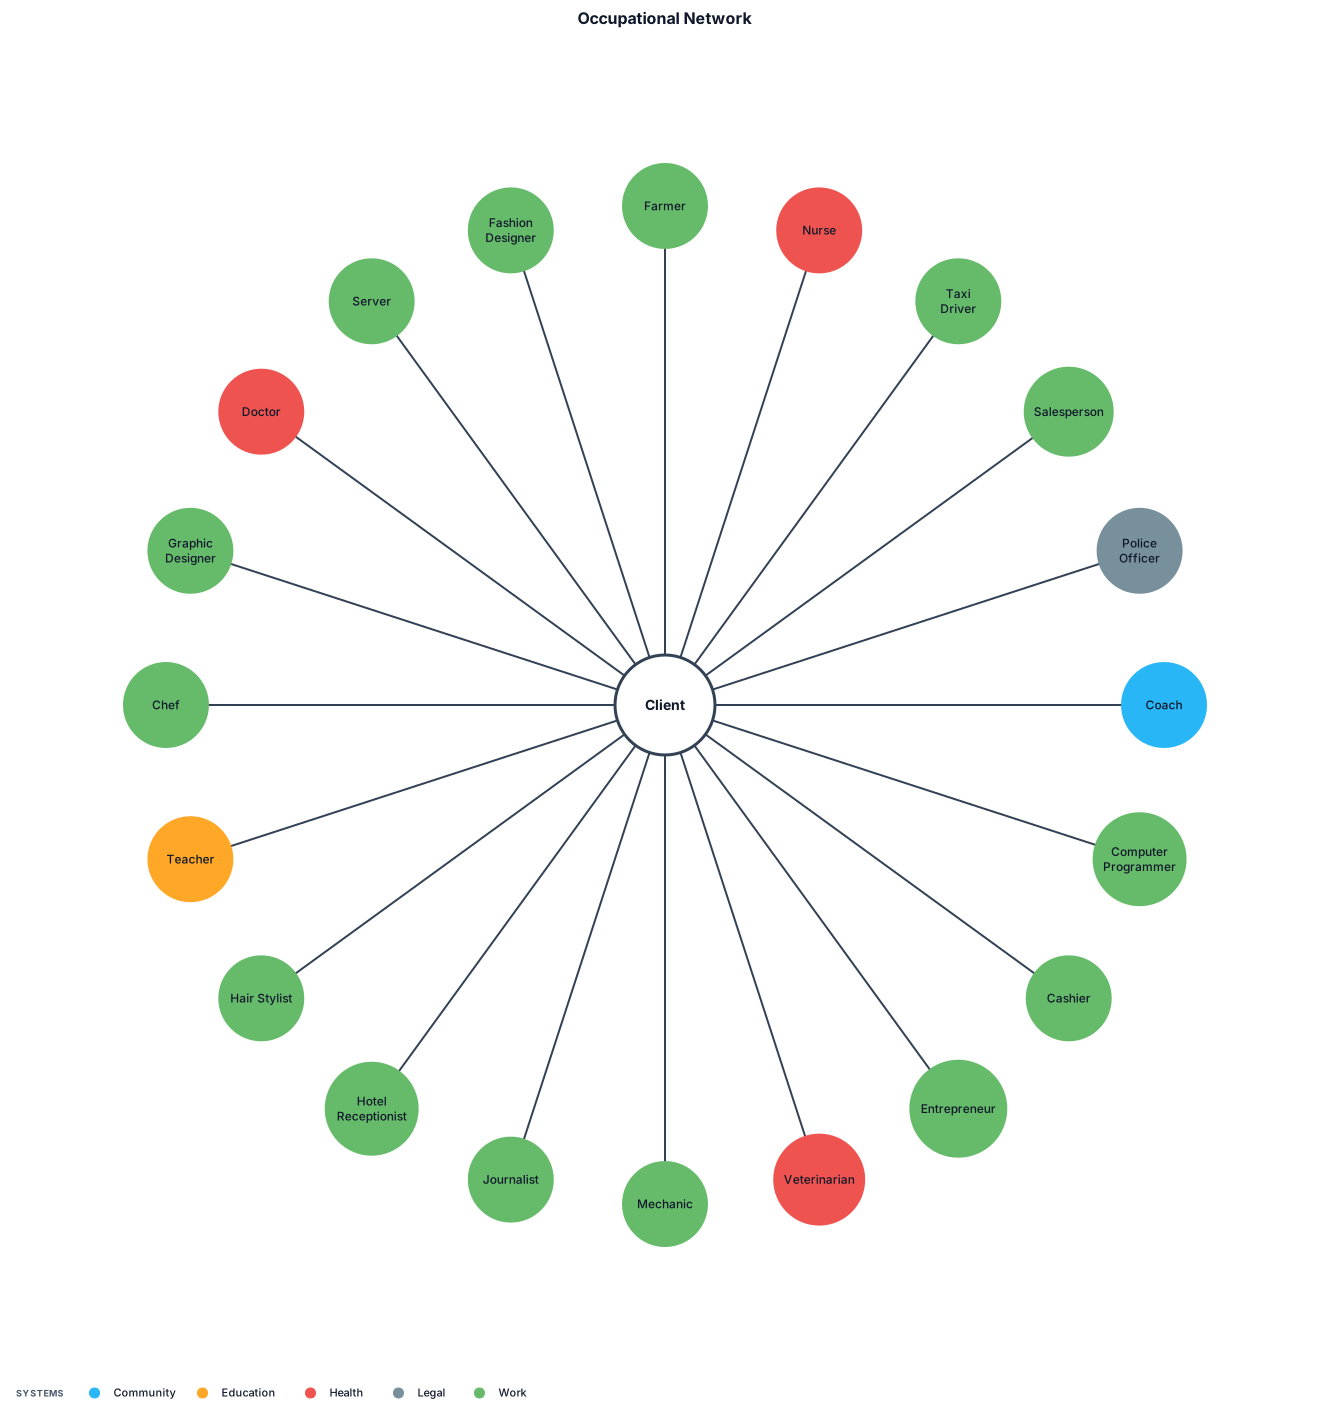
Farmer, Nurse, Taxi driver, Salesperson, Police officer, Coach, Computer programmer, Cashier, Entrepreneur, Veterinarian, Mechanic, Journalist, Hotel receptionist, Hair stylist, Teacher, Chef, Graphic designer, Doctor, Server, Fashion designer.
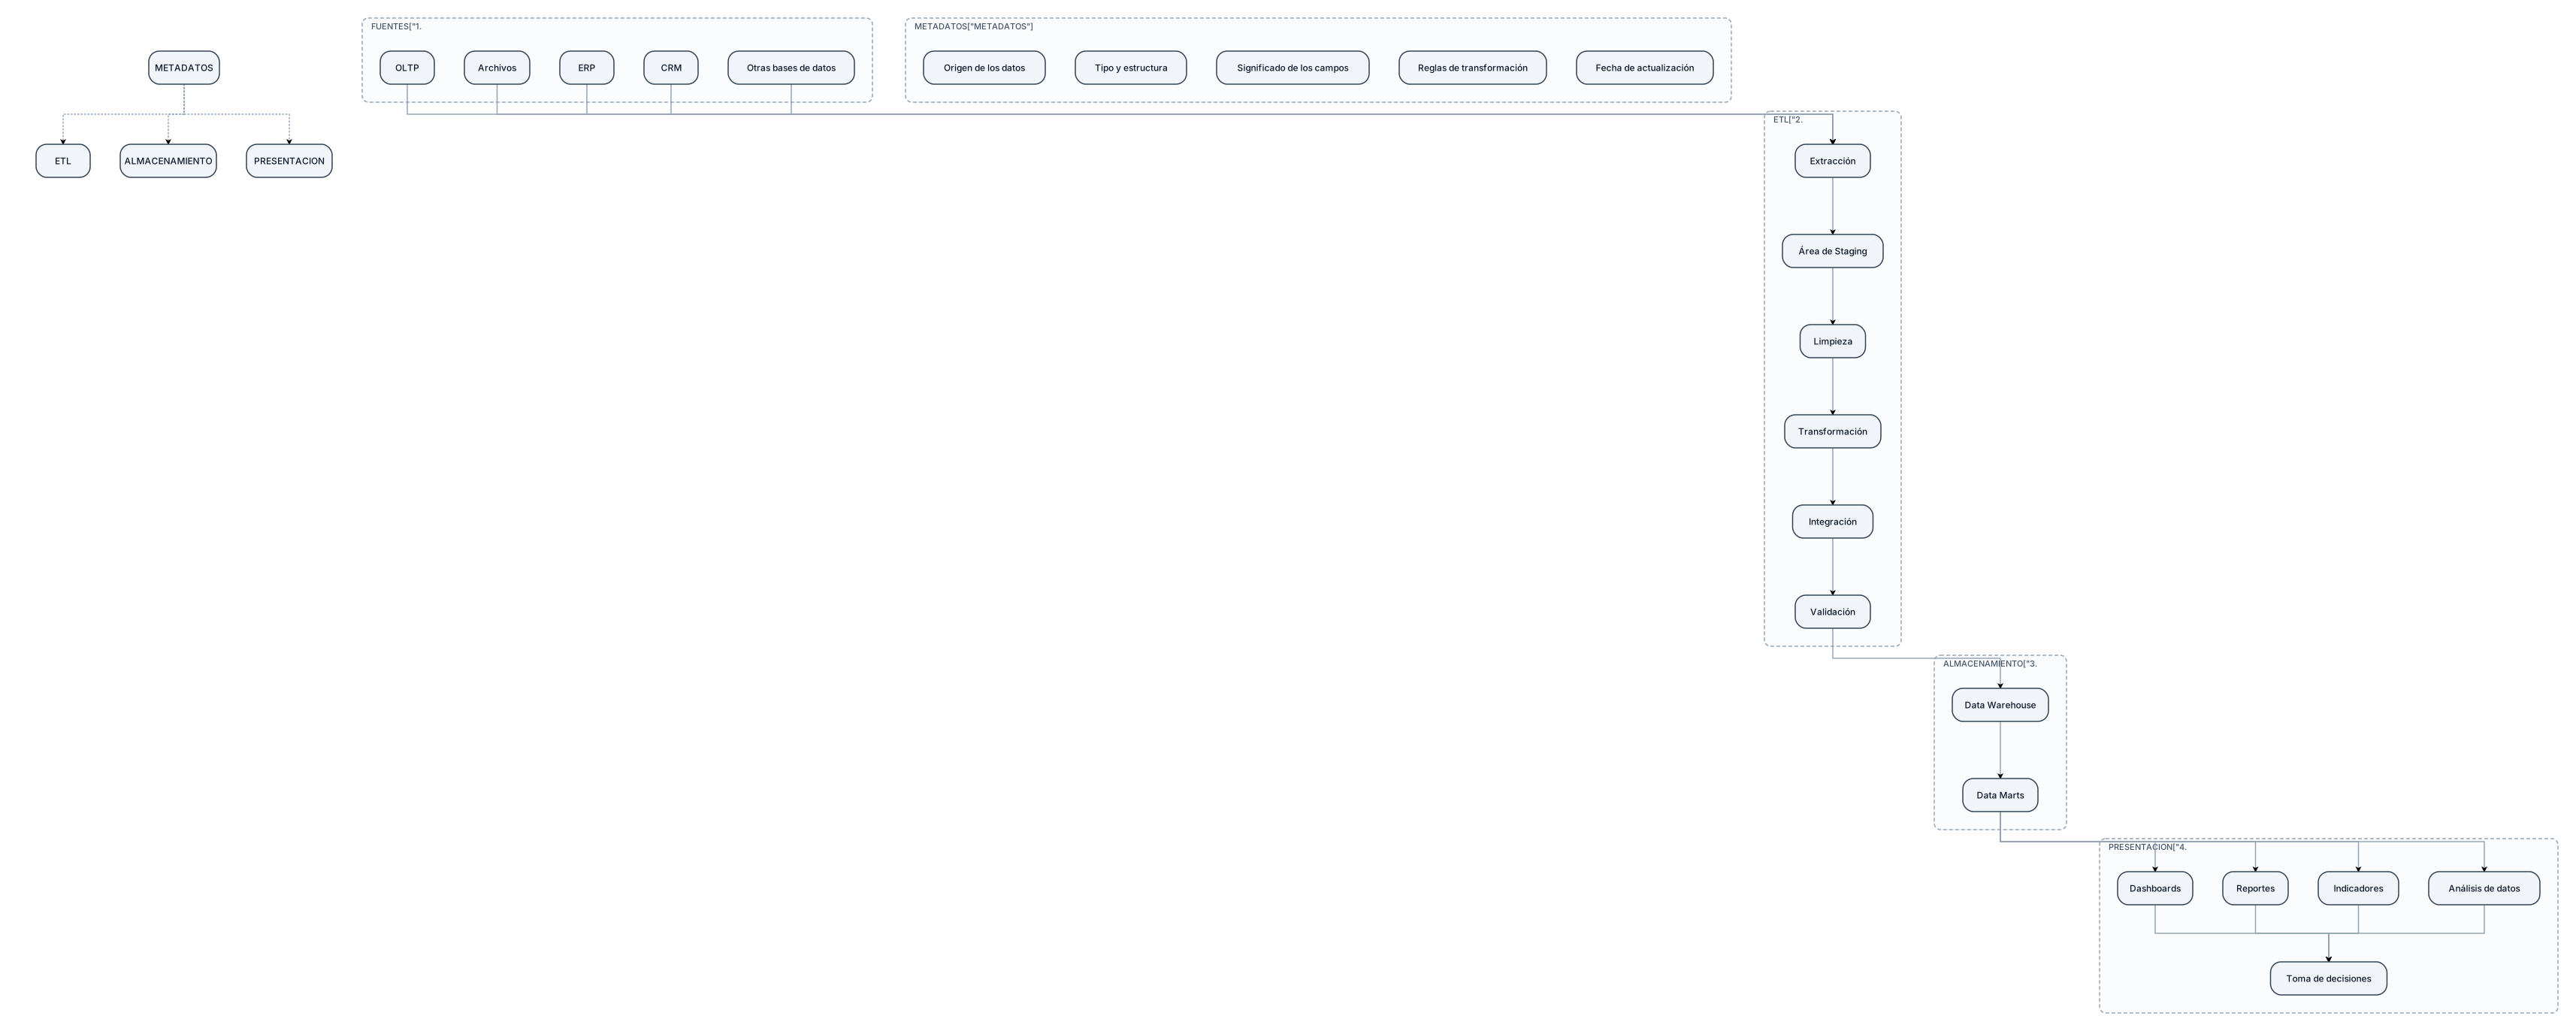
Crea un diagrama de flujo vertical sobre la arquitectura general de un Data Warehouse corporativo. Debe contener exactamente 4 capas principales: 1. FUENTES DE ORIGEN: OLTP, archivos, ERP, CRM y otras bases de datos. 2. ETAPA DE EXTRACCIÓN Y TRANSFORMACIÓN: Extracción, área de Staging, limpieza, transformación, integración y validación. Indicar que Staging es un área temporal donde los datos se almacenan antes de ser transformados y cargados al Data Warehouse. 3. ALMACENAMIENTO: Data Warehouse y Data Marts. Indicar que aquí se almacenan datos históricos, integrados y organizados para el análisis. 4. PRESENTACIÓN / BI: Dashboards, reportes, indicadores y análisis de datos, terminando en Toma de decisiones. El flujo debe ser claramente direccional: Fuentes de origen → Extracción → Staging → Transformación y validación → Data Warehouse → Data Marts → Presentación/BI → Toma de decisiones. Agregar una sección lateral llamada METADATOS con: Origen de los datos, tipo y estructura, significado de los campos, reglas de transformación y fecha de actualización. Usar un diseño académico, limpio, ordenado y fácil de leer.
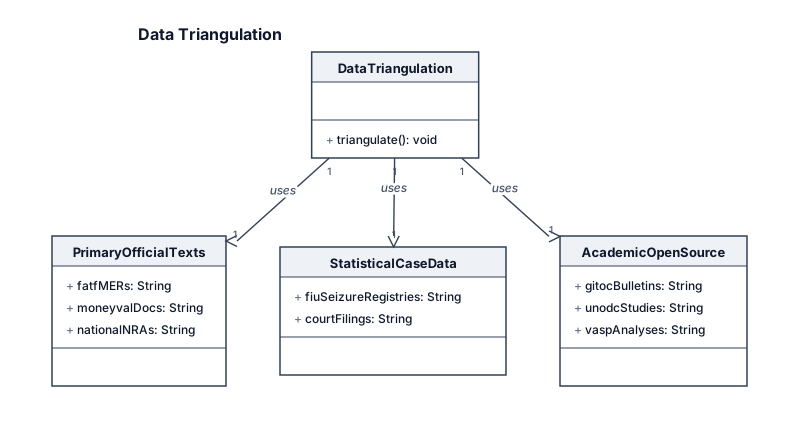
┌────────────────────────────────────────────────────────┐ │ DATA TRIANGULATION │ └───────────────────────────┬────────────────────────────┘ │ ┌─────────────────────────────────┼─────────────────────────────────┐ ▼ ▼ ▼ ┌─────────────────┐ ┌─────────────────┐ ┌─────────────────┐ │ PRIMARY │ │ STATISTICAL │ │ ACADEMIC & │ │ OFFICIAL TEXTS │ │ CASE DATA │ │ OPEN-SOURCE │ ├─────────────────┤ ├─────────────────┤ ├─────────────────┤ │ • FATF MERs │ │ • FIU Seizure │ │ • GI-TOC Bulletins│ │ • MONEYVAL Docs │ │ Registries │ │ • UNODC Studies │ │ • National NRAs │ │ • Court Filings │ │ • VASP Analyses │ └─────────────────┘ └─────────────────┘ └─────────────────┘
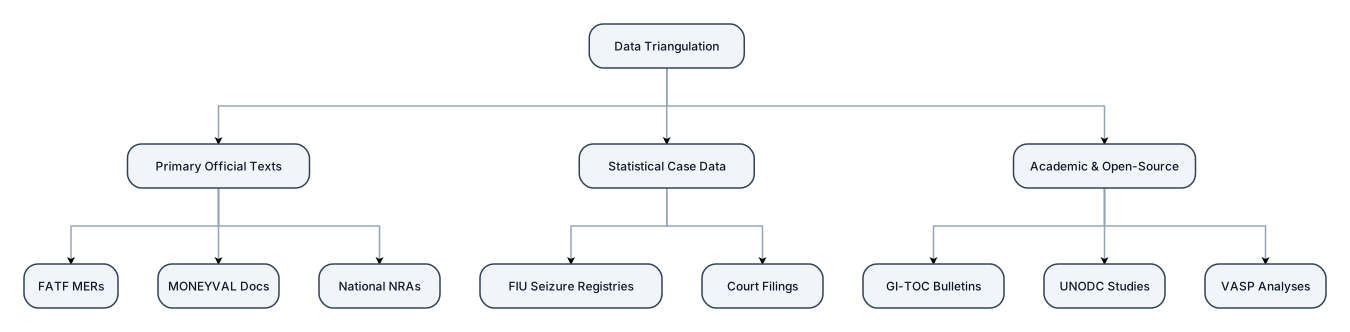
design a better table for the following: ┌────────────────────────────────────────────────────────┐ │ DATA TRIANGULATION │ └───────────────────────────┬────────────────────────────┘ │ ┌─────────────────────────────────┼─────────────────────────────────┐ ▼ ▼ ▼ ┌─────────────────┐ ┌─────────────────┐ ┌─────────────────┐ │ PRIMARY │ │ STATISTICAL │ │ ACADEMIC & │ │ OFFICIAL TEXTS │ │ CASE DATA │ │ OPEN-SOURCE │ ├─────────────────┤ ├─────────────────┤ ├─────────────────┤ │ • FATF MERs │ │ • FIU Seizure │ │ • GI-TOC Bulletins│ │ • MONEYVAL Docs │ │ Registries │ │ • UNODC Studies │ │ • National NRAs │ │ • Court Filings │ │ • VASP Analyses │ └─────────────────┘ └─────────────────┘ └─────────────────┘
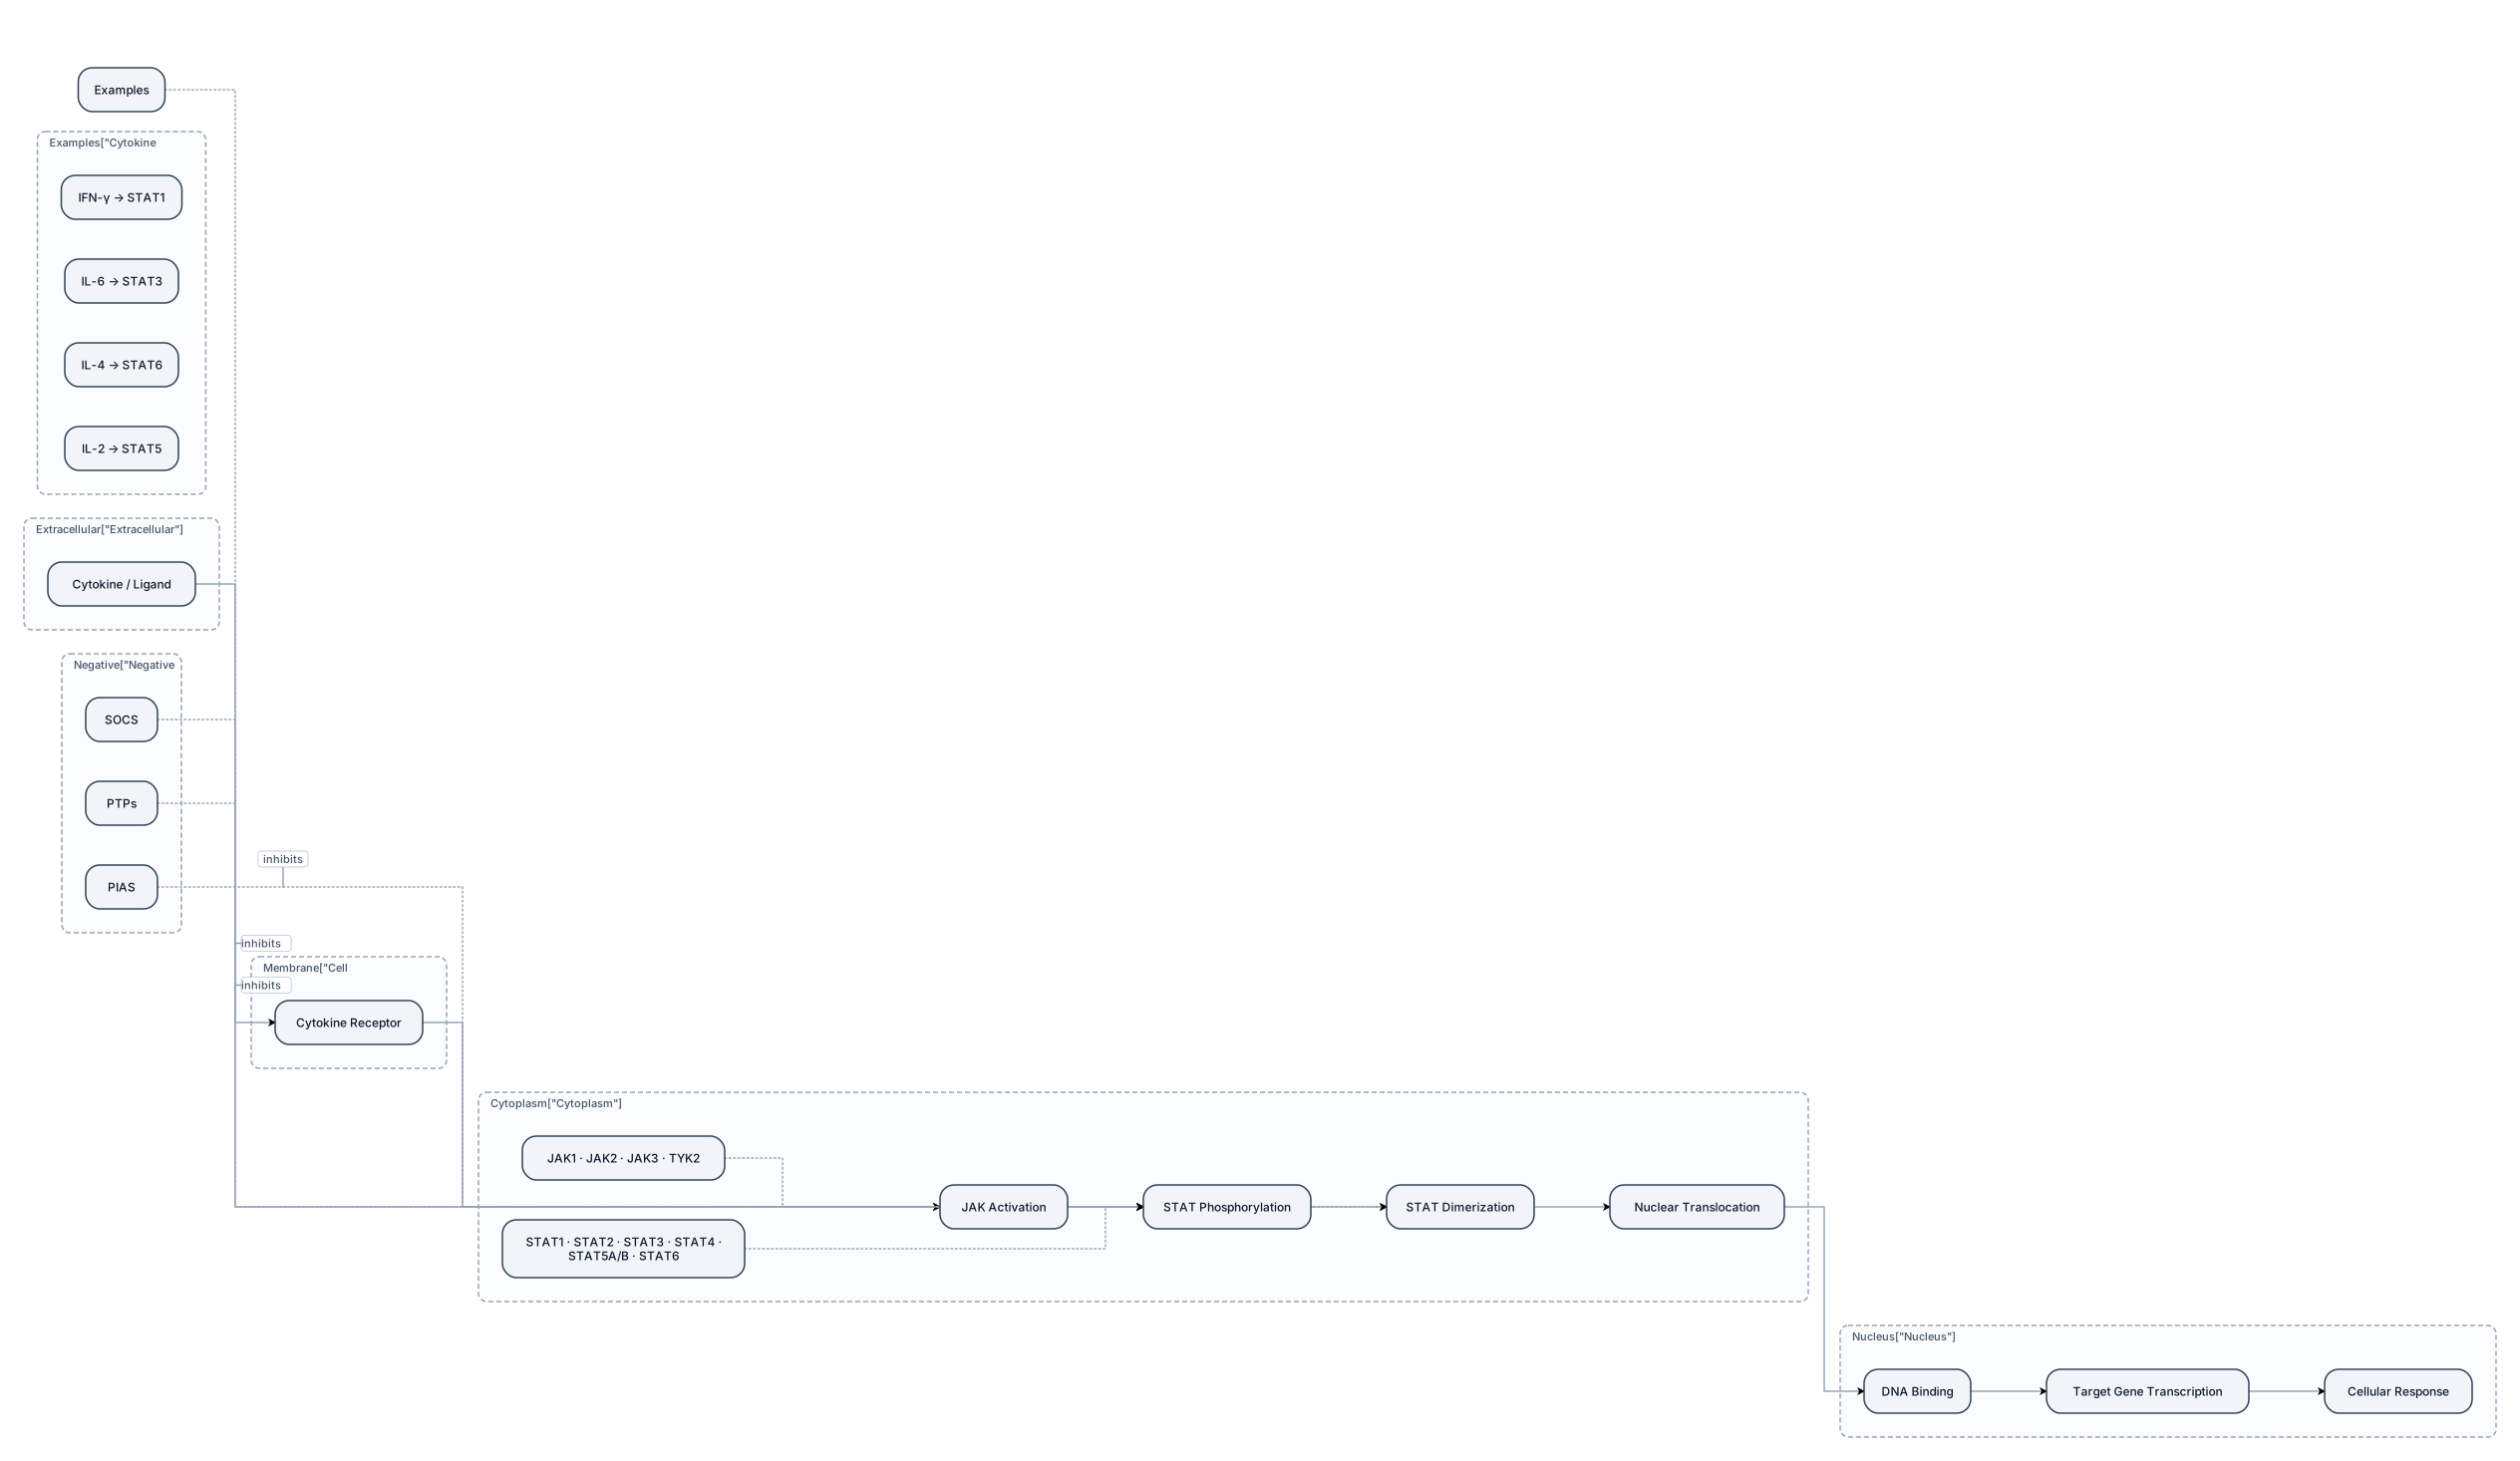
Create a clean, professional scientific pathway diagram for a university Biotechnology presentation showing the canonical JAK–STAT signaling pathway. Use a clear left-to-right or top-to-bottom flow. Show: Extracellular cytokine / ligand ↓ Cytokine receptor on the cell membrane ↓ JAK activation ↓ STAT phosphorylation ↓ STAT dimerization ↓ Nuclear translocation ↓ DNA binding ↓ Target gene transcription ↓ Cellular response Visually show a cell membrane, cytokine receptor, JAK proteins on the intracellular side, STAT proteins in the cytoplasm, a nucleus, DNA, and target gene expression. Label the main JAK family: JAK1, JAK2, JAK3, TYK2 Label the main STAT family: STAT1, STAT2, STAT3, STAT4, STAT5A/B, STAT6 Add a small side section showing examples: IFN-γ → STAT1 IL-6 → STAT3 IL-4 → STAT6 IL-2 → STAT5 Add subtle negative regulatory elements: SOCS PTPs PIAS Show these as inhibitory regulators of JAK–STAT signaling. Style: clean academic scientific diagram, white background, dark navy and subtle teal accents, professional typography, thin arrows, minimal decoration, balanced spacing, clear labels, suitable for a PowerPoint presentation. Do not use cartoon characters, 3D effects, neon colors, futuristic UI, or decorative stock imagery. The final result should look like a scientific textbook/review-paper pathway figure, not an AI-generated infographic.
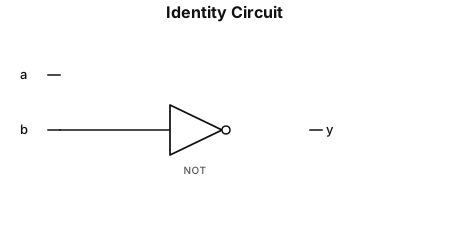
A logic gate circuit with 2 input lines (a and b) and one output line and the output line = 1 if and only is line a = 1 (use AND, OR, and NOT gates)
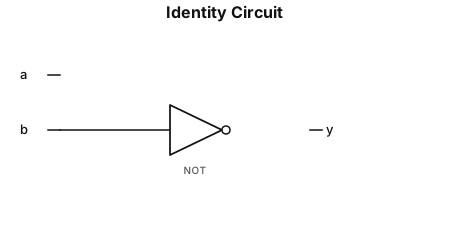
A logic gate circuit with 2 input lines (a and b) and one output line and the output line = 1 if and only is line a = 1 (use And, OR, and NOT gates)
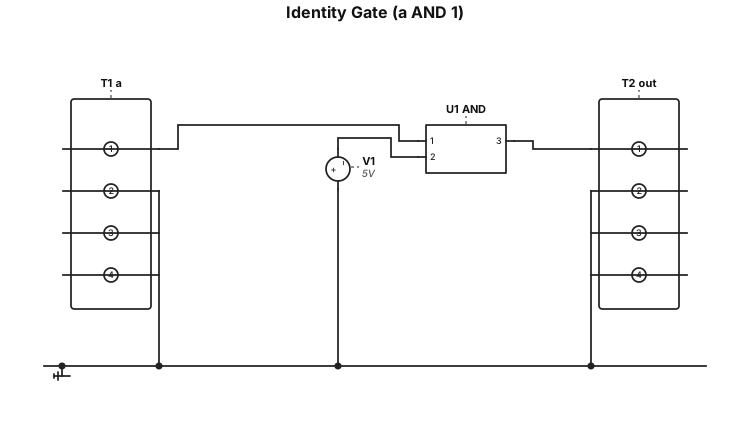
Give me a circuit diagram for a circuit that has 2 input lines (a and b) and one output line and the output line = 1 if and only if a = 1 (use AND, OR, and NOT gates)