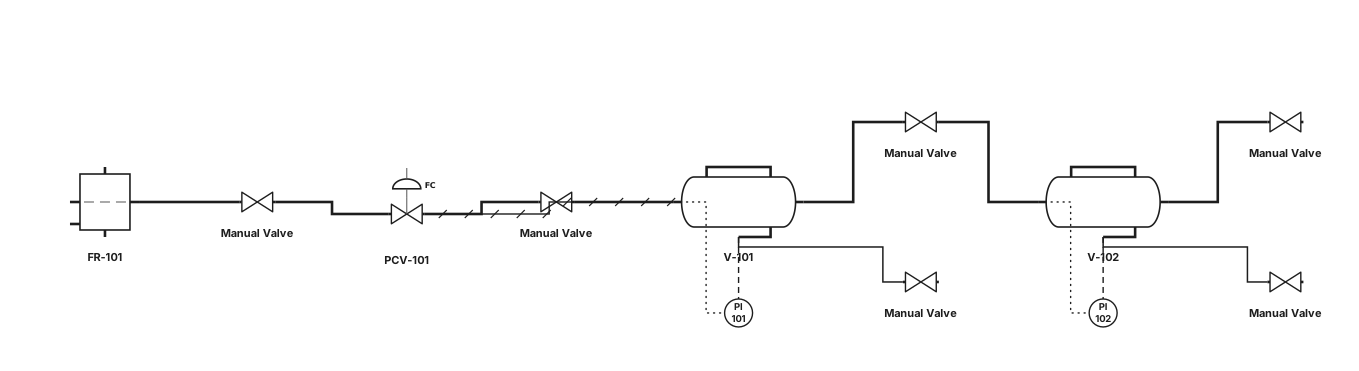
Create a standard ISA P&ID from the attached photograph of a two-vessel pressure control unit. Identify and represent only the visible process equipment: two horizontal pressure vessels, pressure gauges, inlet filter/regulator, manual valves, pressure regulating/control valve, process piping, and vessel drains. Use standard ISA symbols and tags V-101, V-102, PI-101, PI-102, FR-101 and PCV-101. Show the upper vessel above the lower vessel and reproduce the approximate physical piping arrangement shown in the photograph. Use solid process lines and dashed instrument signal lines. Do not invent flow connections, instruments, or safety valves that cannot be identified from the photograph. Produce a clean black-and-white engineering P&ID suitable for an academic report.
Diagram Examples from Real Visitor Prompts
Browse eligible diagrams shared by FreeDiagram visitors, inspect the exact prompts, and build your own version.
Browse 3289 real creationsAll visitor creations
Showing 1345–1368 of 3289. No stock examples or system defaults. Choose a tool, study a real result, then reopen its prompt as your starting point.
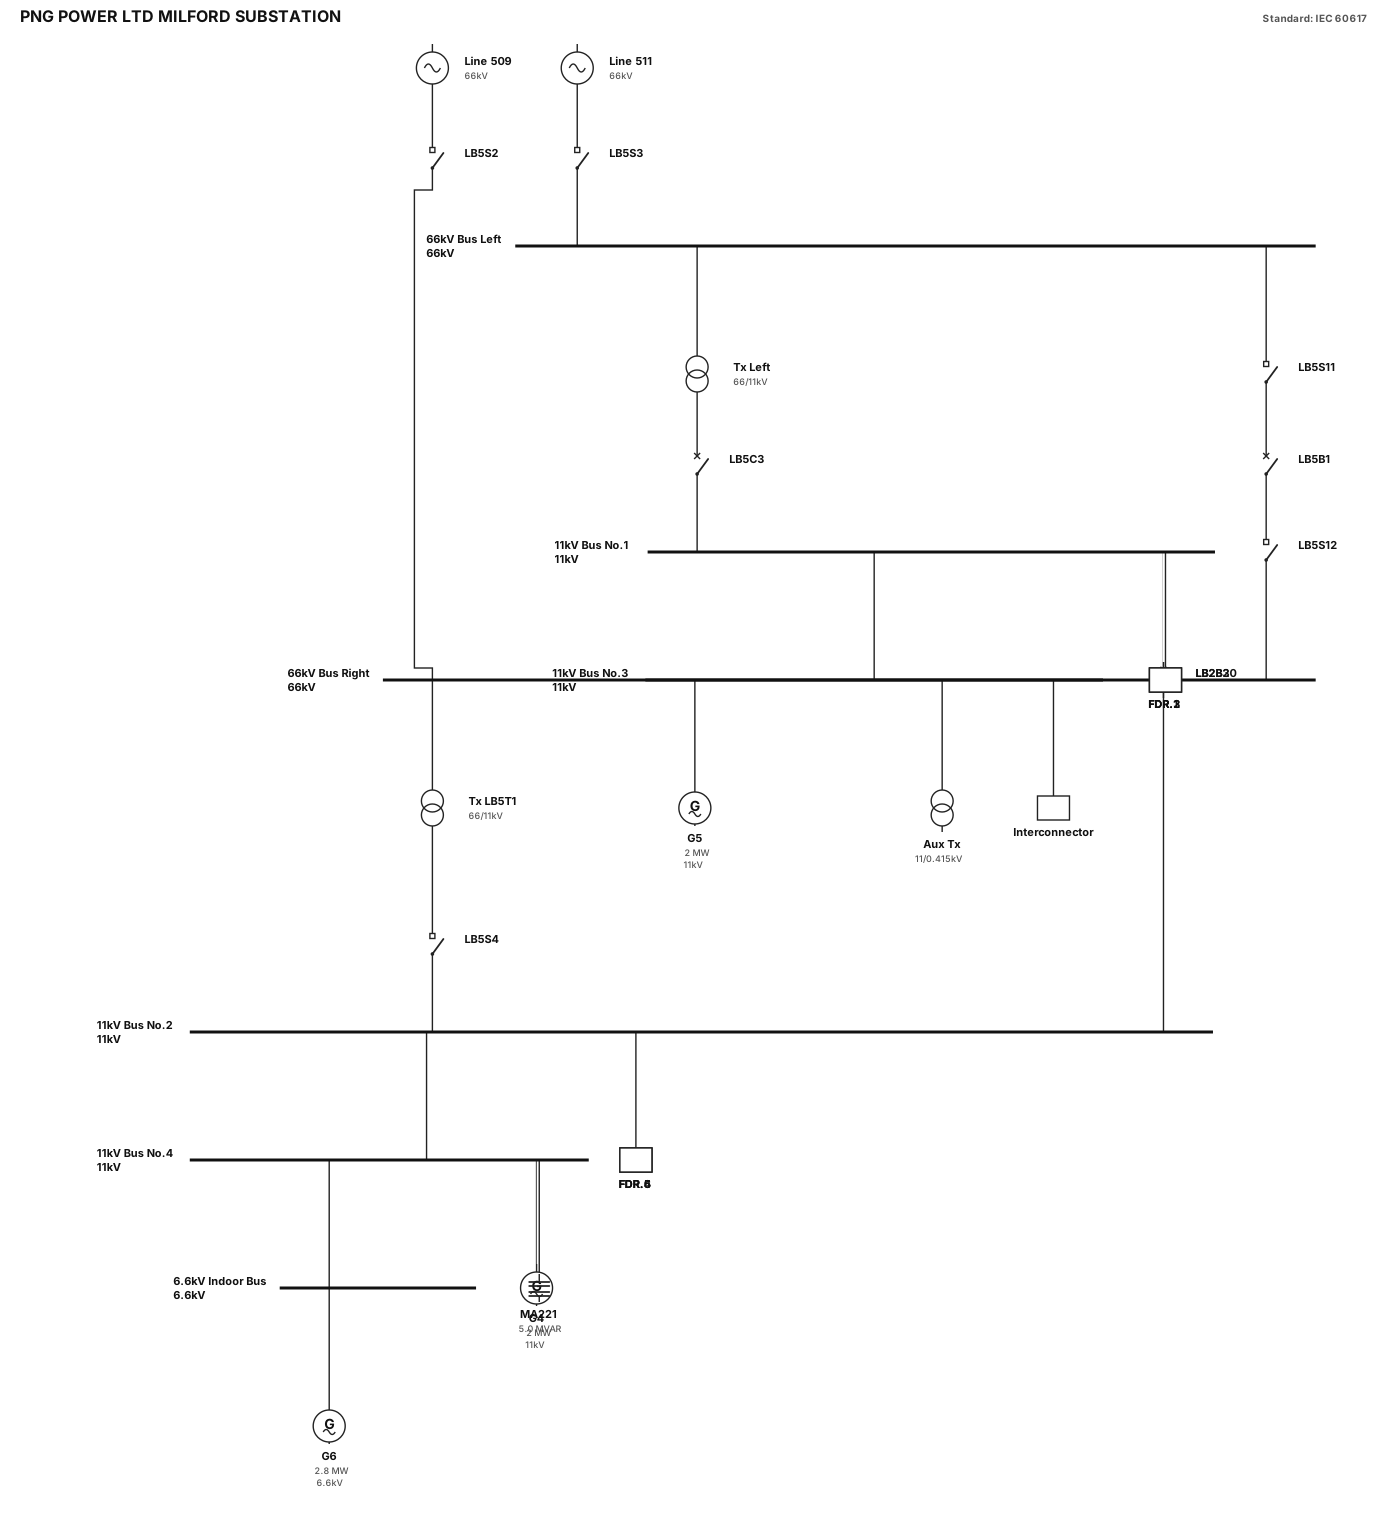
Technical report Single-Line Diagram for "PNG POWER LTD MILFORD SUBSTATION", clean black lines on white background, standard IEC/IEEE symbols: - 66kV Sectionalized Busbar: Single horizontal bar split in the middle by in-line isolator LB5S11, breaker LB5B1, and isolator LB5S12. - Incomers: Top line 511 (with LB5S3) feeds left 66kV bus; line 509 (with LB5S2) feeds right 66kV bus. - Transformers: Left 66/11kV Tx fed via breaker LB5C3 to 11kV Bus 1; Right 66/11kV Tx LB5T1 fed via isolator LB5S4 to 11kV Bus 2. - 11kV Main Buses: Bus No.1 and Bus No.2 parallel below. Connected vertically by Bus Coupler LB2B2 and Bus Tie LB2B30. - Feeders: Exactly 6 outgoing feeders at bottom labeled FDR.1, FDR.2, FDR.3 (on Bus 1) and FDR.4, FDR.5, FDR.6 (on Bus 2). - Extension Buses: 11kV Bus No.3 & No.4 with Generators G5 (2MW) and G4 (2MW), Aux Tx, MA221 5.0 MVAR, Interconnector line, and 6.6kV Indoor Bus with Generator G6 (2.8MW). Style: Engineering schematic, sharp black lines, clean orthogonal routing, horizontal busbars, proper IEC text labels.
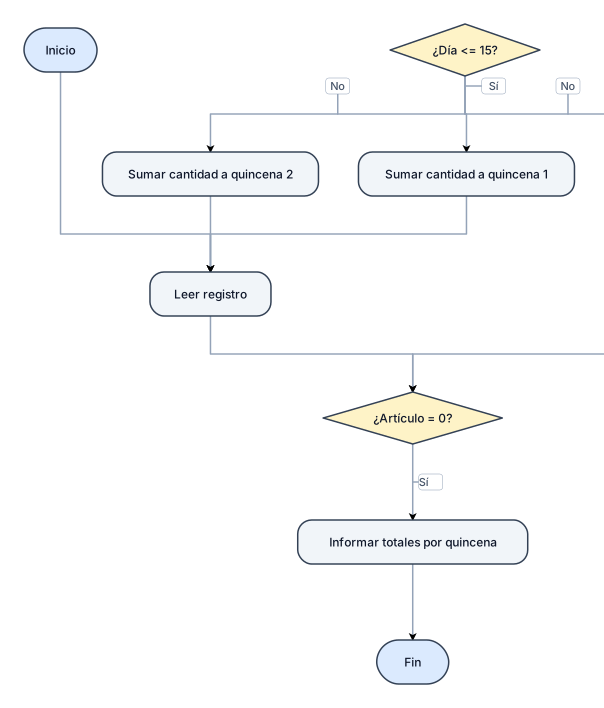
Una empresa registró las ventas que realizó durante el mes anterior. Para cada venta se tienen los siguientes datos: Número de artículo (1 a 10) Día (1 a 31) Cantidad de artículos vendidos Precio de costo. Precio de venta. Este lote finaliza con un registro con número de artículo igual a cero. Los registros están agrupados por número de artículo. Se pide determinar e informar: b) La cantidad total de artículos vendidos en cada quincena sin tener en cuenta los artículos de los que no se hayan registrado ventas
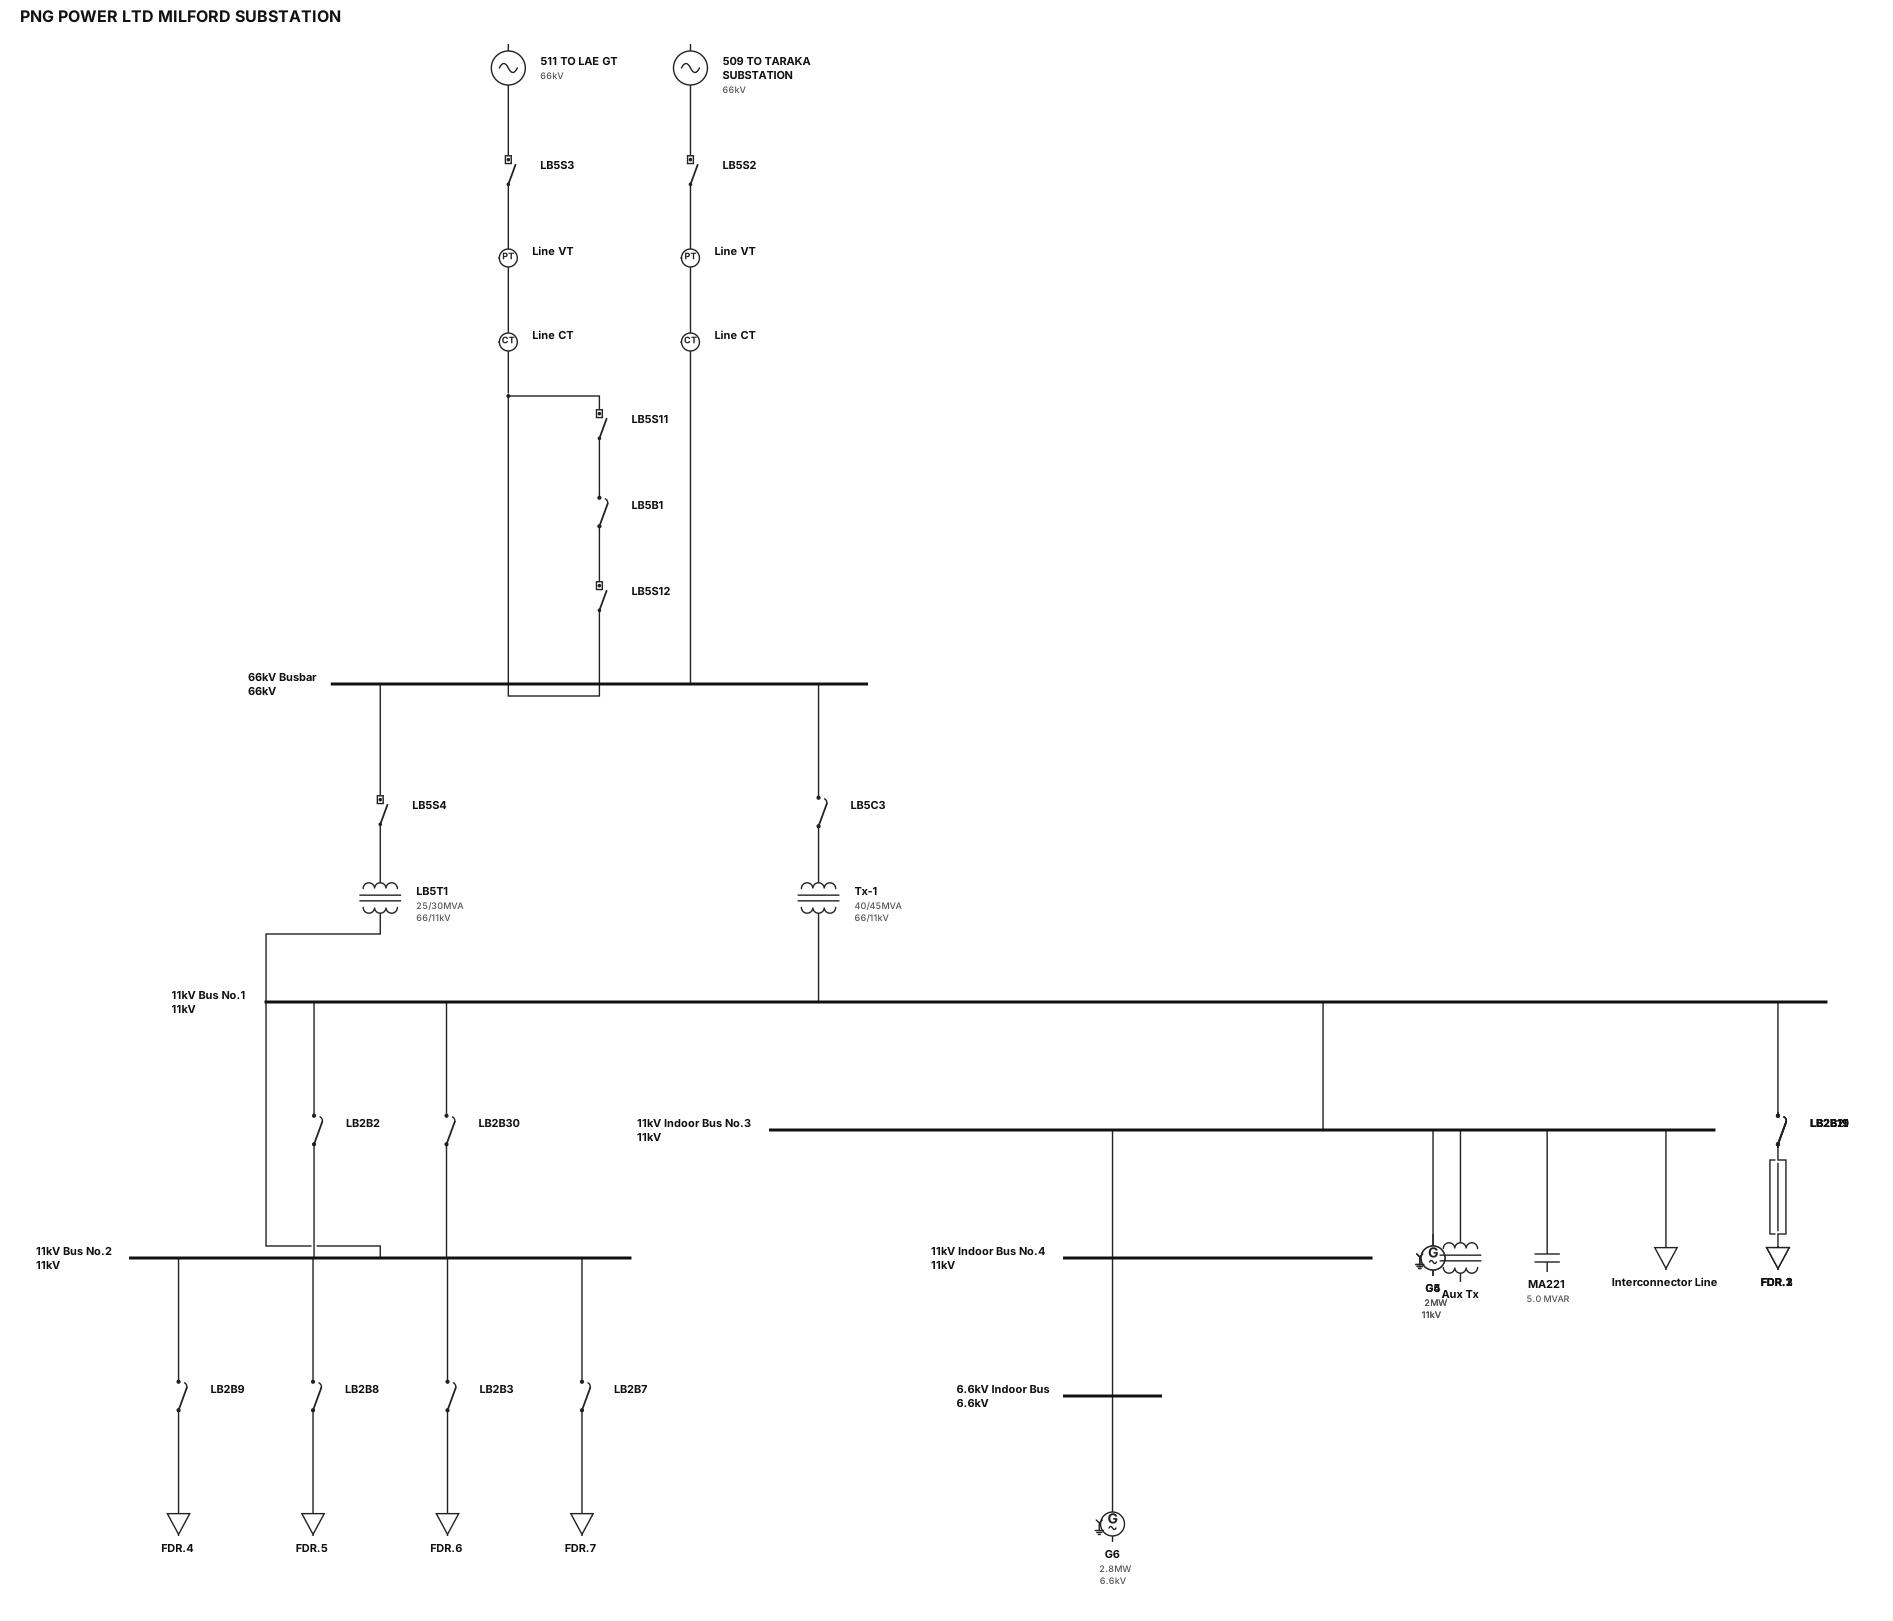
SCADA single-line diagram vector for "PNG POWER LTD MILFORD SUBSTATION" on dark gray background. Exact topology: - Top Lines: Incomers "511 TO LAE GT" and "509 TO TARAKA SUBSTATION" with isolators LB5S3, LB5S2, and line VT/CTs. - 66kV Busbar: Horizontal line with bus sectionalizer breaker "LB5B1" flanked by isolators LB5S11 & LB5S12. - Power Transformers: Left 66/11kV 40/45MVA Tx via breaker LB5C3; Right 66/11kV 25/30MVA Tx "LB5T1" via isolator LB5S4. - 11kV Busbars: Bus No.1 & Bus No.2 (connected via bus coupler LB2B2 and bus tie LB2B30) feeding Feeders FDR.1 to FDR.6 (breakers LB2B21, LB2B19, LB2B11, LB2B9, LB2B8, LB2B3, LB2B7). - Right Extensions: 11kV Indoor Bus No.3 & No.4 with Generators G5 (2MW) & G4 (2MW), Aux Tx, MA221 5.0 MVAR, Interconnector line, and 6.6kV Indoor Bus with G6 (2.8MW). Style: Flat vector, orthogonal 90-degree lines, crisp white labels. ALL breakers, isolators, and switches MUST be rendered as simple solid black square blocks with clean borders.
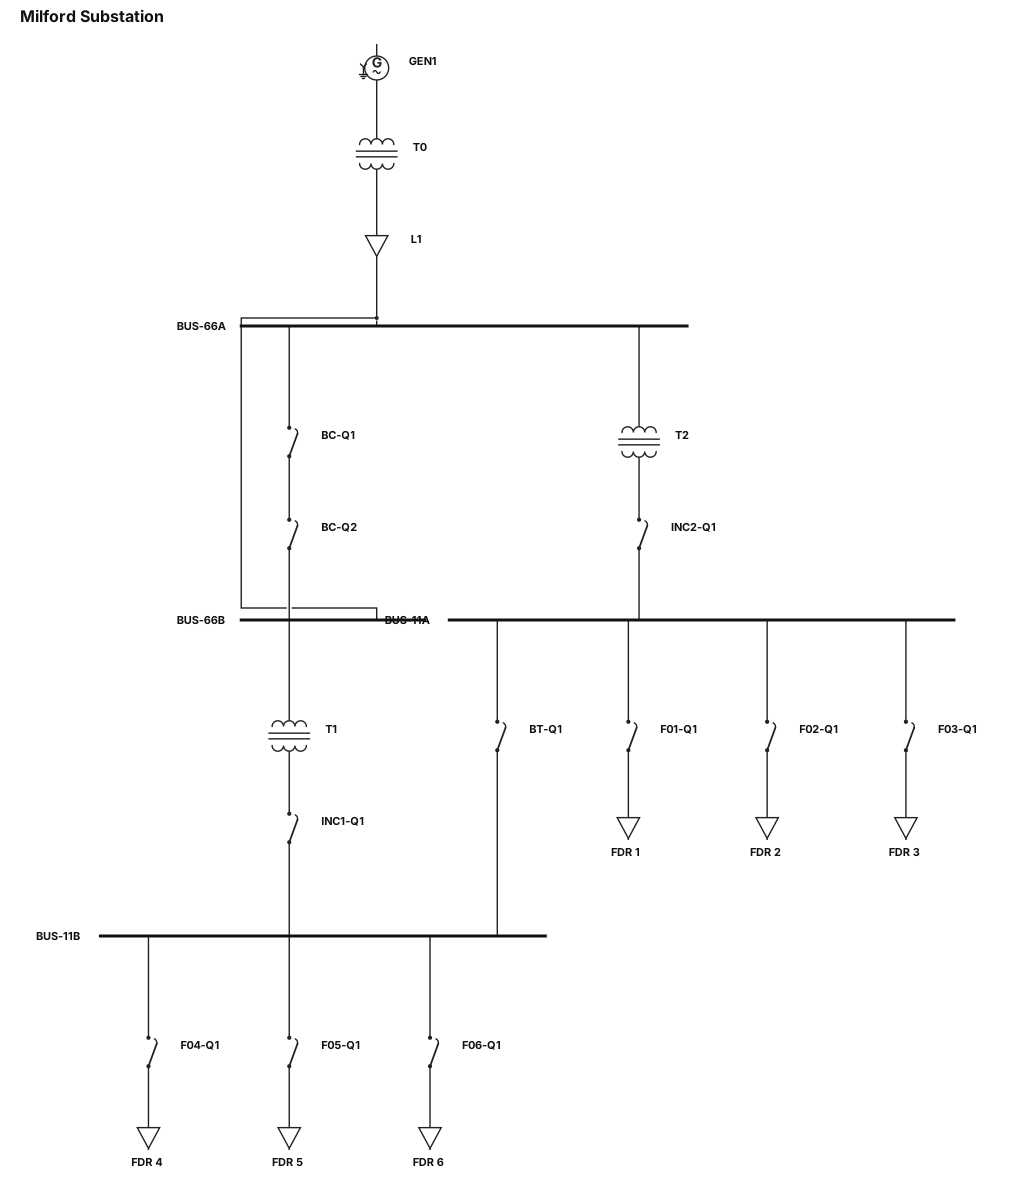
Industrial SCADA single-line diagram for "Milford Substation" on dark gray background. Top-to-bottom layout: - Top: Generator "GEN1" -> Transformer "T0" -> Line "L1" -> 66kV Busbars ("BUS-66A", "BUS-66B"). - Bus Coupler between 66kV busbars with two black square breaker blocks "BC-Q1", "BC-Q2". - Transformers "T2" (from BUS-66A) and "T1" (from BUS-66B) feed 11kV busbars ("BUS-11A", "BUS-11B") via black square incomer breakers "INC2-Q1" and "INC1-Q1". - Bus Tie between 11kV busbars with one black square breaker "BT-Q1". - Bottom Feeders: 6 outgoing lines with black square breakers "F01-Q1" to "F06-Q1" ending in load boxes "FDR 1" to "FDR 6". Style: Flat vector, 90-degree lines, clean white labels. ALL breakers/switches MUST be solid black squares with clean borders.
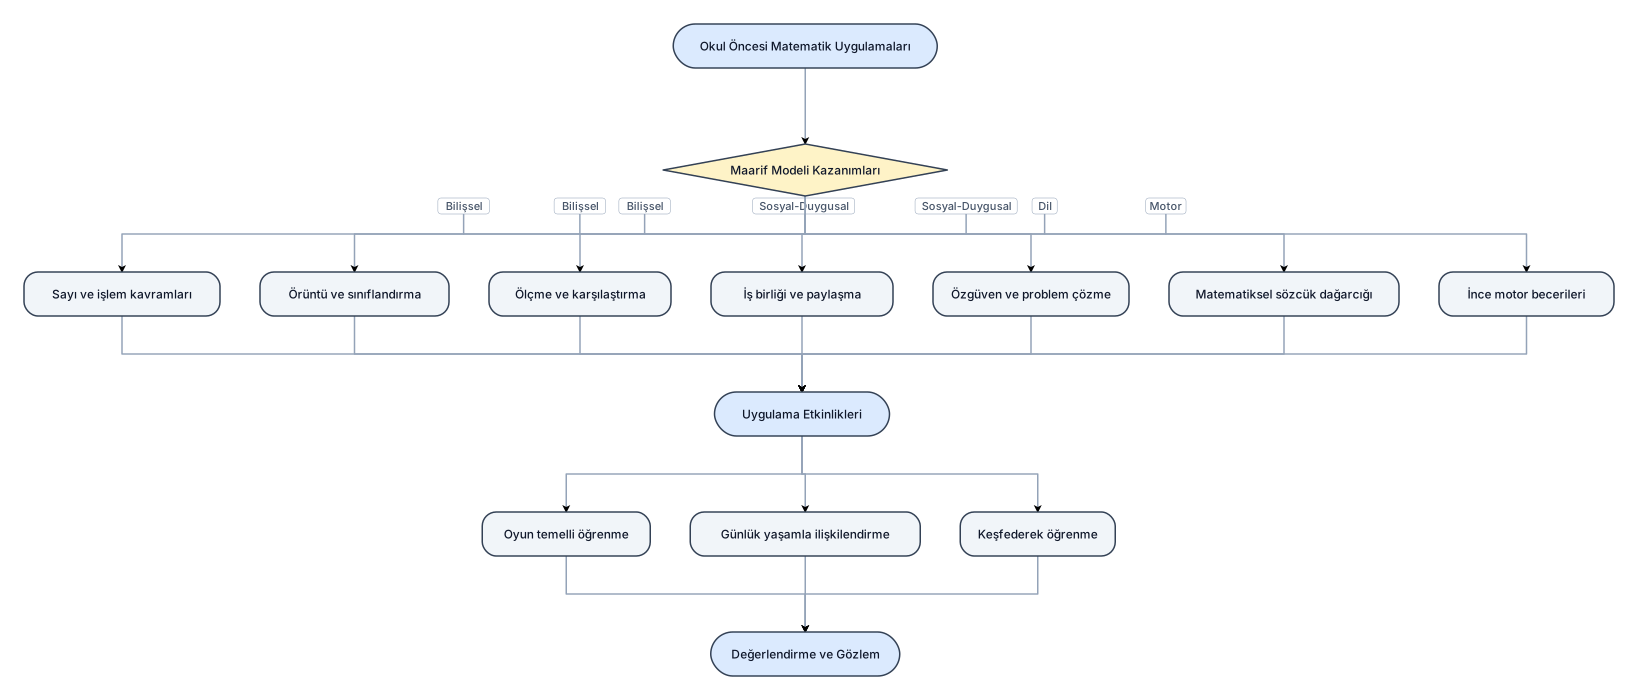
okulöncesinde matematik uygulamalarının,maarif modelinin kazanımları
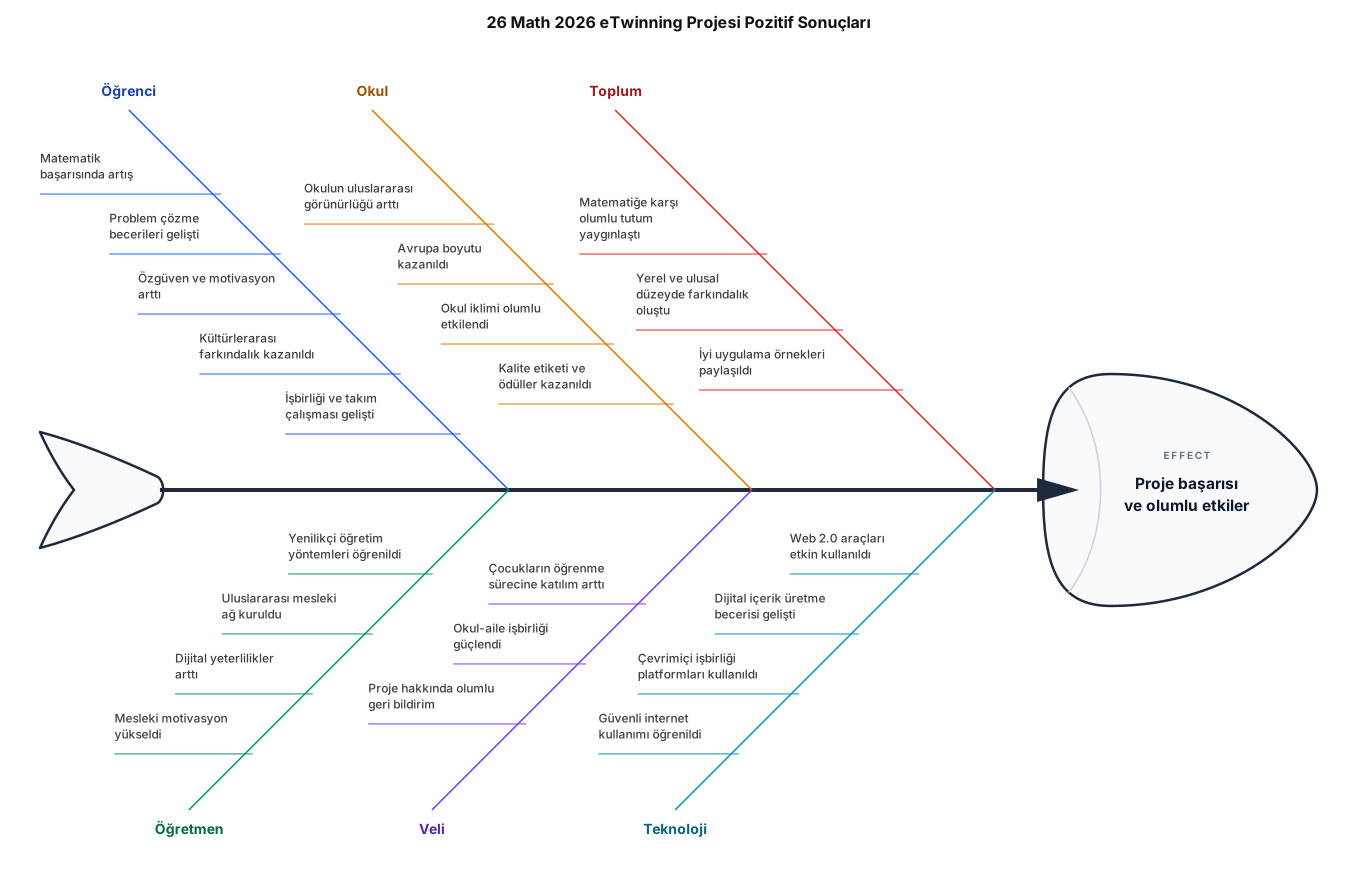
26 math 2026 eTwinning projesinin pozitif sonuçları
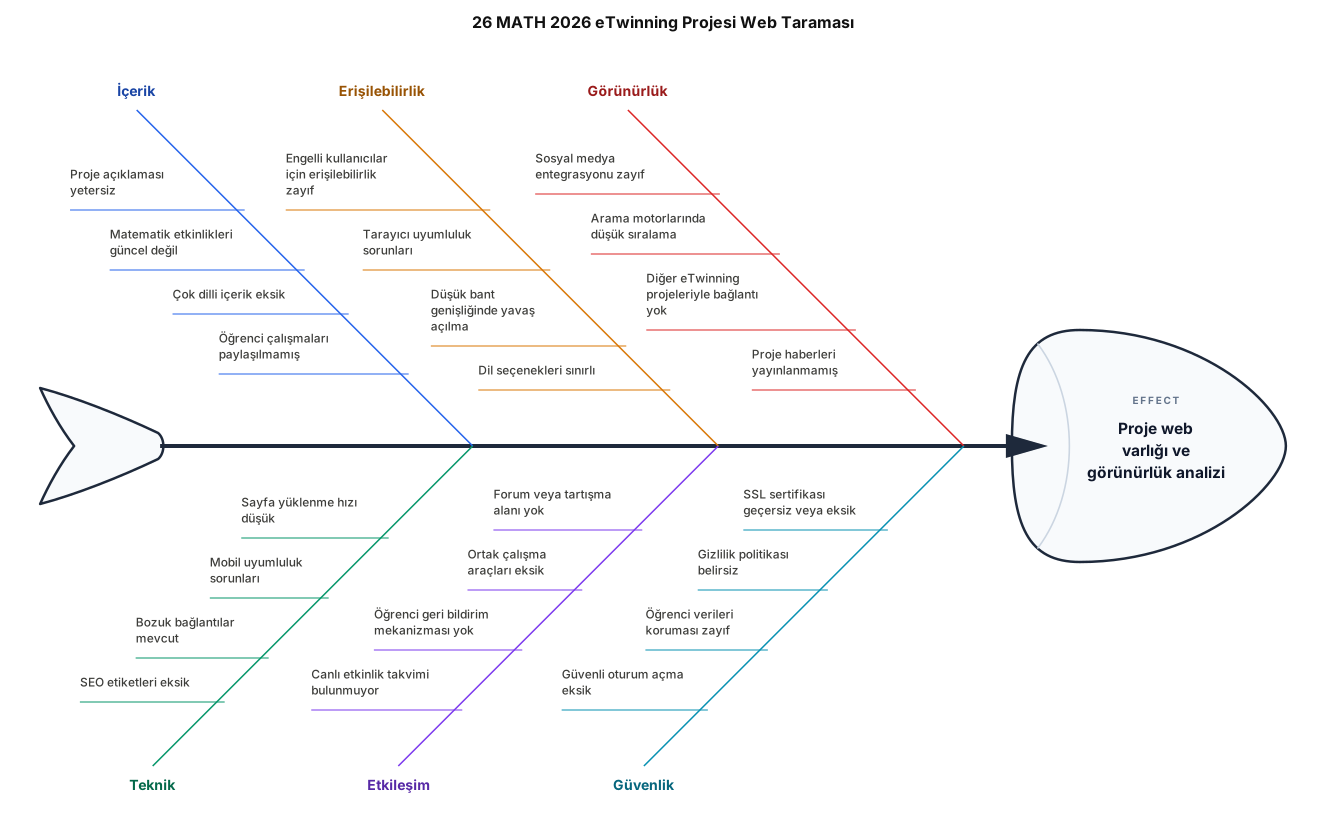
26 MATH 2026 etwinning projesini web te tara ve sonuçlarını göster
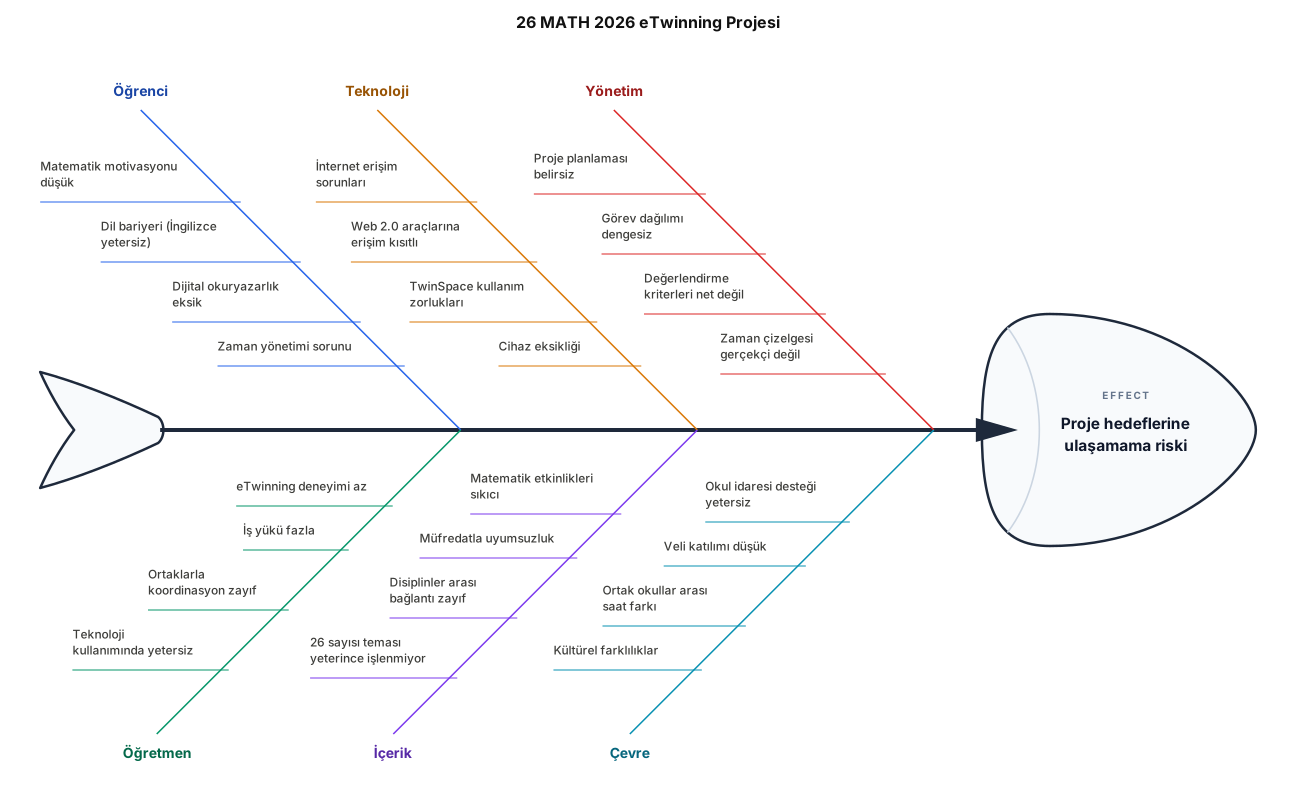
26 MATH 2026 etwinning projesi
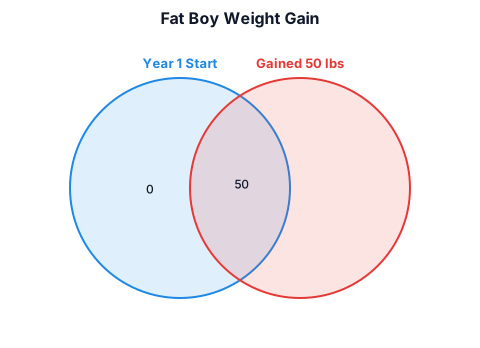
Fat boy gained 50lbs in 1 year
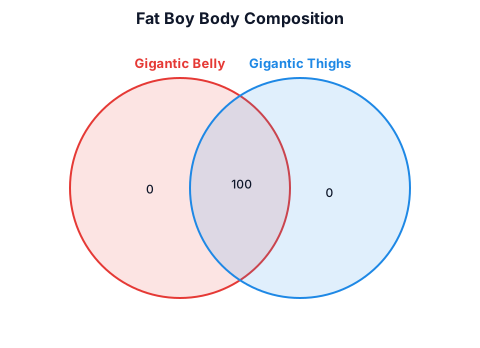
Fat boy with gigantic belly and gigantic thighs
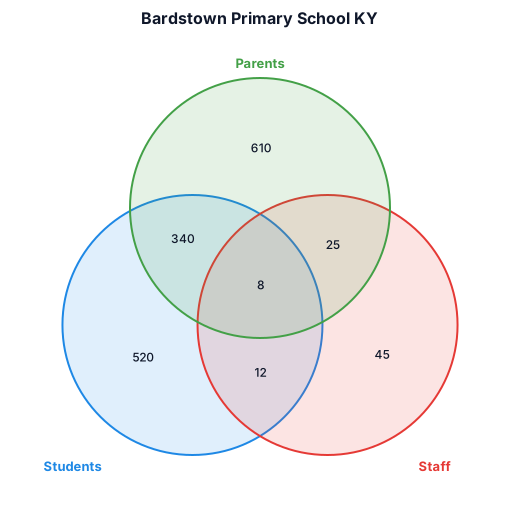
Bardstown primary school ky
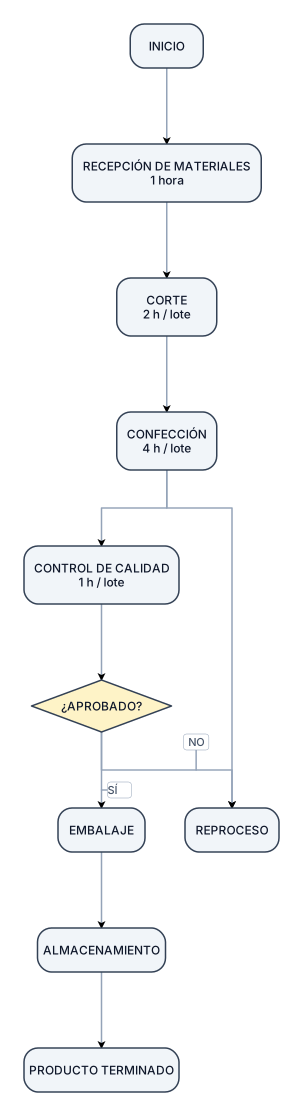
INICIO │ ▼ ┌─────────────────┐ │ RECEPCIÓN DE │ │ MATERIALES │ │ 1 hora │ └────────┬────────┘ │ ▼ ┌─────────────────┐ │ CORTE │ │ 2 h / lote │ └────────┬────────┘ │ ▼ ┌─────────────────┐ │ CONFECCIÓN │ │ 4 h / lote │ └────────┬────────┘ │ ▼ ┌─────────────────┐ │ CONTROL │ │ DE CALIDAD │ │ 1 h / lote │ └────────┬────────┘ │ ¿APROBADO? / \ NO SÍ │ │ ▼ ▼ REPROCESO EMBALAJE │ ▼ ALMACENAMIENTO │ ▼ PRODUCTO TERMINADO
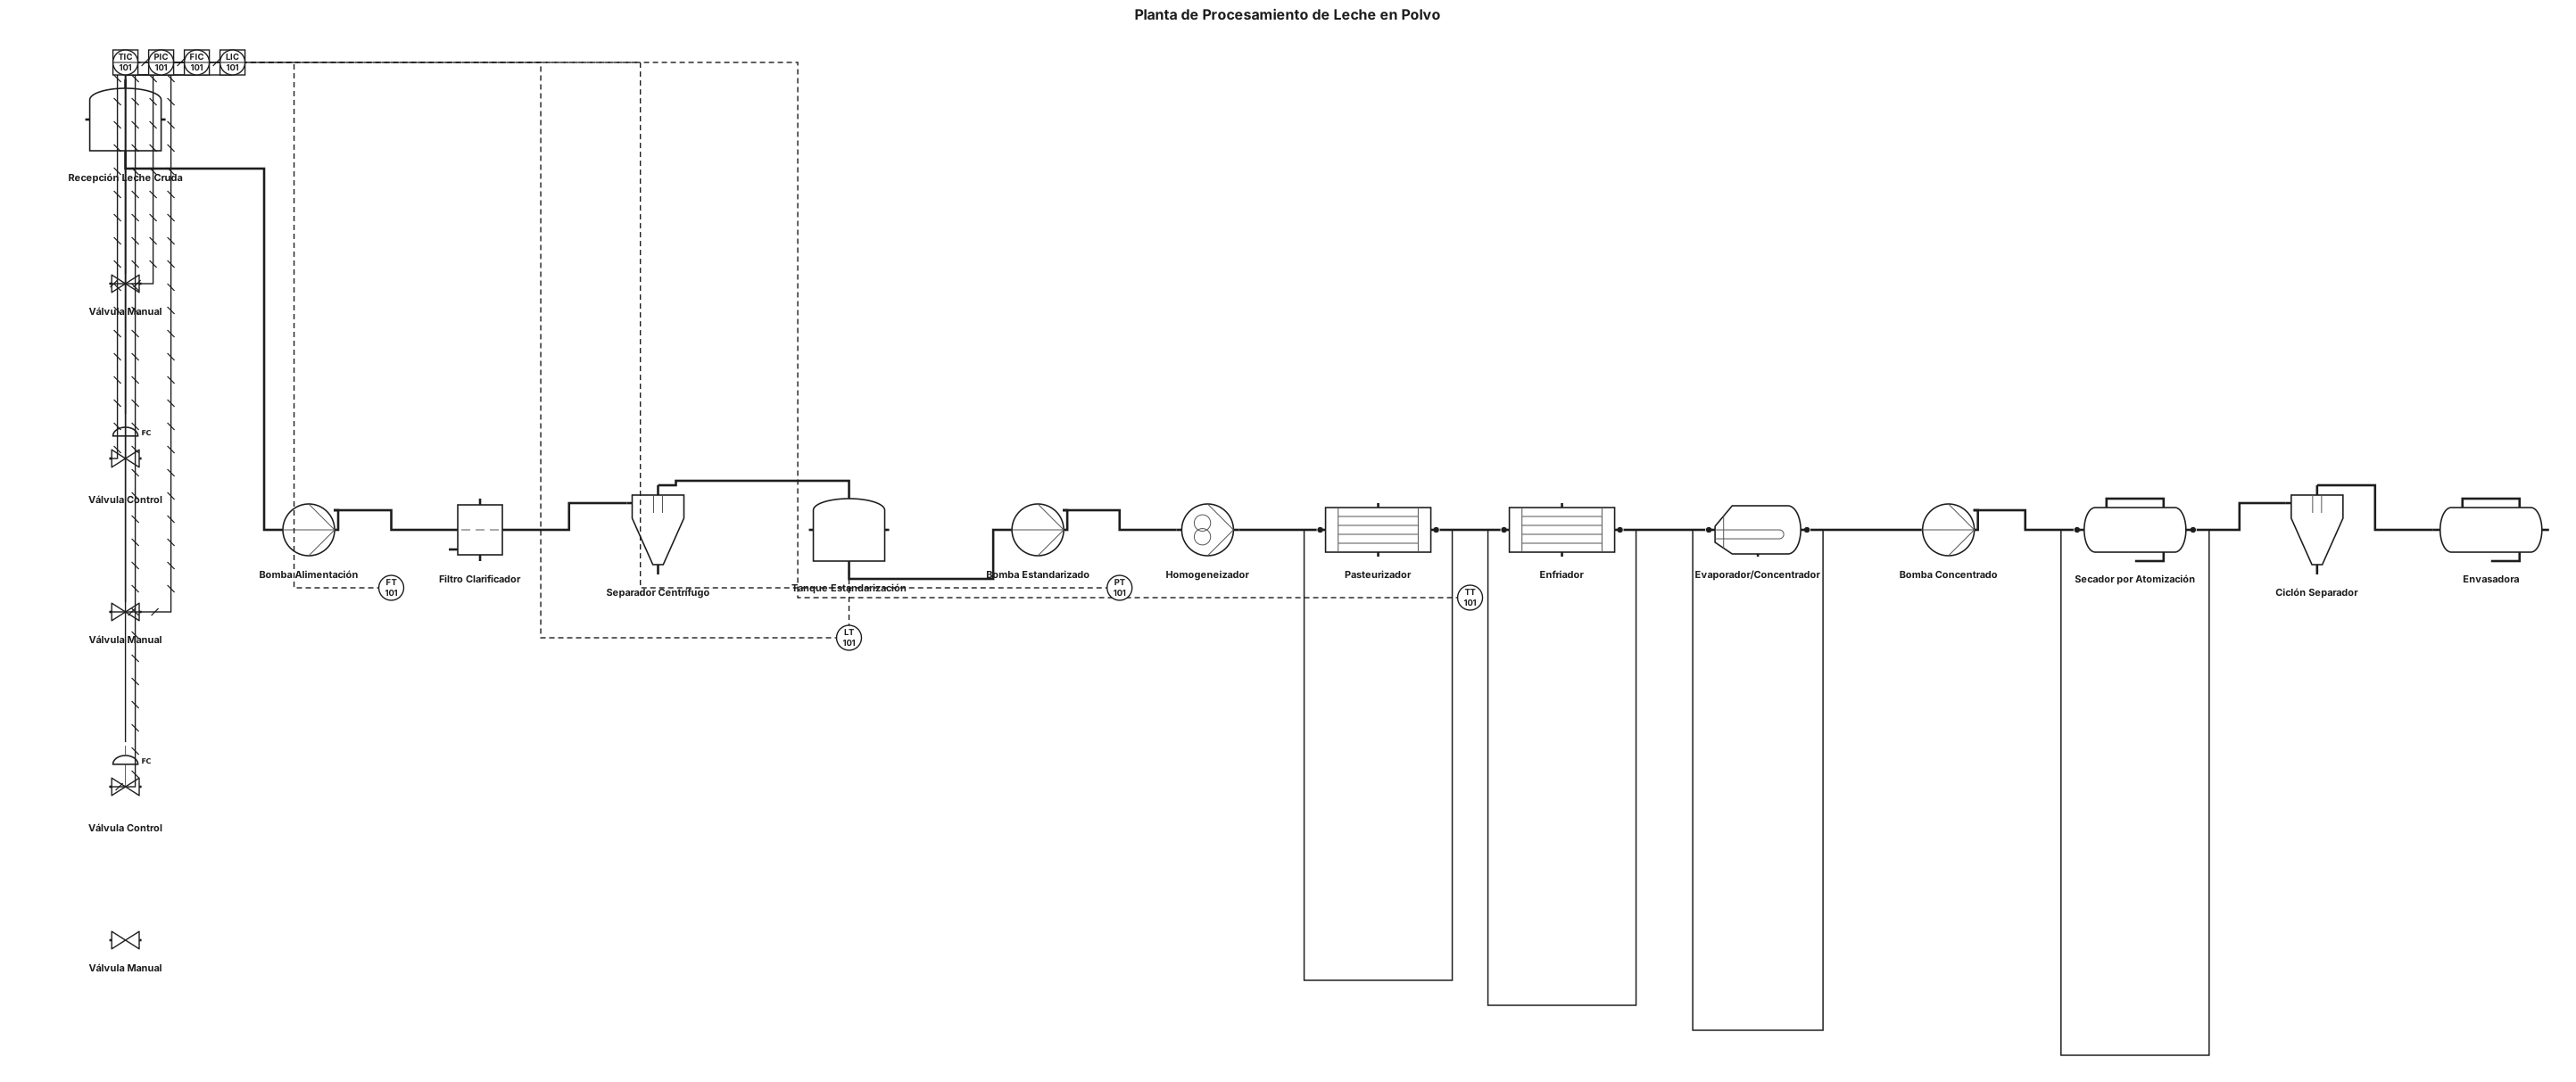
Recepción de leche cruda → Filtración y clarificación → Desnatado/separación centrífuga → Tanque de estandarización → Homogeneización → Pasteurización y enfriamiento → Concentración/evaporación → Secado por atomización → Ciclón separador → Envasado. Utiliza simbología estándar de DTI/P&ID para: * Tanques * Bombas * Filtros * Separador centrífugo * Homogeneizador * Intercambiador de calor * Evaporador/concentrador * Secador por atomización * Ciclón separador * Envasadora * Válvulas manuales y de control * Instrumentos de temperatura, presión, flujo y nivel Conecta los equipos mediante tuberías, colocando flechas que indiquen la dirección del flujo. Mantén las líneas de servicios (vapor, agua de enfriamiento y aire) separadas de la línea principal de leche. El diagrama debe ser limpio, horizontal, ordenado y fácil de leer, parecido a un DTI académico de Ingeniería Química. No hagas un diagrama de flujo con cuadros. No agregues equipos que no correspondan al proceso. No hagas circuitos cerrados ni tuberías que regresen innecesariamente a equipos anteriores.
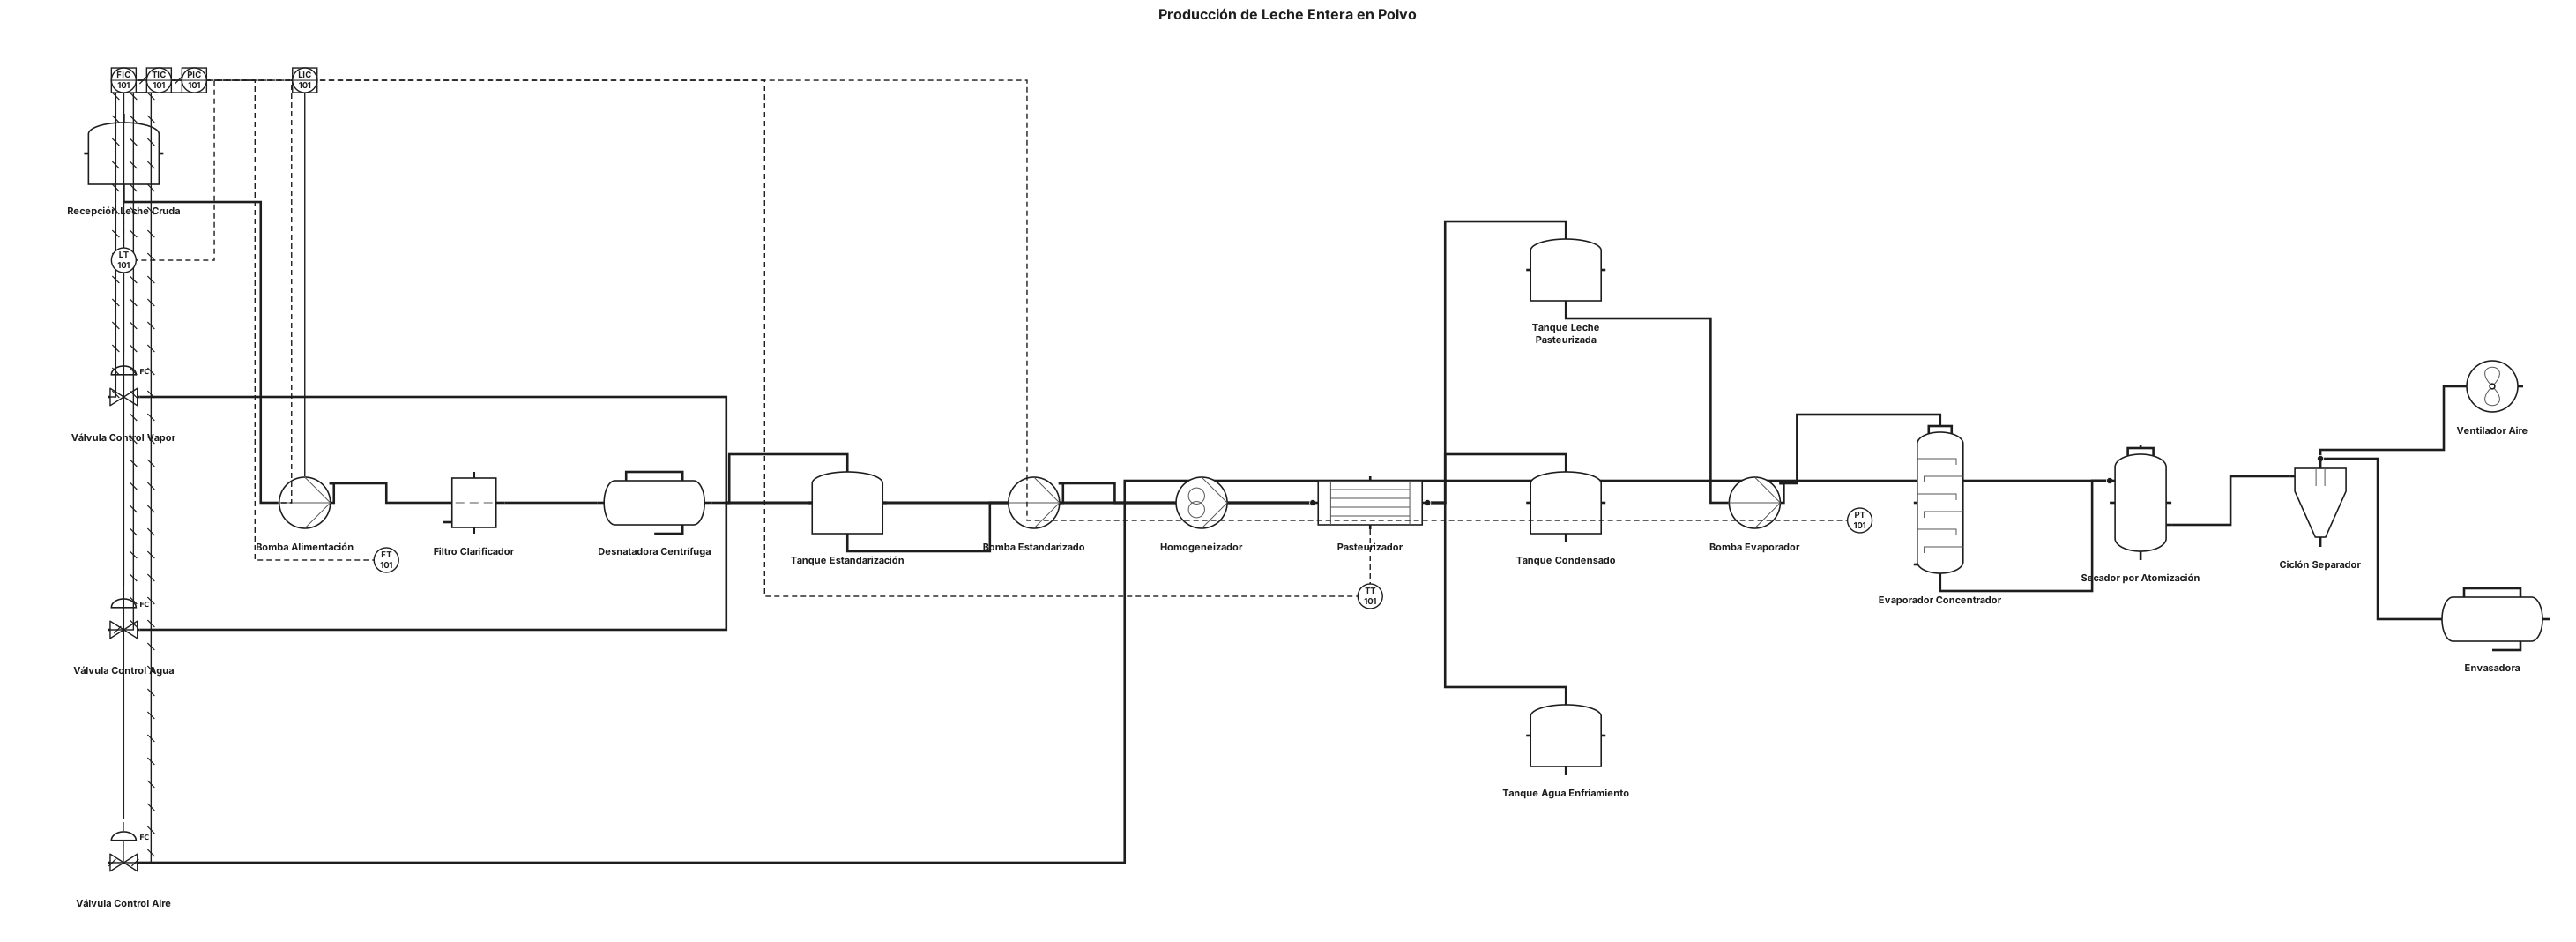
Crea un DTI/P&ID del proceso de producción de leche entera en polvo tomando como referencia la estructura y recorrido de proceso de la imagen proporcionada. Mantén una distribución horizontal y ordenada, con los equipos conectados mediante tuberías y flechas de dirección de flujo. El proceso debe seguir este orden: Recepción de leche cruda → filtración y clarificación → desnatado → estandarización → homogeneización → pasteurización y enfriamiento → concentración/evaporación → atomización/secado → envasado. No lo hagas como un diagrama de bloques simple. Utiliza simbología P&ID/DTI para representar cada equipo, incluyendo: * Tanques * Bombas * Filtros * Separador/desnatadora * Homogeneizador * Intercambiador de calor para pasteurización * Evaporador/concentrador * Secador por atomización * Ventilador * Ciclón o separador de polvo * Envasadora * Válvulas manuales y de control * Indicadores de temperatura, presión, flujo y nivel Agrega las líneas de proceso y de servicios, incluyendo leche, vapor, condensado, agua de enfriamiento, aire caliente y aire húmedo. Coloca flechas indicando el sentido del flujo. Identifica los equipos con etiquetas de ingeniería como T-101, P-101, F-101, E-101, EV-101, SD-101, etc. El resultado debe parecerse en distribución y recorrido a la imagen de referencia, pero debe ser un DTI/P&ID profesional con simbología de ingeniería, no un balance de materia. Ojo: no le pidas que copie los valores de G, SN, A, kg/h, etc. de esa imagen si tu maestra te pidió específicamente un DTI, porque esos son datos del balance de materia. El DTI debe enfocarse en equipos + tuberías + válvulas + instrumentos.
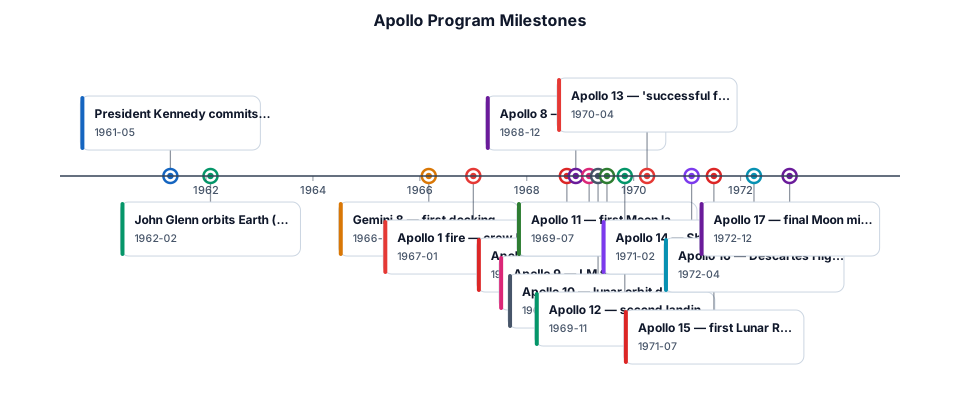
A timeline of the Apollo program's major milestones from 1961 to 1972, including key missions and the first moon landing
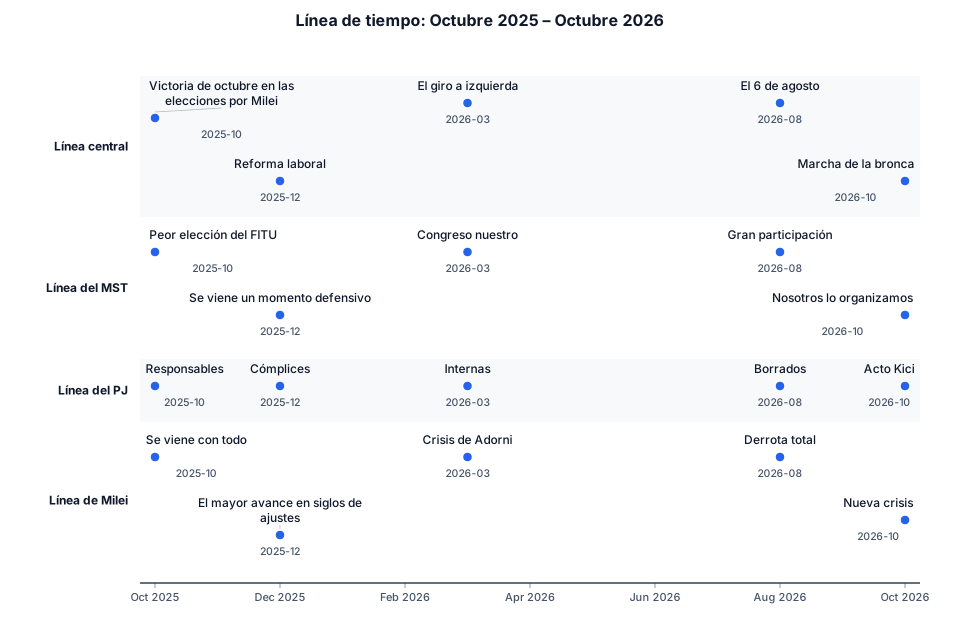
Quiero una linea del tiempo que vaya desde octubre del 2025 a octubre del 2026 que tenga una linea central de acontecimientos y otra 3 lineas de como respondieron distintos sectores. la linea central tendra 1) la victoria de octubre en las elecciones por milei, 2) la reforma laboral, 3) el giro a izquierda, 4) el 6 de agosto y 5)marcha de la bronca. la linea del mst tendra en el 1) peor eleccion del fitu 2) se viene un momento defensivo 3) congreso nuestro 4) gran participacion 5) nosotros lo organizamos. la linea del pj tendra 1) responsables 2) complices 3) internas 4) borrados 5)acto kici la linea de miler 1) se viene con todo 2) el mayor avance en siglos de ajustes 3) crisis de adorni 4) derrota total 5) nueva crisis
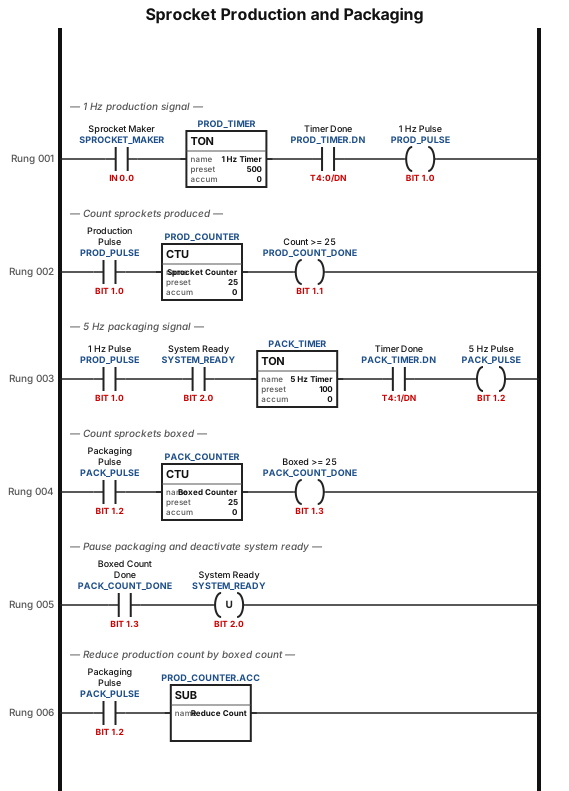
As long as a specific discrete input (SPROCKET_MAKER) is active, a continuous 1 Hz periodic signal is produced. Each sprocket produced will increment a counter. When the number of sprockets meets or exceeds 25, the counter sends an active signal. The count can exceed 25. As long as the incoming 1 Hz discrete signal is active, a continuous 5 Hz periodic signal is produced. The 5 Hz periodic signal will not be produced if a specific discrete signal (SYSTEM_READY) is inactive. Once 25 sprockets have been boxed, the periodic signal pauses and the SYSTEM_READY state changes to inactive. The SYSTEM_READY state must be manually changed from inactive to active before the packaging can continue. Each sprocket boxed reduces total count from the first counter.
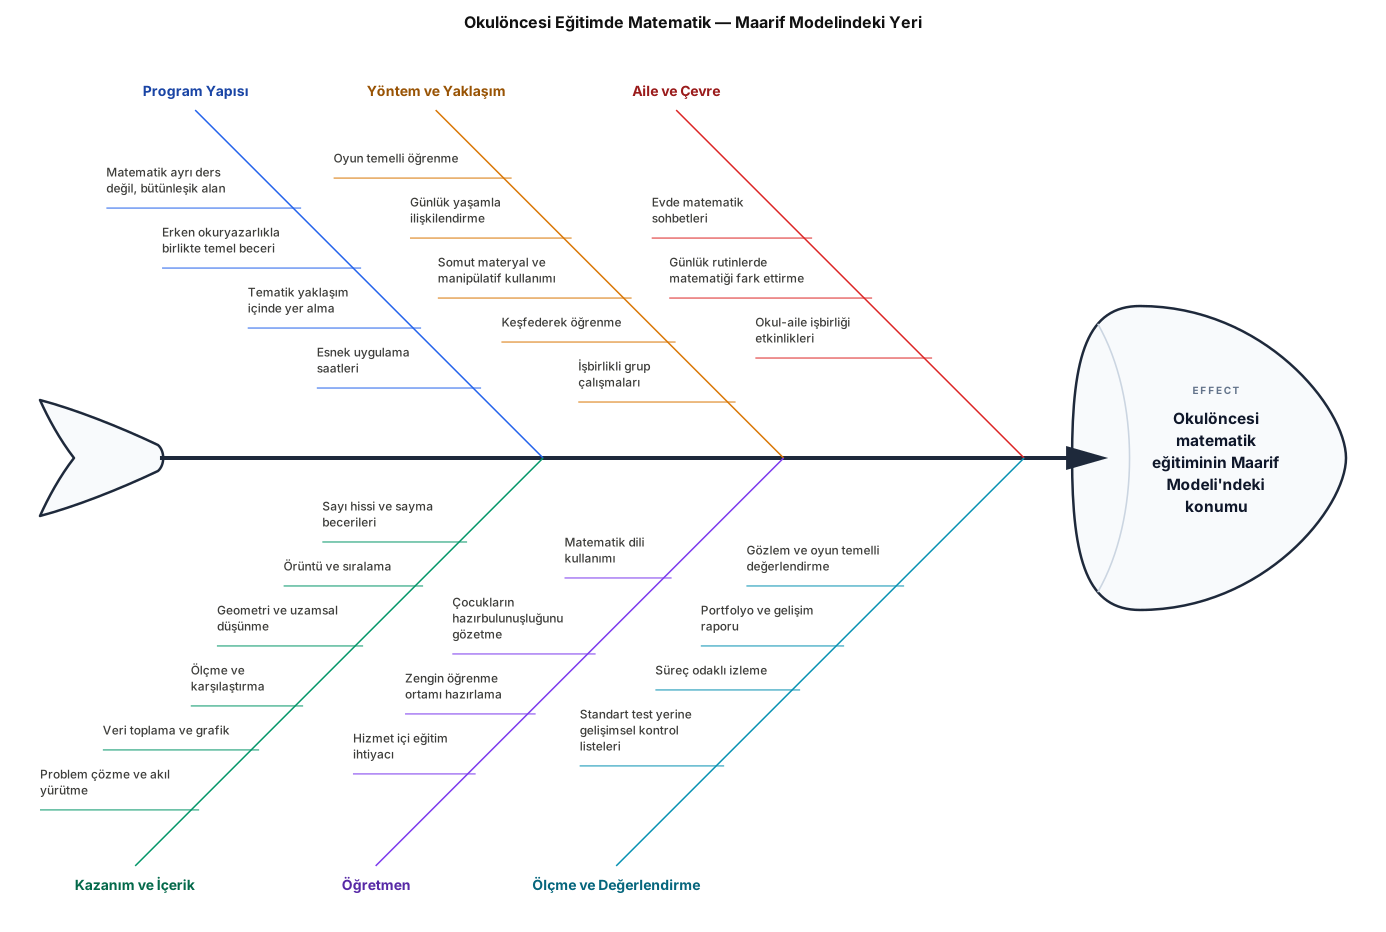
Okulöncesi Eğitimde Matematik .Maarif Modelindeki programdaki yeri
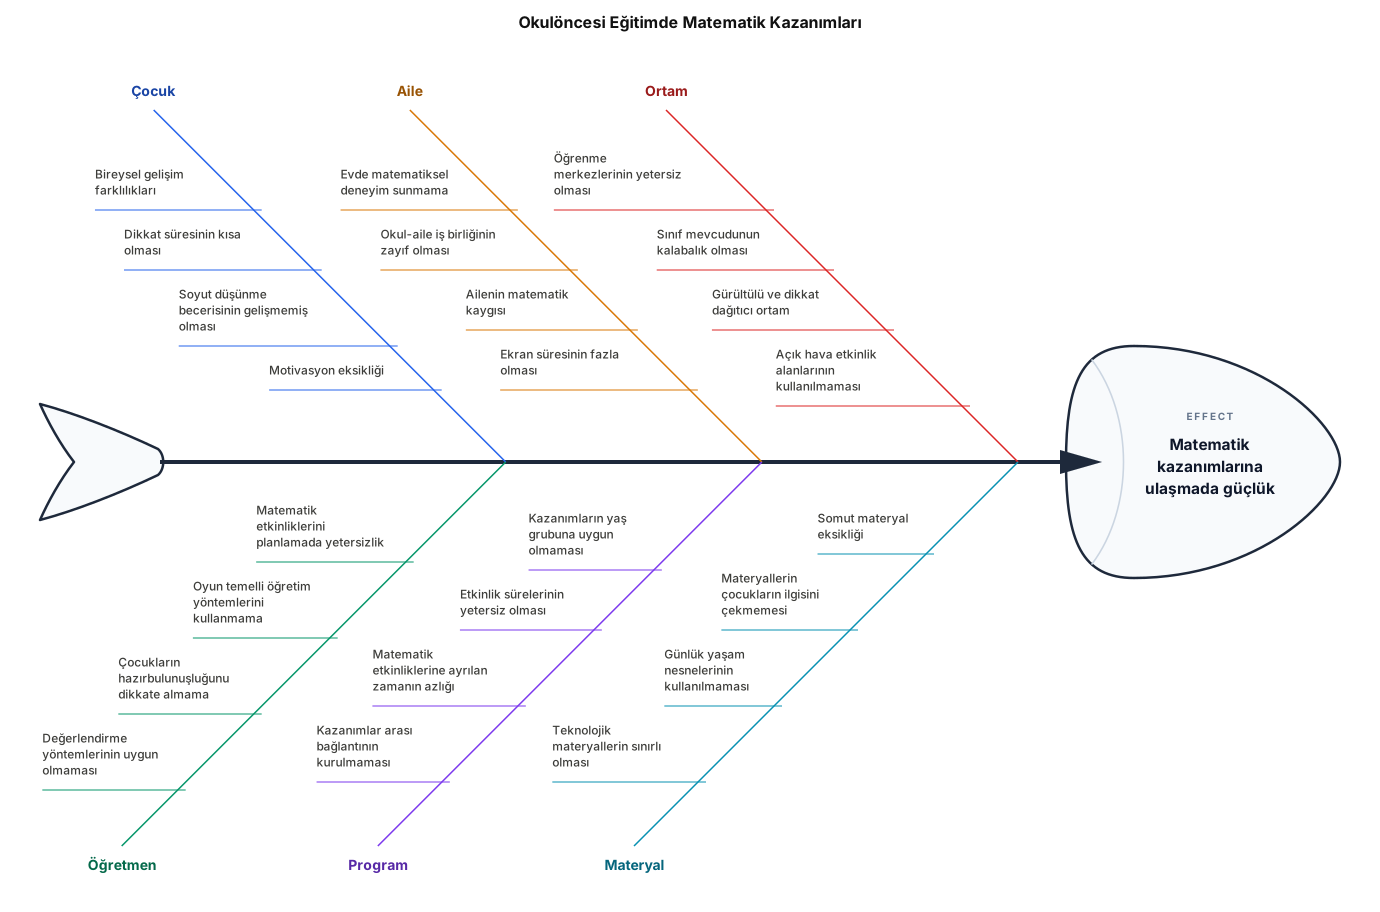
Okulöncesi Eğitimde Matematik Kazanımları
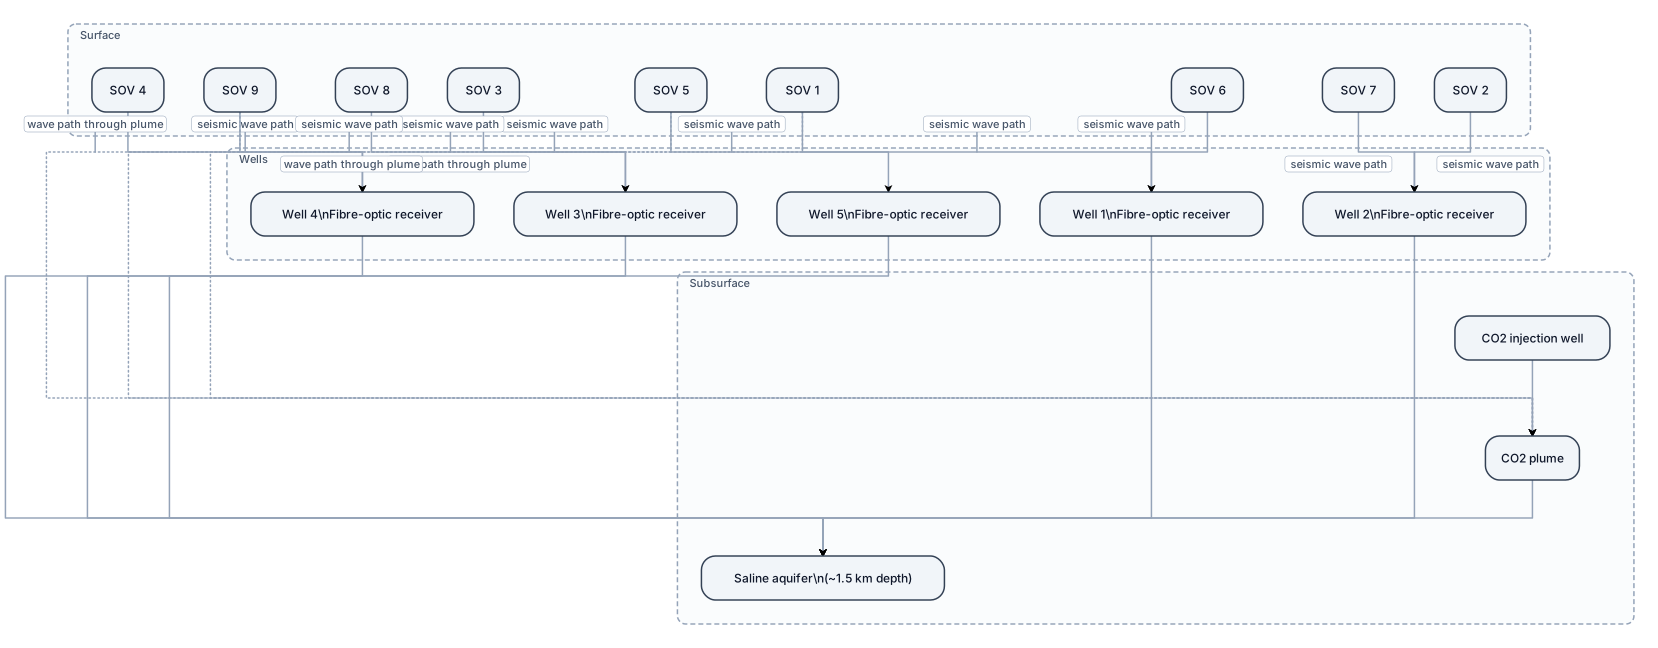
Create a clean scientific geological cross-section of the Otway Stage 3 seismic monitoring system. Show the ground surface with 9 permanent seismic sources (SOVs), 5 vertical monitoring wells containing fibre-optic seismic receivers, and a CO2 injection zone with a CO2 plume in a saline aquifer at about 1.5 km depth. Draw multiple seismic wave paths from the surface sources to the downhole receivers. Show several different source-receiver paths to illustrate 3D monitoring of the CO2 plume. Label all main elements. Use a simple university-level geology presentation style, white background, minimal text, clear arrows and no decorative elements.
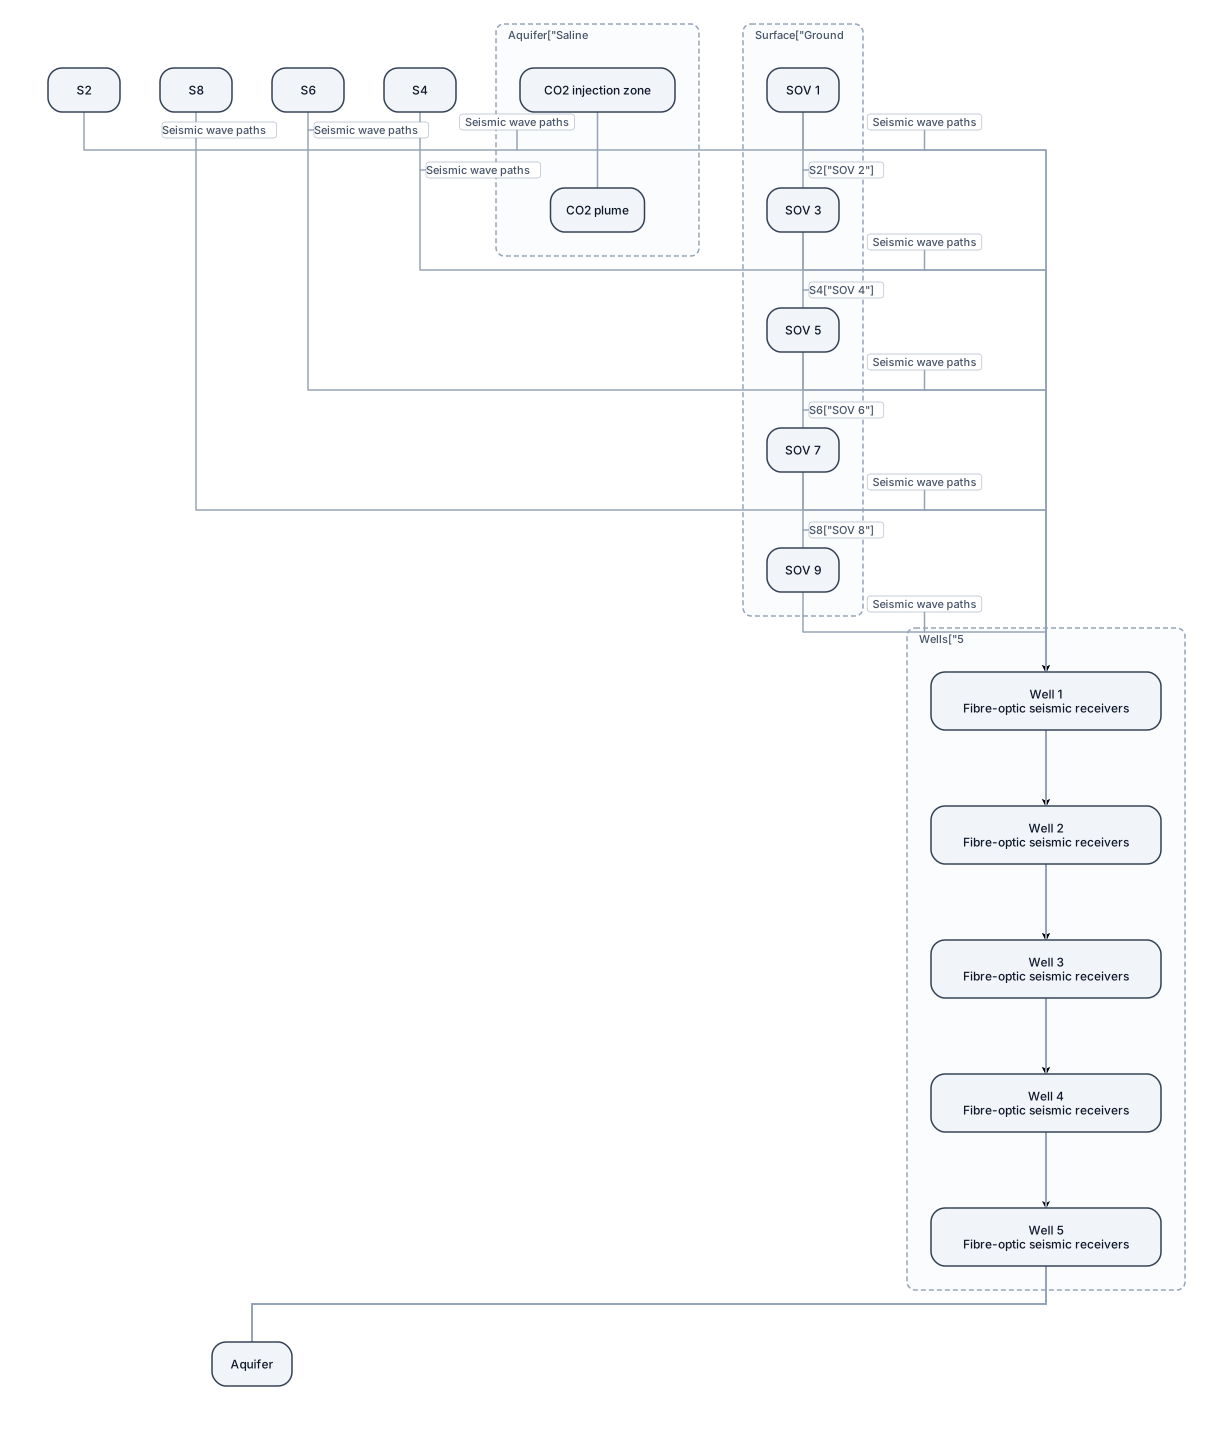
Create a simple scientific schematic diagram of the seismic monitoring system at the Otway International Test Centre in Australia. Show a vertical geological cross-section: - At the top, show the ground surface. - Place 9 permanent seismic sources (SOVs) on the surface. - Show 5 vertical monitoring wells extending to about 1.5–1.7 km depth. - Inside each monitoring well, show a fibre-optic cable with seismic receivers at different depths. - At about 1.5 km depth, show a saline aquifer and the CO2 injection zone. - Show a CO2 plume spreading through the saline aquifer. - Draw several seismic wave paths from the surface sources down through the subsurface to the receivers in the wells. - Use arrows to clearly show the direction of seismic waves. - Show that different sources and wells provide different seismic paths and 3D coverage of the CO2 plume. Add clear labels: "Ground surface" "9 permanent seismic sources (SOVs)" "5 monitoring wells" "Fibre-optic seismic receivers" "Saline aquifer" "CO2 injection zone" "CO2 plume" "Seismic wave paths" "~1.5 km depth" Use a clean, simple scientific style suitable for a university geology presentation. Use a white background, simple colours, minimal text, clear arrows, and no decorative elements. Make the diagram easy to understand at a glance.
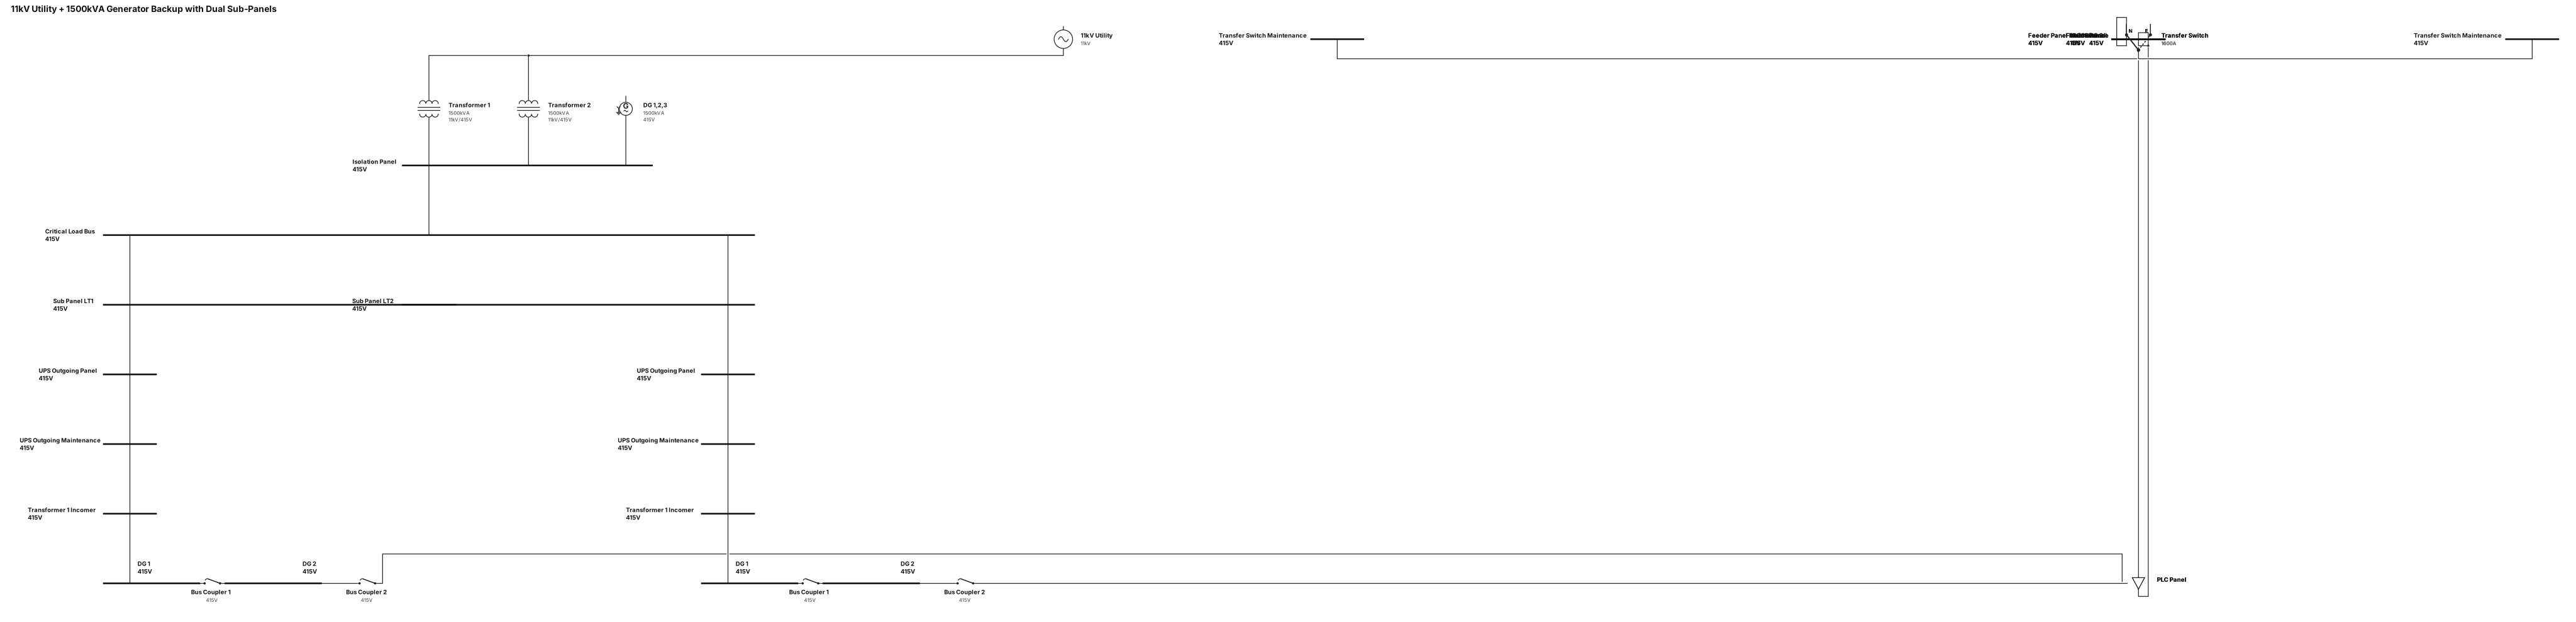
A 11kv input to isolation panel transformer 1 and 2 and 1500kva second source generators feeding same isolation panel Dg123 , then a critical-load bus with two sub panels LT1 and LT 2 .in LT 1 and LT 2 same pattern like first Ups out going panel , UPS out going maintenance, transformer 1 income,Dg 1 ,bus coupler,,DG 2,Bus coupler, PLC panel ,DG 3, feeder panel , feeder panel maintenance,mccb panel,transfer switch , transfer switch maintenance
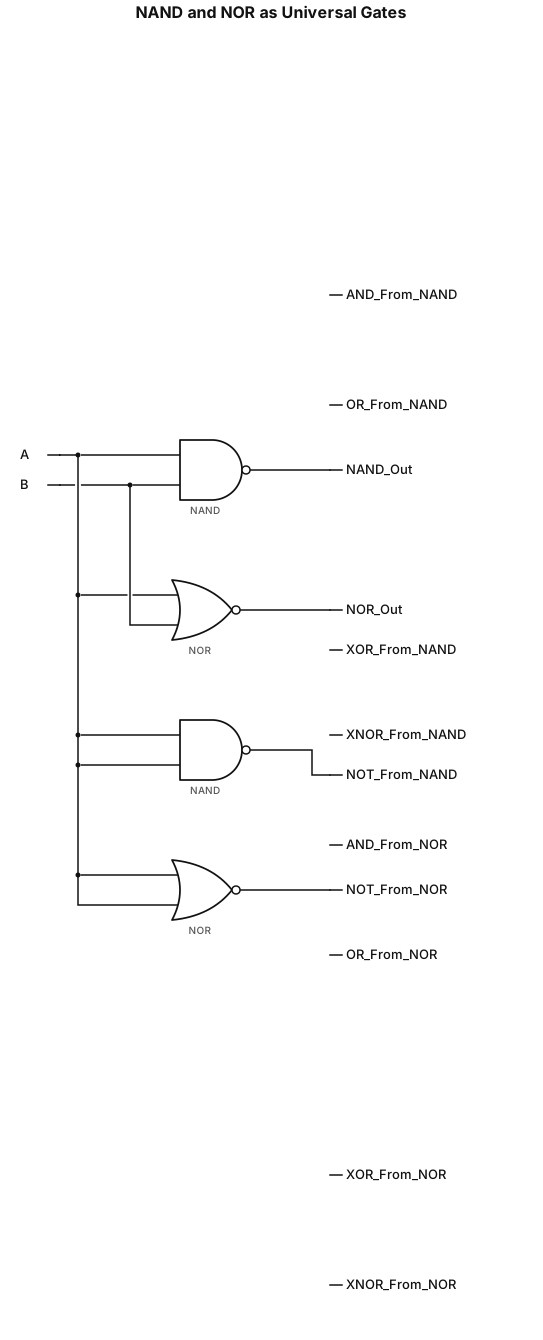
TO STUDY AND VERIFY OF NAND AND NOR GATES AS A UNIVERSAL GATES make all the logic gates