EXPLAIN SOCIO ECONOMIC CONDITIONS OF INDIAN MUSLIMS LIKE ITS THE JUCIEST TEA EVER AND DRAW to make it more clear
NODE ARCHIVE · REAL DIAGRAM BRIEFS
Diagram Examples from Real Visitor Prompts
Browse eligible diagrams shared by FreeDiagram visitors, inspect the exact prompts, and build your own version.
Browse 3261 real creationsCOMMUNITY OUTPUTS · EXACT PROMPTS
All visitor creations
Showing 121–144 of 3261. No stock examples or system defaults. Choose a tool, study a real result, then reopen its prompt as your starting point.
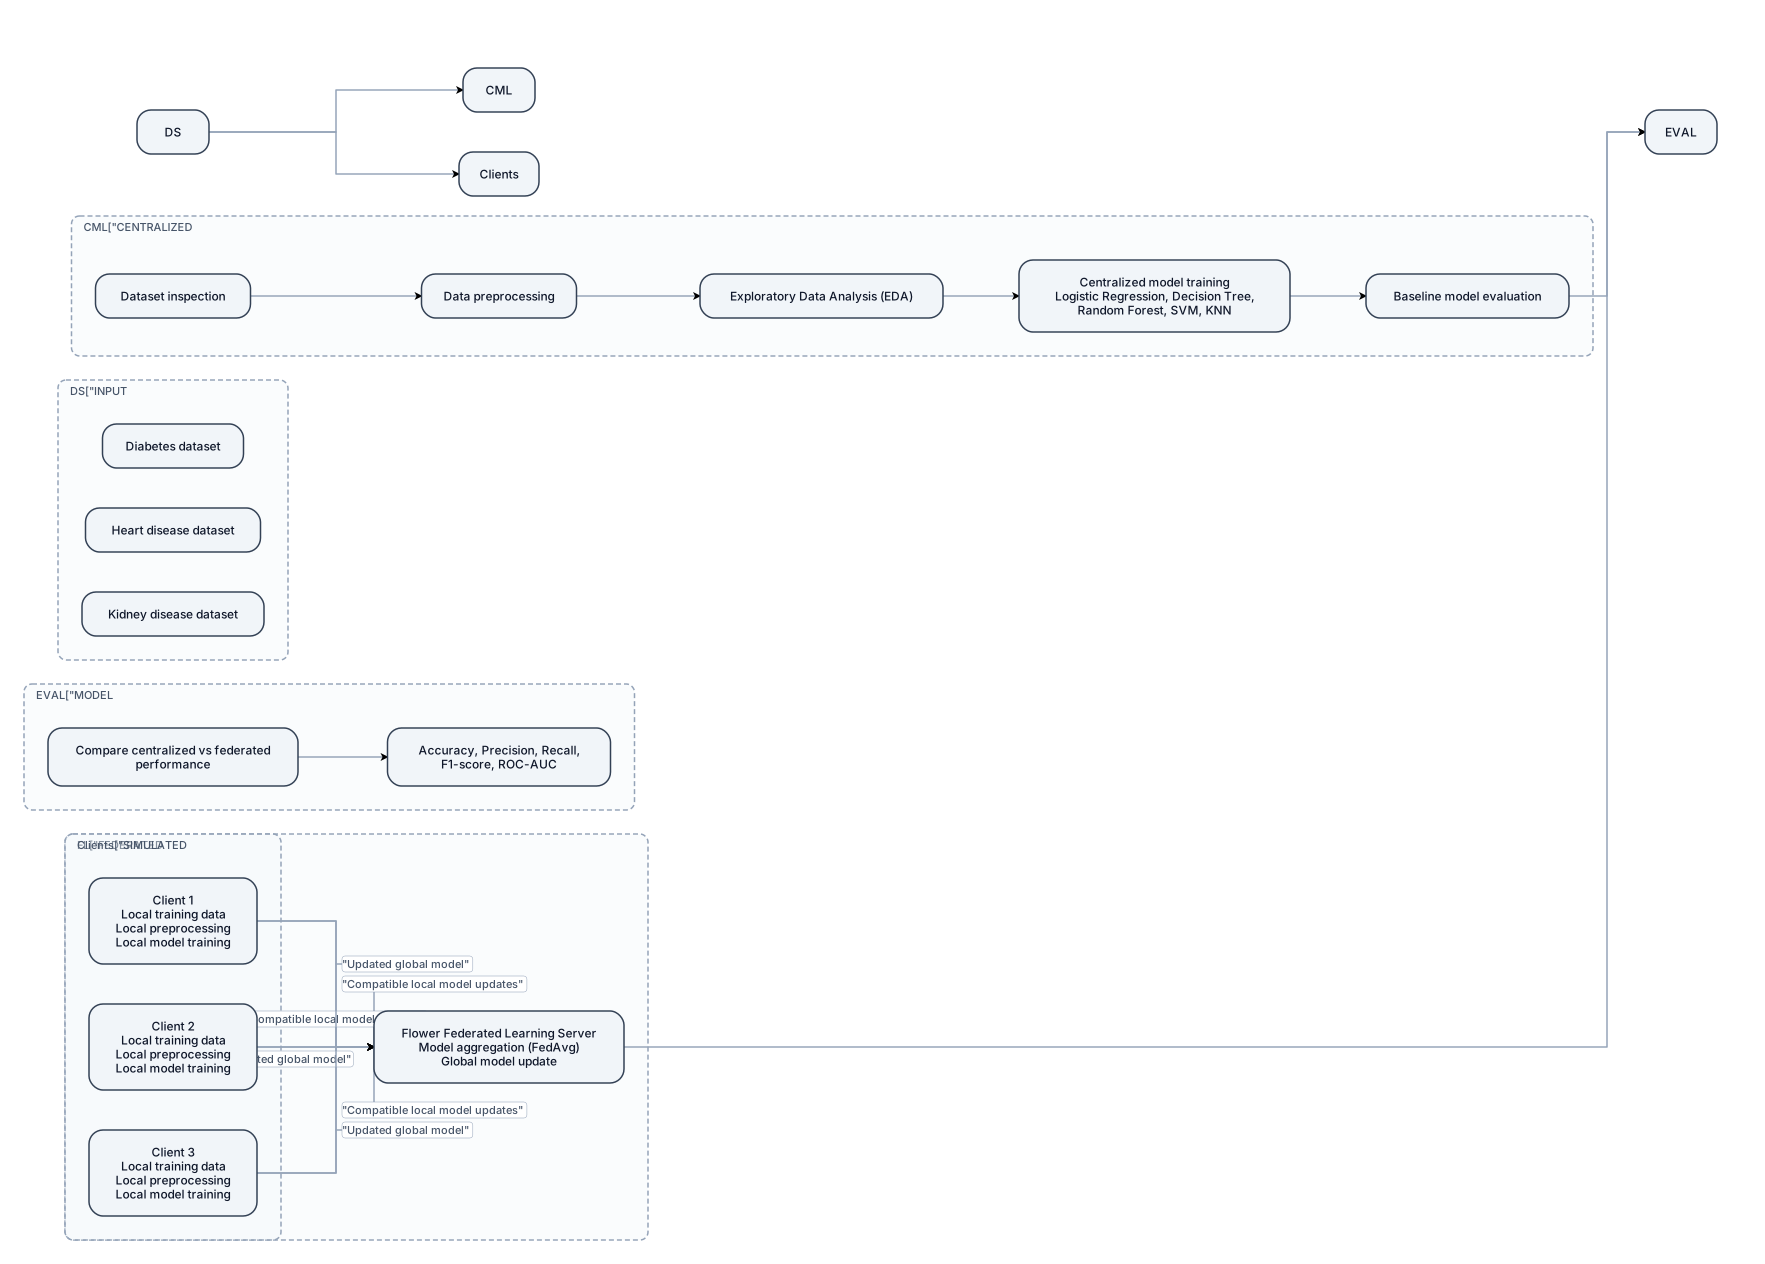
Create a professional, academic-level system architecture diagram for a B.Tech major project titled "Privacy-Preserving Healthcare Data Mining Using Federated Learning." Use a clean white background, readable labels, simple shapes, and a left-to-right layout suitable for a university project report. Include the following components: 1. INPUT DATASETS - Diabetes dataset - Heart disease dataset - Kidney disease dataset 2. CENTRALIZED MACHINE LEARNING WORKFLOW - Dataset inspection - Data preprocessing - Exploratory Data Analysis (EDA) - Centralized model training using Logistic Regression, Decision Tree, Random Forest, SVM, and KNN - Baseline model evaluation 3. FEDERATED LEARNING CLIENTS - Show three simulated clients. - Each client has local training data, local preprocessing, and local model training. - Raw training records must remain with their respective clients. - Label the clients as simulated clients, not real hospitals. 4. FEDERATED LEARNING SERVER - Label the server "Flower Federated Learning Server." - Show compatible local model updates being sent from clients to the server. - Show model aggregation using Federated Averaging (FedAvg), provided the chosen model supports this method. - Show the updated global model being returned to the clients. 5. MODEL EVALUATION - Compare centralized and federated model performance. - Include accuracy, precision, recall, F1-score, and ROC-AUC where appropriate. Use directional arrows to show the data and model-update flow. Clearly distinguish raw training data from model updates. Do not include encryption, differential privacy, CNN-LSTM, or other techniques as implemented components. Add the caption: "Figure: Preliminary System Architecture of the Proposed Federated Learning Framework." Keep the diagram uncluttered, technically accurate, and easy to read when inserted into a Word report.
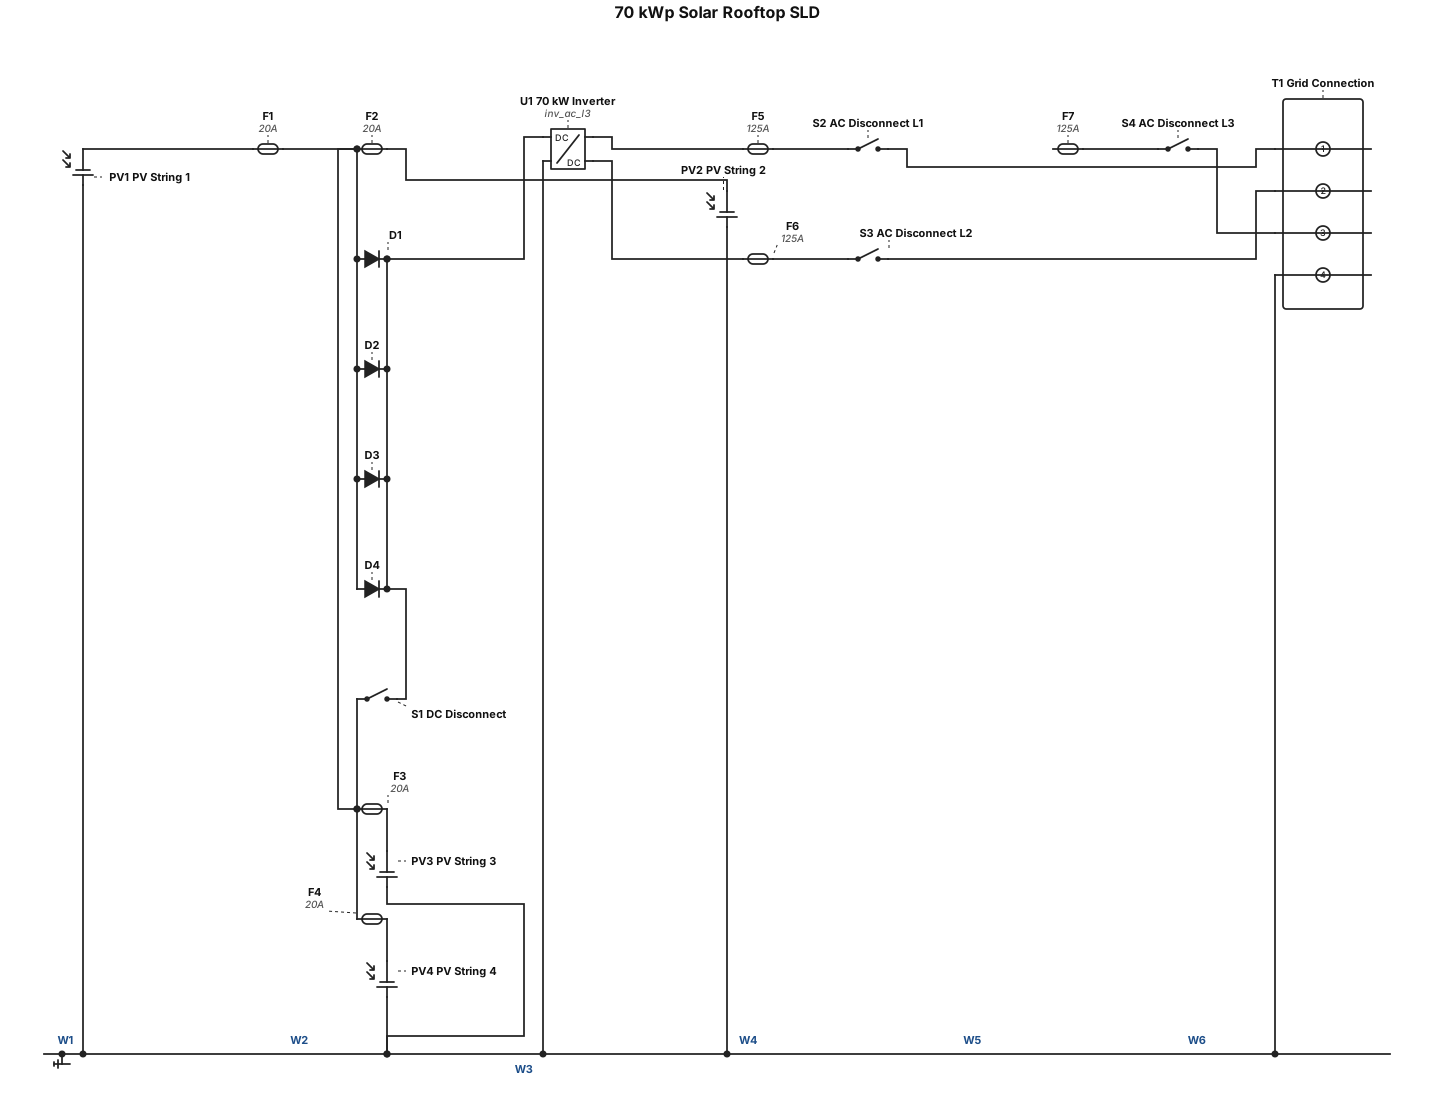
i need a 70 kwp solar Rootop sld
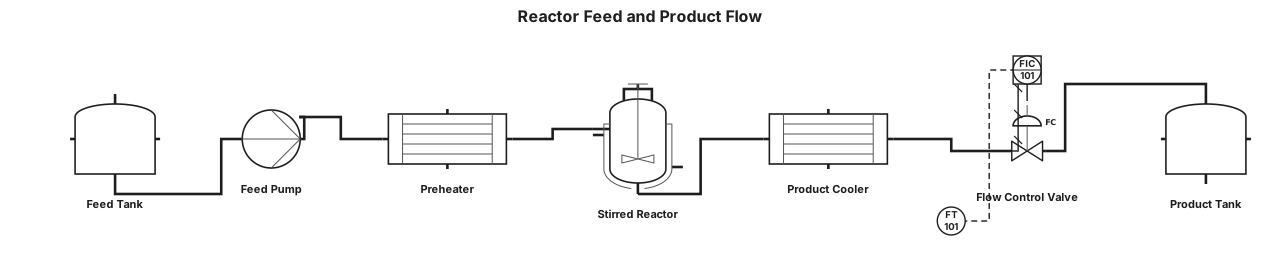
A process flow diagram: feed tank T-101 to centrifugal pump P-101, through shell-and-tube preheater E-101 into stirred tank reactor R-101, then through product cooler E-102 and flow control valve FV-101 to product tank V-101
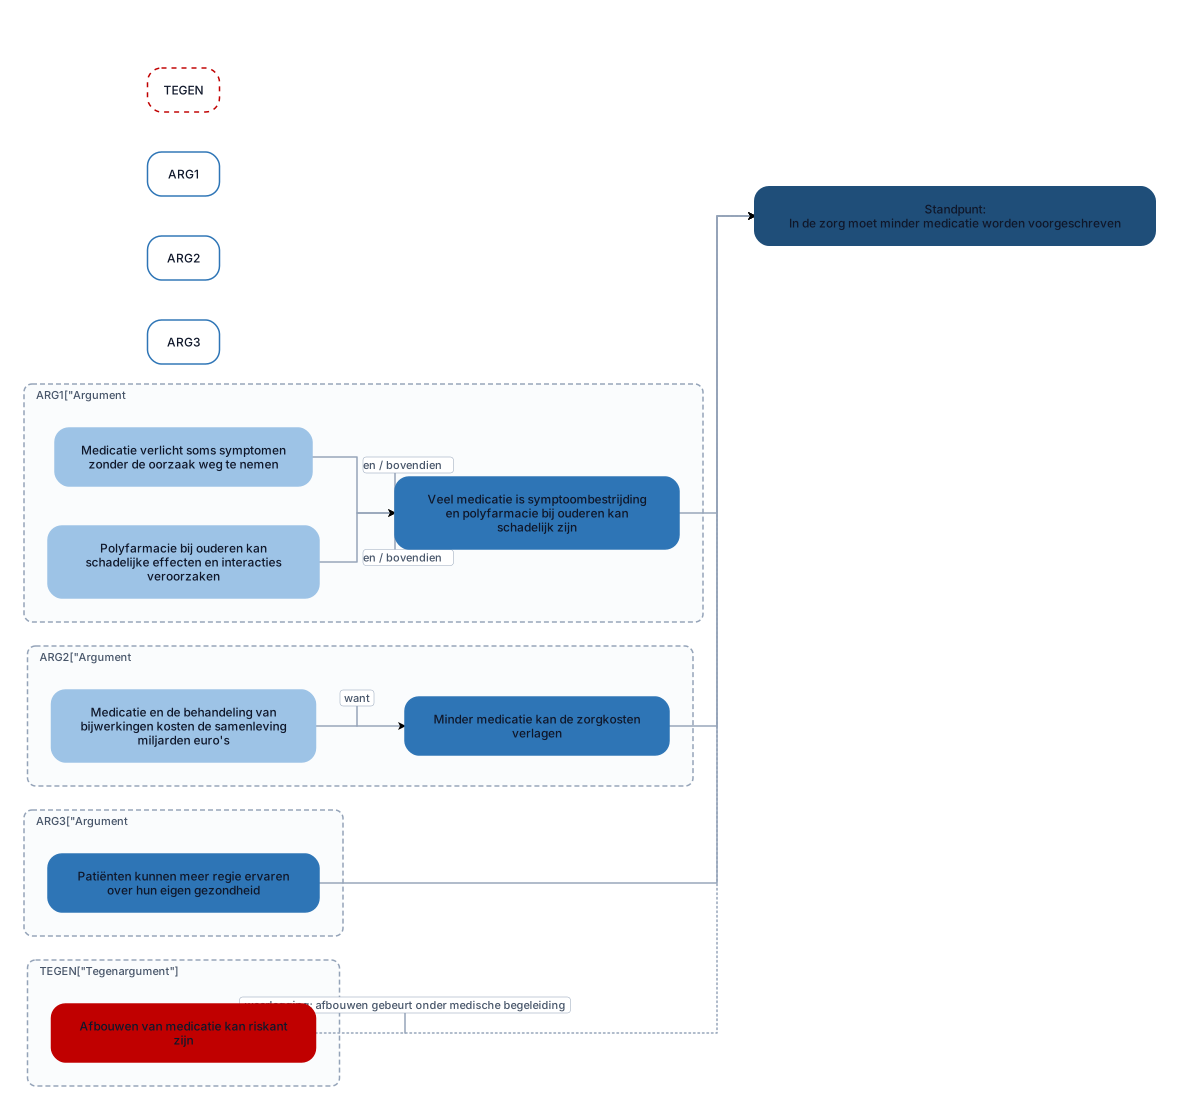
Maak een professioneel Nederlands argumentatieschema voor een schoolbetoog met de titel "Minder medicatie in de zorg". Zet bovenaan het standpunt: "In de zorg moet minder medicatie worden voorgeschreven." Plaats daaronder drie afzonderlijke hoofdargumenten: Argument 1 (nevenschikkend): Veel medicatie is symptoombestrijding en polyfarmacie bij ouderen kan schadelijk zijn. Subargument 1a: Medicatie verlicht soms symptomen zonder de oorzaak weg te nemen. Subargument 1b: Polyfarmacie bij ouderen kan schadelijke effecten en interacties veroorzaken. Verbind 1a en 1b met "en / bovendien". Argument 2 (onderschikkend): Minder medicatie kan de zorgkosten verlagen. Subargument 2.1: Medicatie en de behandeling van bijwerkingen kosten de samenleving miljarden euro's. Verbind dit subargument met argument 2 via "want". Argument 3 (enkelvoudig): Patiënten kunnen meer regie ervaren over hun eigen gezondheid. Geen subargumenten. Voeg onderaan een apart onderdeel toe met tegenargumenten en weerleggingen: Tegenargument: Afbouwen van medicatie kan riskant zijn. Vormgeving: Standpunt bovenaan. Drie hoofdargumenten naast elkaar. Subargumenten direct onder het bijbehorende argument. Duidelijke pijlen en verbindingswoorden. Verschillende kleuren voor standpunt, argumenten, subargumenten en tegenargumenten. Alle tekst in het Nederlands. Maak het diagram overzichtelijk, passend op 1 landscape-pagina en exporteerbaar Verzin geen aanvullende argumenten of feiten.

Maak een professioneel Nederlands argumentatieschema voor een schoolbetoog met de titel "Minder medicatie in de zorg". Zet bovenaan het standpunt: "In de zorg moet minder medicatie worden voorgeschreven." Plaats daaronder drie afzonderlijke hoofdargumenten: Argument 1 (nevenschikkend): Veel medicatie is symptoombestrijding en polyfarmacie bij ouderen kan schadelijk zijn. Subargument 1a: Medicatie verlicht soms symptomen zonder de oorzaak weg te nemen. Subargument 1b: Polyfarmacie bij ouderen kan schadelijke effecten en interacties veroorzaken. Verbind 1a en 1b met "en / bovendien". Argument 2 (onderschikkend): Minder medicatie kan de zorgkosten verlagen. Subargument 2.1: Medicatie en de behandeling van bijwerkingen kosten de samenleving miljarden euro's. Verbind dit subargument met argument 2 via "want". Argument 3 (enkelvoudig): Patiënten kunnen meer regie ervaren over hun eigen gezondheid. Geen subargumenten. Voeg onderaan een apart onderdeel toe met tegenargumenten en weerleggingen: Tegenargument: Zonder medicatie worden chronisch zieken niet goed behandeld. Weerlegging: Minder medicatie betekent niet geen medicatie; het gaat om kritischer voorschrijven. Tegenargument: Afbouwen van medicatie kan riskant zijn. Weerlegging: Met individuele beoordeling en goede begeleiding kan medicatie verantwoord worden afgebouwd. Vormgeving: Standpunt bovenaan. Drie hoofdargumenten naast elkaar. Subargumenten direct onder het bijbehorende argument. Duidelijke pijlen en verbindingswoorden. Verschillende kleuren voor standpunt, argumenten, subargumenten en tegenargumenten. Alle tekst in het Nederlands. Maak het diagram overzichtelijk en exporteerbaar als PNG of PDF. Verzin geen aanvullende argumenten of feiten.
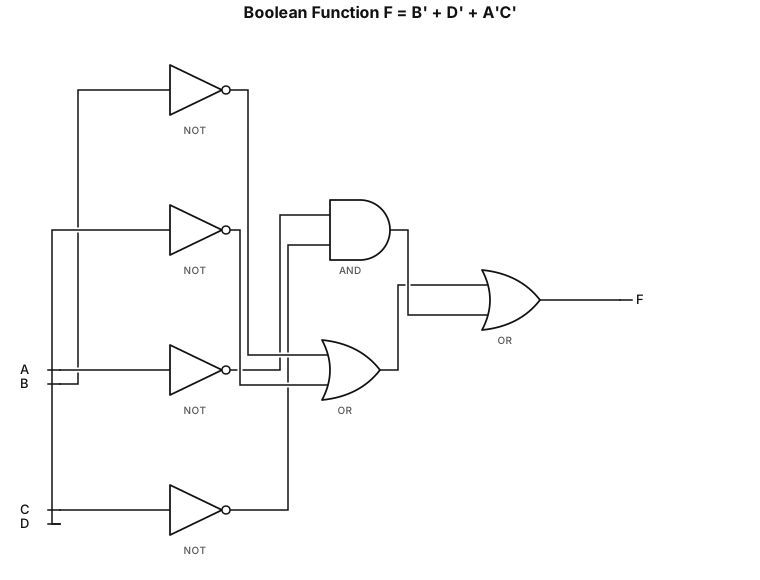
A logic gate circuit using AND, OR, and NOT gates with inputs A, B, C and D for this function: F = (B')+(D')+(A'C')
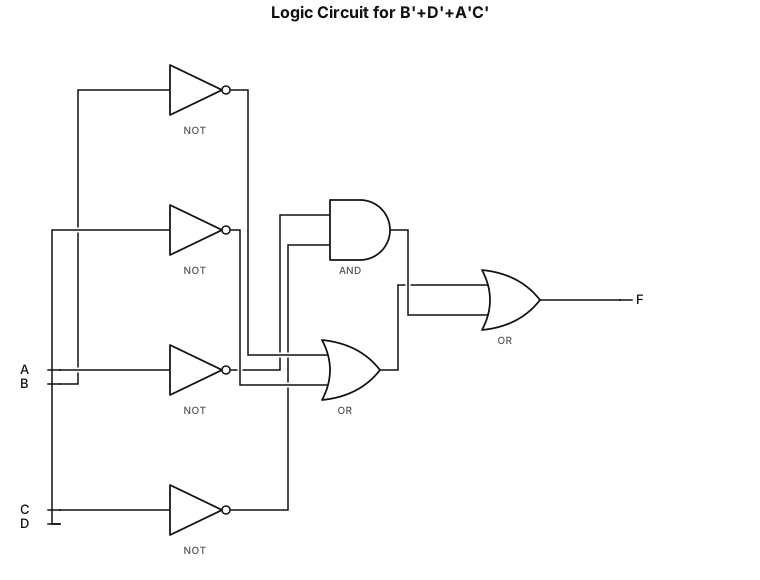
A logic gate circuit using AND, OR, and NOT gates with inputs A, B, C and D for this function: B'+D'+A'C'
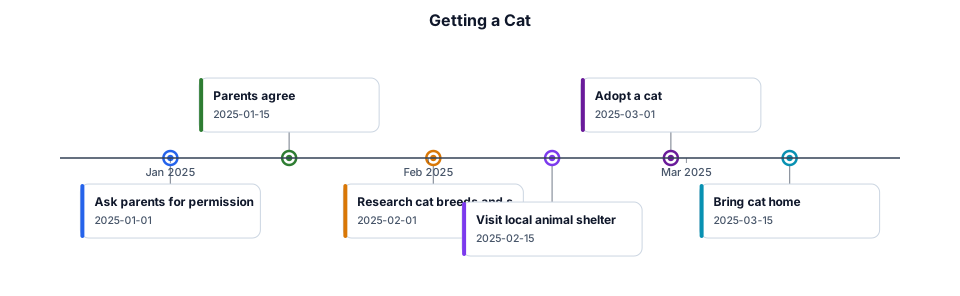
If my parents agree, I will get a cat
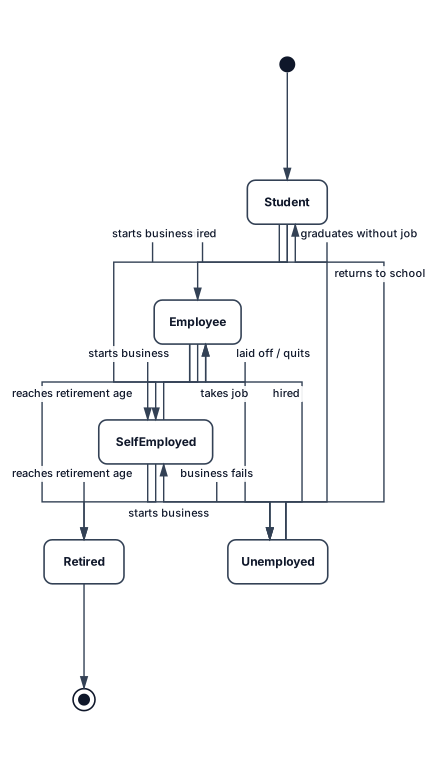
The objective of the exercise is to describe the different states of a person’s professional life and the corresponding transitions. For example, a person may be a student, an employee, unemployed, self-employed, or retired. At the beginning of their professional life, a person is a student. Do not consider simultaneous activities, such as being both an employee and self-employed at the same time. 1. Construct the corresponding state-transition diagram.
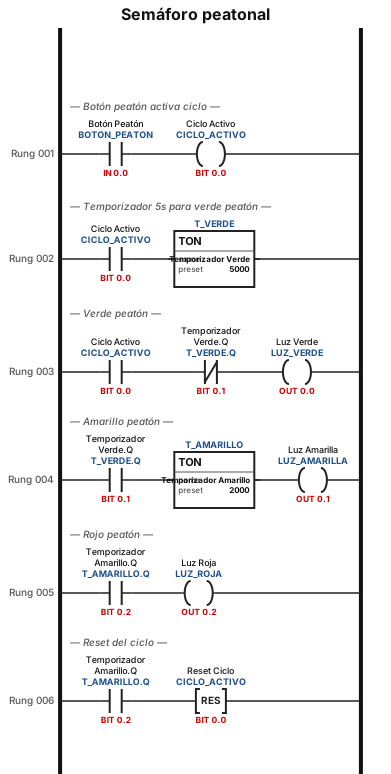
puedes darme el esquema leader de un semaforo?
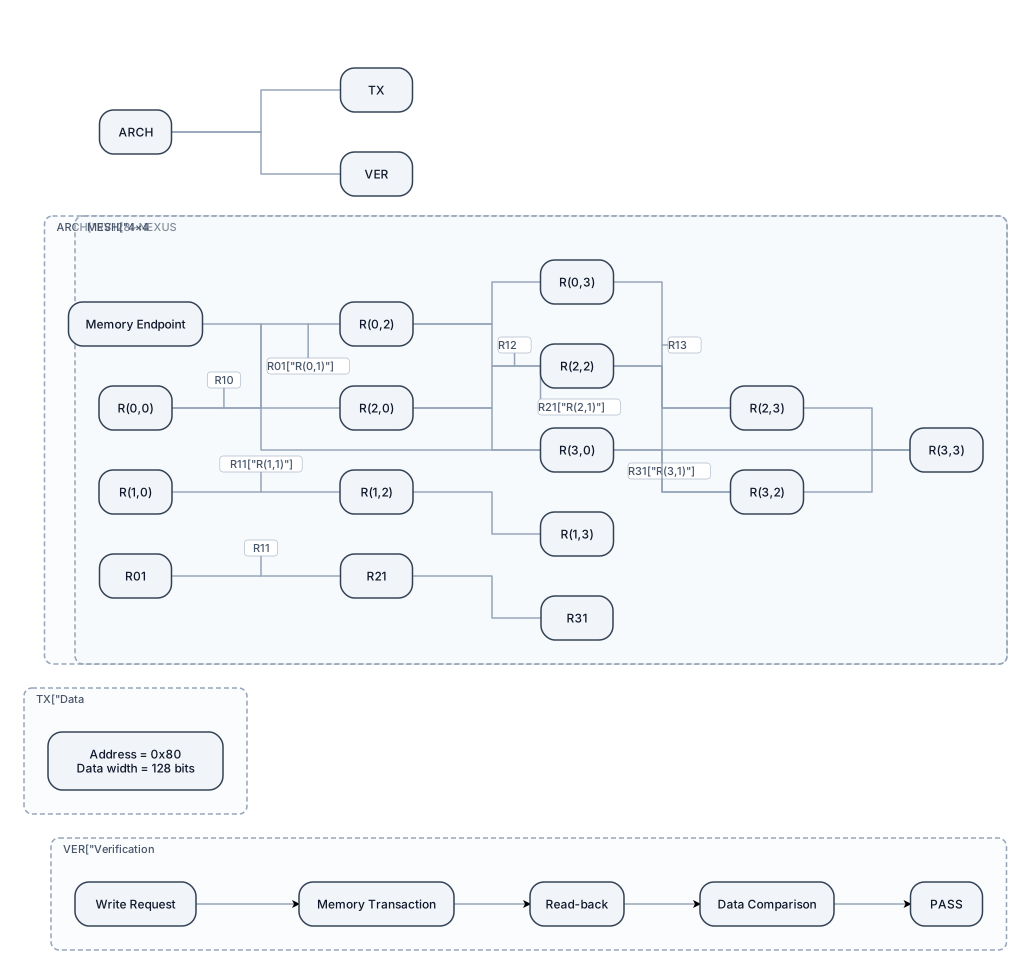
Create a detailed, professional IEEE-style technical architecture diagram for RV128I-NEXUS, a 128-bit datapath system with a synchronous 4×4 mesh Network-on-Chip. Design requirements: 1. Use a wide landscape canvas with a clean white background, dark navy outlines, teal data paths, and subtle amber highlights. 2. Place a precise 4×4 mesh of 16 routers in the center. Label every router R(0,0) through R(3,3). 3. Draw horizontal and vertical links between adjacent routers, with clear bidirectional connections. 4. Highlight the memory endpoint at coordinate (3,3). 5. Add a compact transaction annotation: Address = 0x80; Data width = 128 bits. 6. Show the verified test sequence as a separate flow: Write request → Memory transaction → Read-back → Data comparison → PASS. 7. Organize the composition into clearly separated architecture, data transaction, and verification sections. 8. Use consistent spacing, readable technical typography, clean orthogonal connectors, and a professional semiconductor research-paper aesthetic. 9. Avoid generic clip art, 3D effects, unnecessary decorative elements, and oversized text. 10. Make the figure suitable for an IEEE research paper and export it as a high-resolution PNG or SVG. Accuracy constraints: Do not invent processor cores, routing algorithms, interfaces, or hardware connections. Do not imply complete verification of all routers or routes. Show only implementation details supported by the RTL and simulation evidence. Treat the transaction flow as the tested case, not proof of exhaustive mesh verification.
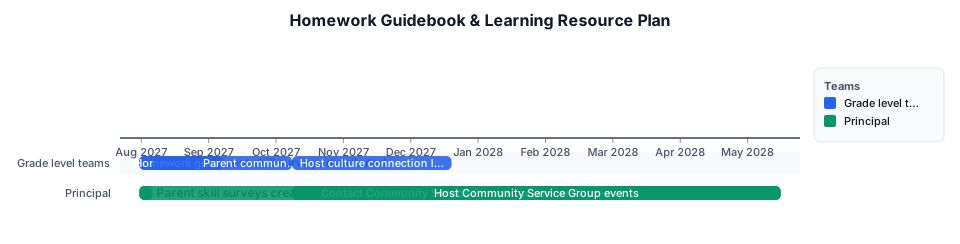
Create homework guidebook and learning resource Grade level teams 08/01/2027 09/08/2027 Homework guidebook and learning resource distribution Grade level teams 08/01/2027 09/08/2027 Parent skill surveys creation principal 08/01/2027 08/07/2027 Parent skill surveys distributed Grade level teams 08/07/2027 09/01/2027 Parent communication and approvals for lesson planning Grade level teams 09/01/2027 10/09/2027 Host culture connection learning lessons Grade level teams 10/09/2027 12/20/2027 Contact Community Service Groups for partnerships Principal 08/01/2027 05/17/2028 Host Community Service Group events Principal Beginning of Second Quarter End of school year
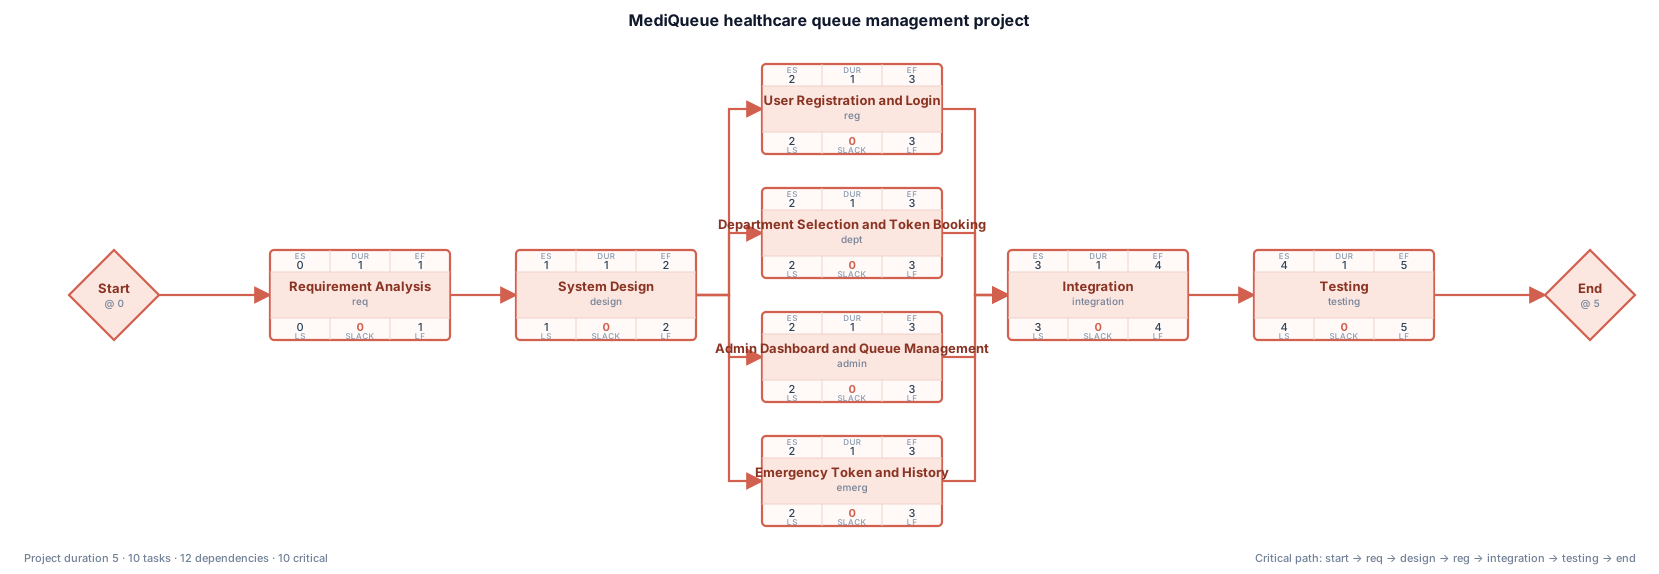
Create a proper PERT chart for the MediQueue healthcare queue management project. Use a network diagram with activity nodes connected by arrows. Show these activities and dependencies: Start → Requirement Analysis → System Design. After System Design, create four parallel branches: User Registration and Login; Department Selection and Token Booking; Admin Dashboard and Queue Management; Emergency Token and History. Connect all four branches to Integration. Then show Integration → Testing → End. Use arrows to show dependencies, a white background, simple rectangular boxes, minimal pastel colors and readable labels. Do not invent activity durations, project duration, or critical path. No decorative graphics or extra text.
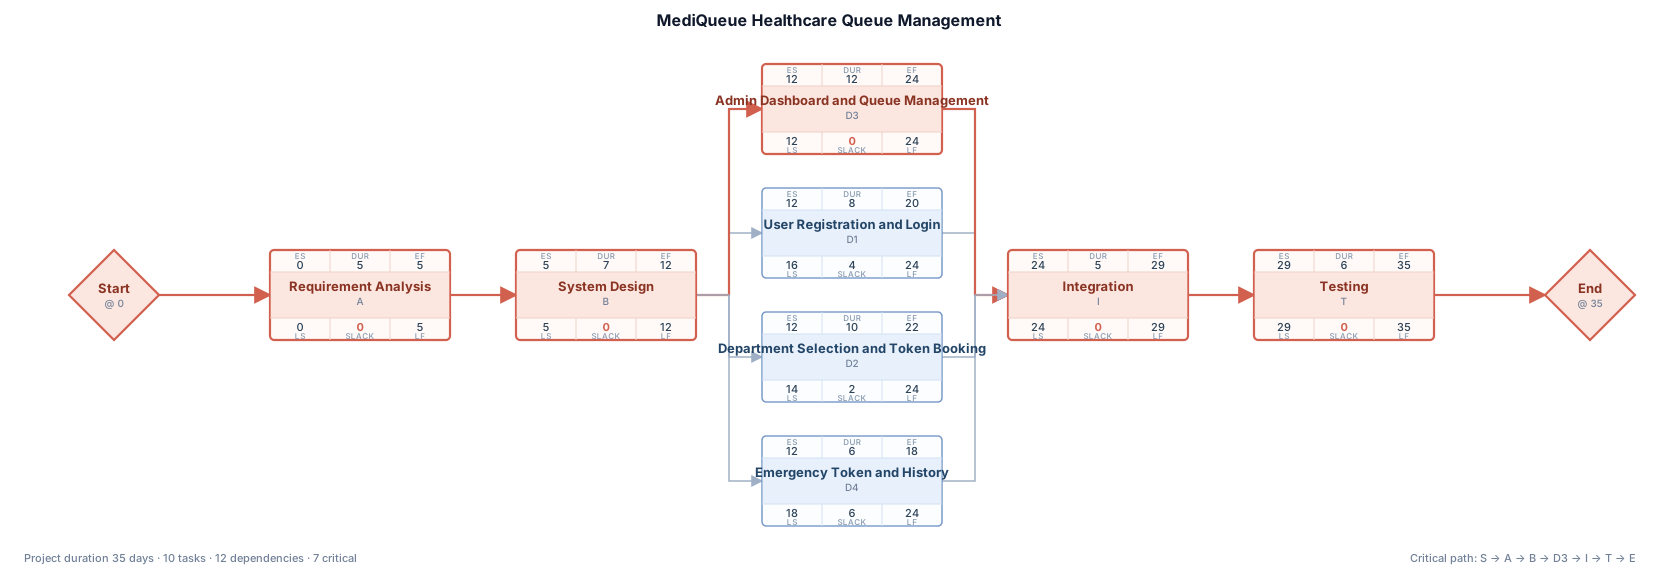
Create a proper PERT network diagram for the MediQueue healthcare queue management project. Use a left-to-right network layout with separate rectangular activity nodes connected by directional arrows. Show this dependency sequence: Start → Requirement Analysis → System Design → Development → Integration → Testing → End. Under Development, show parallel activities: User Registration and Login; Department Selection and Token Booking; Admin Dashboard and Queue Management; Emergency Token and History. Connect all four development activities to Integration, then continue to Testing and End. Use a clean white background, thin dark arrows, minimal pastel colors, readable labels, no decorative icons, no extra text, and no large title. Make the result suitable for a college project report.
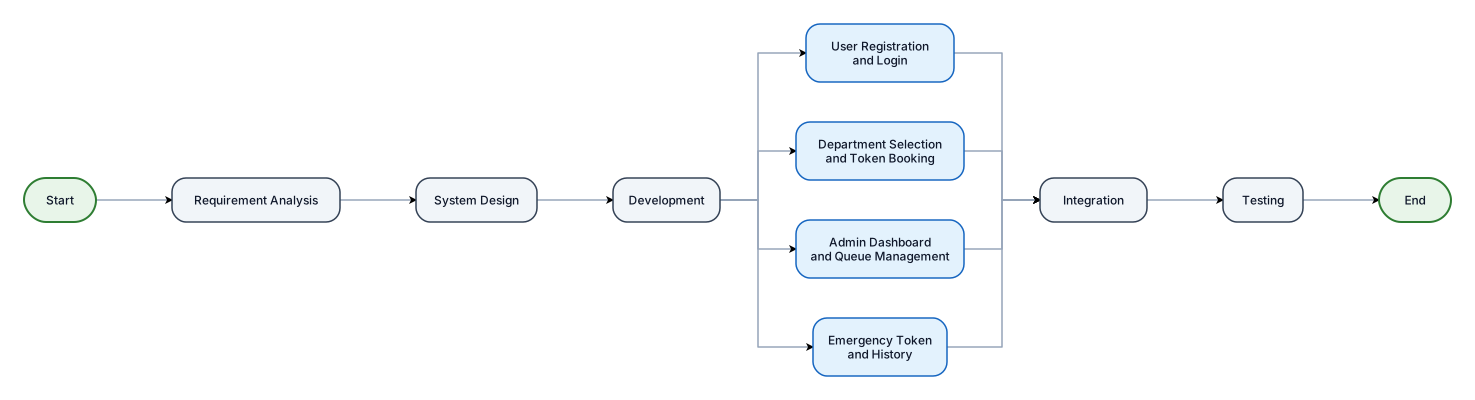
Create a proper PERT network diagram for the MediQueue healthcare queue management project. Use a left-to-right network layout with separate rectangular activity nodes connected by directional arrows. Show this dependency sequence: Start → Requirement Analysis → System Design → Development → Integration → Testing → End. Under Development, show parallel activities: User Registration and Login; Department Selection and Token Booking; Admin Dashboard and Queue Management; Emergency Token and History. Connect all four development activities to Integration, then continue to Testing and End. Use a clean white background, thin dark arrows, minimal pastel colors, readable labels, no decorative icons, no extra text, and no large title. Make the result suitable for a college project report.

Create a simple and professional PERT chart for a TYBSc Computer Science project named MediQueue, a healthcare queue management system. Show the activities in this order: Start → Requirement Analysis → System Design and Database Planning → User Registration and Login → Department Selection and Token Booking → Admin Dashboard and Queue Management → Emergency Token and History → Integration → Testing → End. Use clear arrows, neat rectangular boxes, minimal pastel colors, a white background, and readable English labels. Keep the diagram suitable for a college project report. Do not add explanations or extra headings.
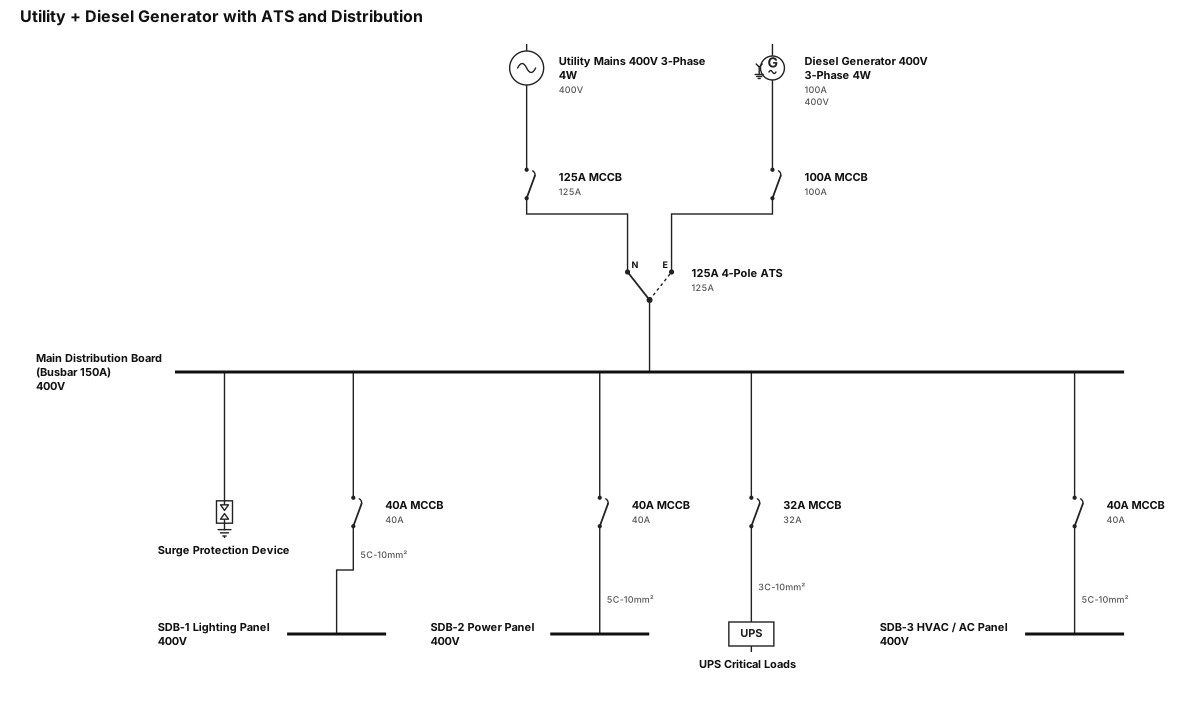
[ UTILITY MAINS ] [ DIESEL GENERATOR ] 400V, 3-Phase, 4W 400V, 3-Phase, 4W │ │ [ 125A MCCB ] [ 100A MCCB ] │ │ └───────────────┬────────────────┘ │ [ 125A 4-POLE AUTOMATIC ] [ TRANSFER SWITCH (ATS) ] │ [ MAIN DISTRIBUTION ] [ BOARD (MDB) ] (Busbar Rating: 150A) (Surge Protection: SPD) │ ┌─────────────────┼─────────────────┬─────────────────┐ │ │ │ │ [ 40A MCCB ] [ 40A MCCB ] [ 32A MCCB ] [ 40A MCCB ] │ │ │ │ [ 5C-10mm² ] [ 5C-10mm² ] [ 3C-10mm² ] [ 5C-10mm² ] │ │ │ │ ▼ ▼ ▼ ▼ [ SDB-1 ] [ SDB-2 ] [ UPS ] [ SDB-3 ] LIGHTING PANEL POWER PANEL CRITICAL LOADS HVAC / AC PANEL
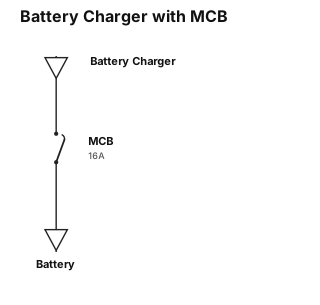
charger then mcb then to battery
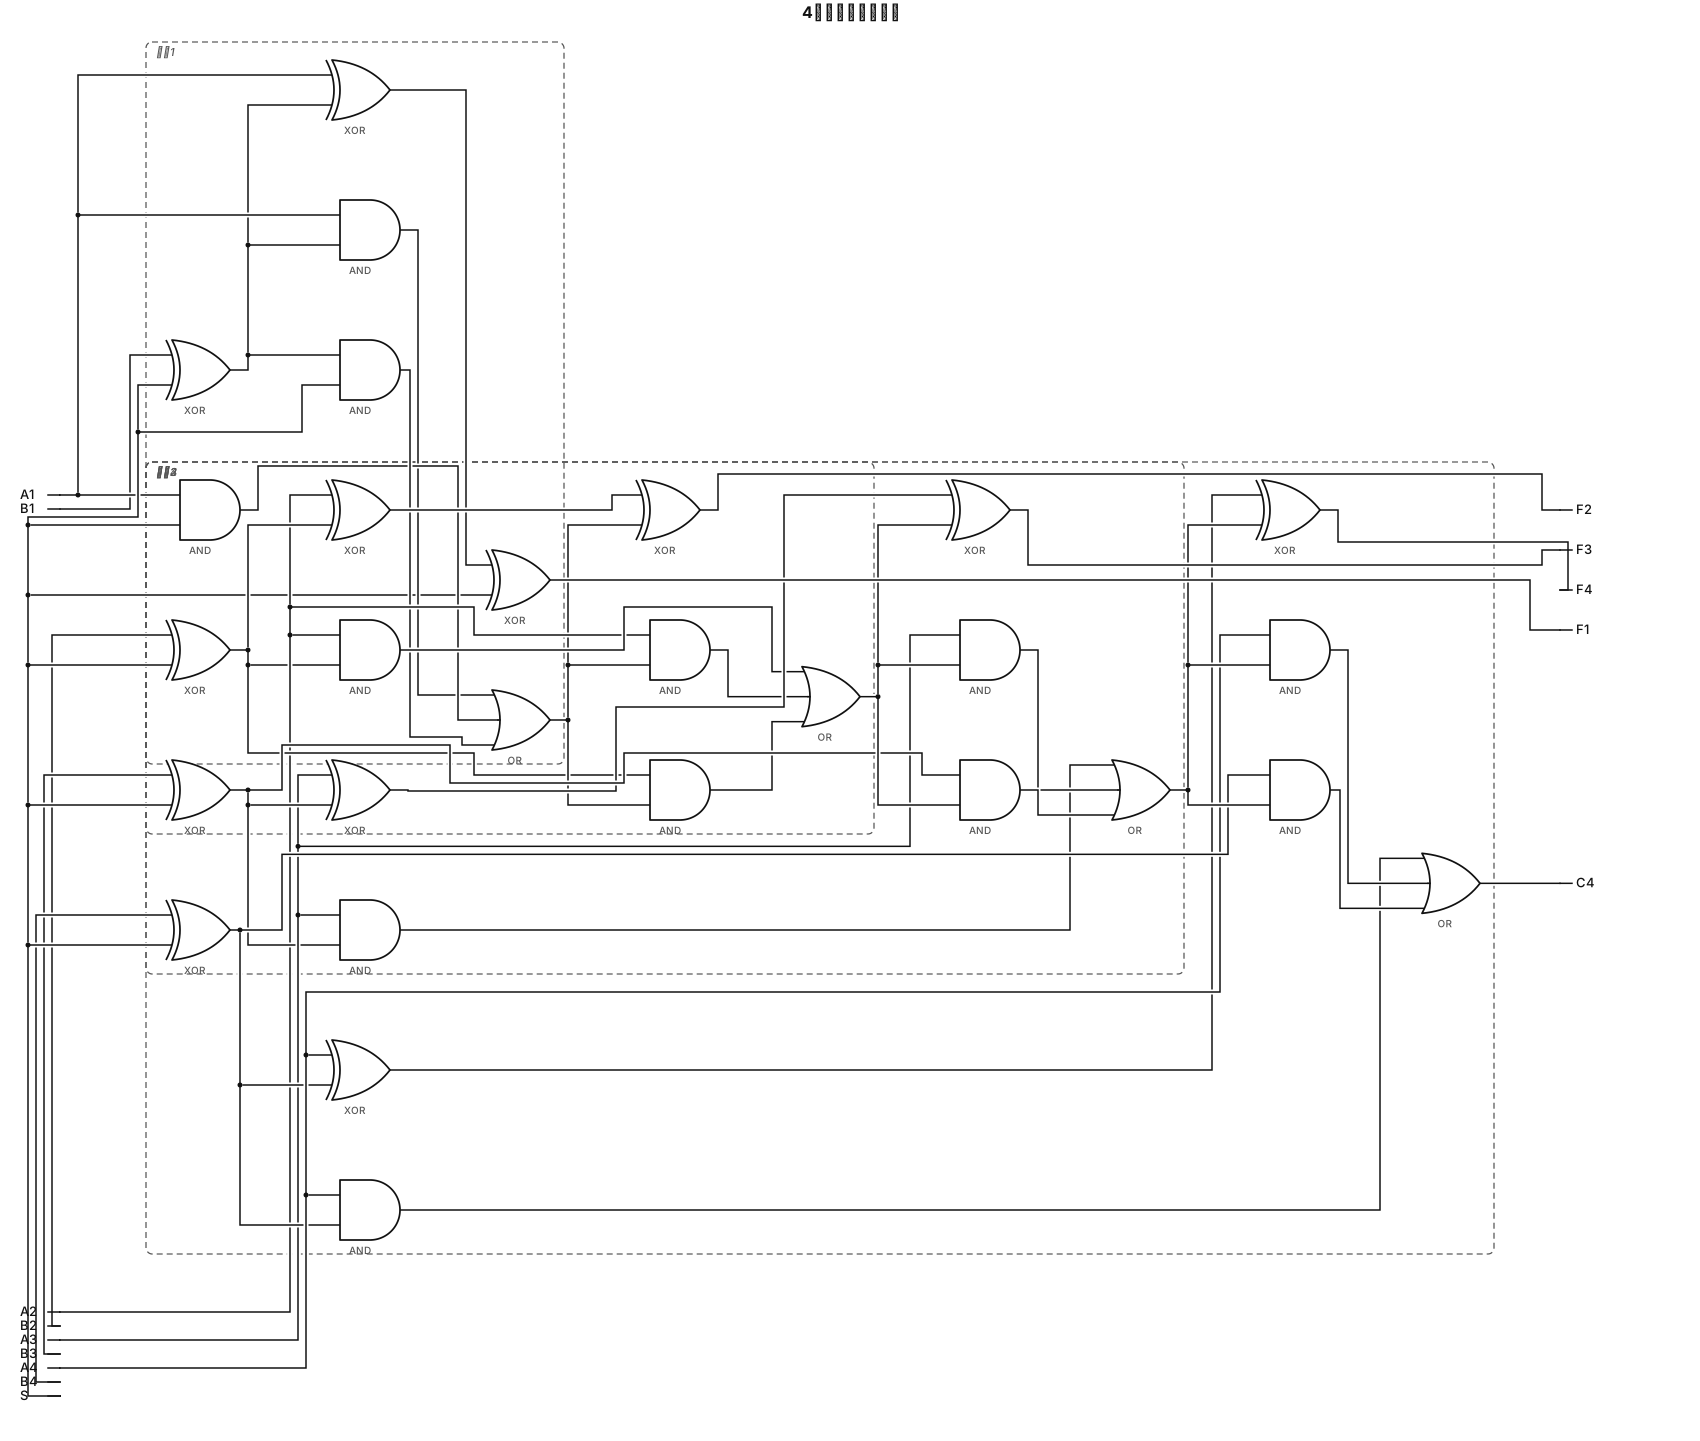
黑白线稿数字逻辑电路图,仅使用XOR异或门、AND与门、OR或门,不能使用全加器方块。 4个完全相同的可级联1位加减单元,从低位到高位依次为单元1、单元2、单元3、单元4。 每个单元输入:Ai, Bi, S, Cin;输出Fi, Cout。 每个单元内部:Bi和S送入XOR门,输出Pi;全加电路由2个XOR、3个AND、1个OR组成。 3个AND门的输入必须全部接好: AND1:Ai 和 Pi AND2:Ai 和 Cin AND3:Pi 和 Cin 三个AND的输出全部接到后面同一个OR门,没有悬空引脚,没有多余孤立门。 所有单元共用同一个控制信号S。 单元1(最低位,A1,B1):Cin = S,输出F1,Cout引出连线C1; 单元2(A2,B2):Cin接单元1引出的C1,输出F2,Cout引出连线C2; 单元3(A3,B3):Cin接单元2引出的C2,输出F3,Cout引出连线C3; 单元4(最高位,A4,B4):Cin接单元3引出的C3,输出F4,Cout作为整个电路唯一对外输出C4; 标注全部信号:A4,A3,A2,A1,B4,B3,B2,B1,S,F4,F3,F2,F1,C4。内部进位C1、C2、C3只在单元之间的连线上标注,不作为对外输出。 重点:所有逻辑门的输入输出引脚全部连线,不允许出现孤立、悬空的AND、XOR门。线条规整,无多余装饰,计算机组成原理作业图。
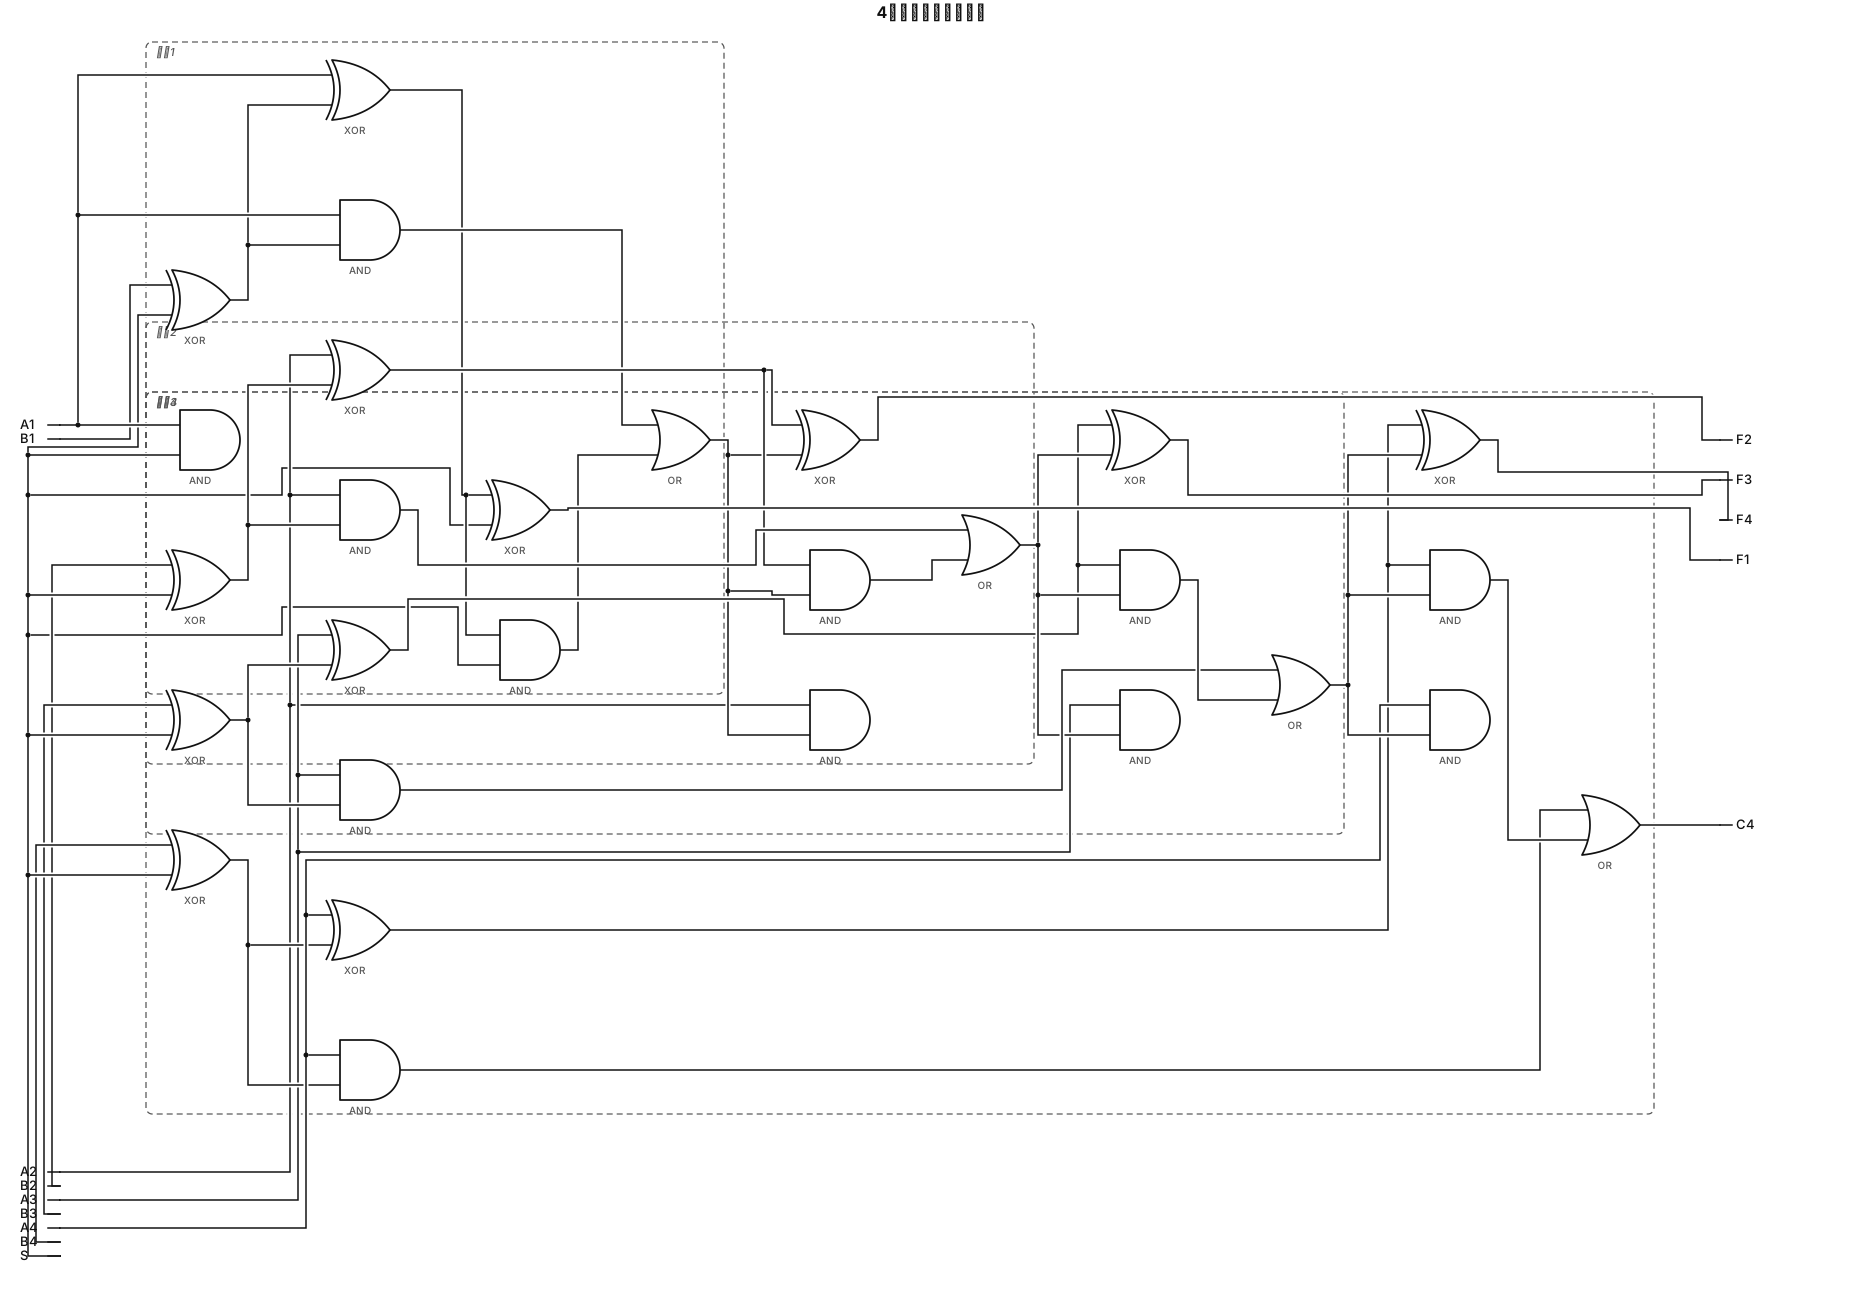
黑白线稿数字逻辑电路图,仅使用XOR异或门、AND与门、OR或门,不能使用全加器方块。 4个完全相同的可级联1位加减单元,从低位到高位依次为单元1、单元2、单元3、单元4。 每个单元输入:Ai, Bi, S, Cin;输出Fi, Cout。 每个单元内部:Bi和S送入XOR门,输出送入全加电路;全加电路由2个XOR、3个AND、1个OR组成。 所有单元共用同一个控制信号S。 单元1(最低位,A1,B1):Cin = S,输出F1,Cout引出连线C1; 单元2(A2,B2):Cin接单元1引出的C1,输出F2,Cout引出连线C2; 单元3(A3,B3):Cin接单元2引出的C2,输出F3,Cout引出连线C3; 单元4(最高位,A4,B4):Cin接单元3引出的C3,输出F4,Cout作为整个电路唯一对外输出C4; 标注全部信号:A4,A3,A2,A1,B4,B3,B2,B1,S,F4,F3,F2,F1,C4。内部进位C1、C2、C3只在单元之间的连线上标注,不作为对外输出。线条规整,无多余装饰,计算机组成原理作业图。
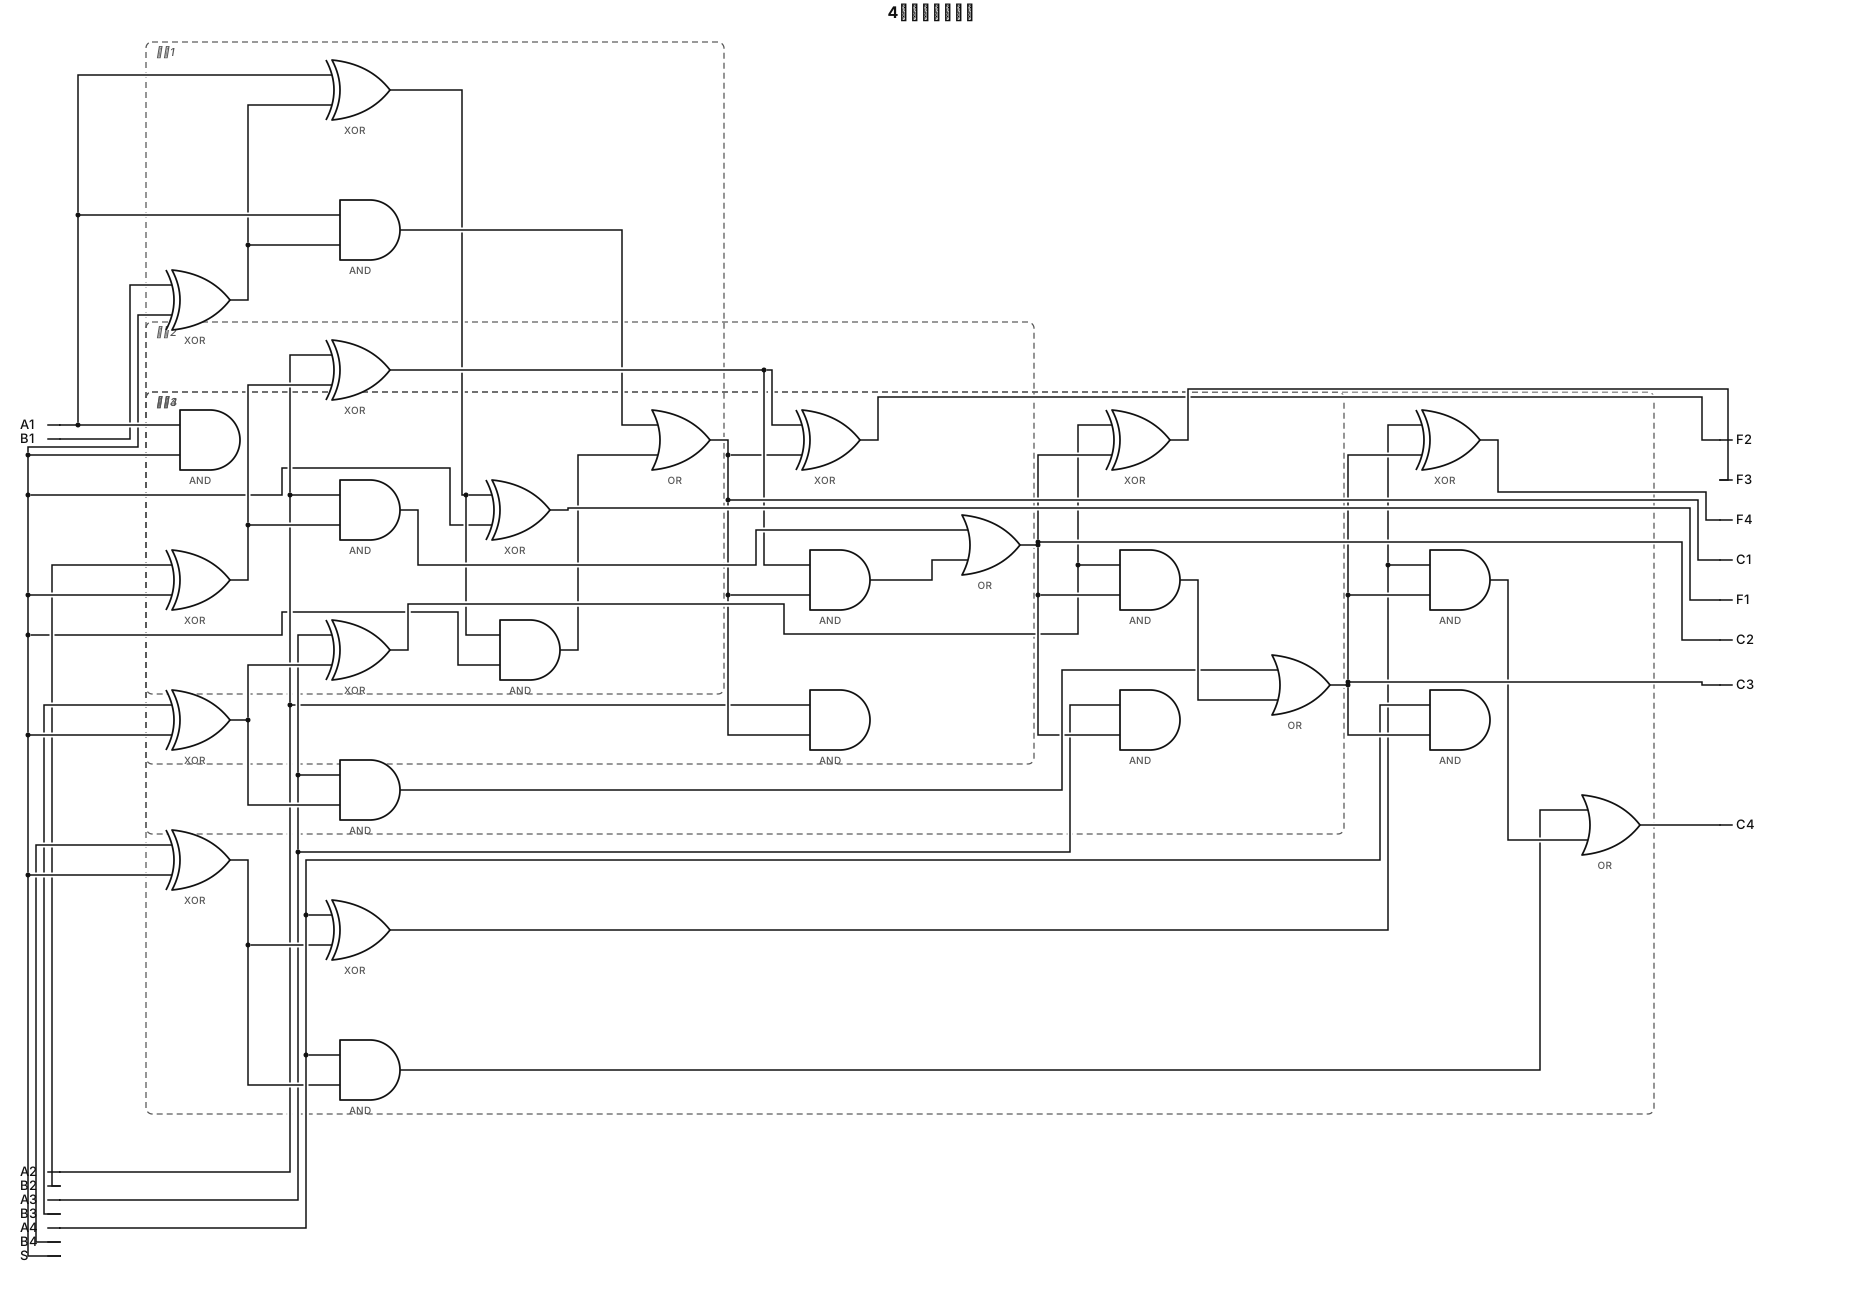
黑白线稿数字逻辑电路图,仅使用XOR异或门、AND与门、OR或门,不能使用全加器方块。 4个完全相同的可级联1位加减单元,从低位到高位依次为单元1、单元2、单元3、单元4。 每个单元输入:Ai, Bi, S, Cin;输出Fi, Cout。 每个单元内部:Bi和S送入XOR门,输出送入全加电路;全加电路由2个XOR、3个AND、1个OR组成。 所有单元共用同一个控制信号S。 单元1(最低位,A1,B1):Cin = S,输出F1,Cout=C1; 单元2(A2,B2):Cin接C1,输出F2,Cout=C2; 单元3(A3,B3):Cin接C2,输出F3,Cout=C3; 单元4(最高位,A4,B4):Cin接C3,输出F4,Cout=C4; 标注全部信号:A4,A3,A2,A1,B4,B3,B2,B1,S,F4,F3,F2,F1,C4,C3,C2,C1。线条规整,无多余装饰,计组作业图。
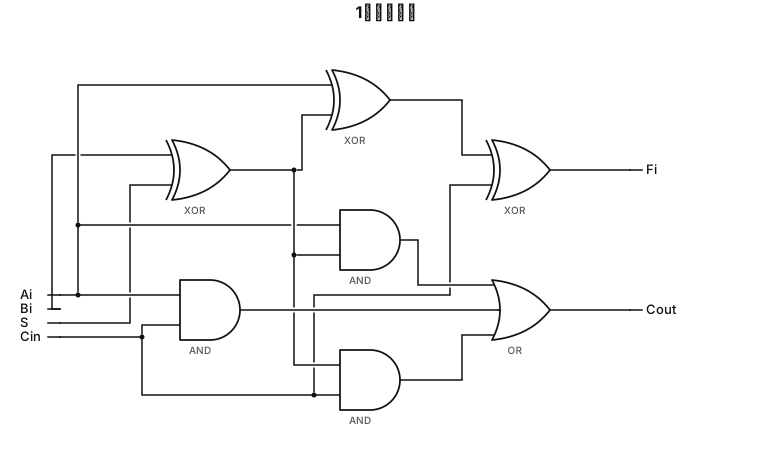
黑白线稿数字逻辑电路图,仅使用XOR异或门、AND与门、OR或门,不能使用全加器方块。 这是可级联的1位加减单元。 输入:Ai,Bi,S,Cin;输出:Fi,Cout。 第一个异或门:输入端接Bi和S,输出送到后面全加电路的一个输入。 全加电路部分: 第一个XOR门:输入Ai、上面异或门的输出; 第二个XOR门:输入上一个XOR的输出、Cin,输出本位Fi; 三个AND与门: 1. Ai 和 Bi⊕S的输出 2. Ai 和 Cin 3. Bi⊕S的输出 和 Cin 一个OR或门,接收三个与门的输出,输出Cout。 所有信号线标注:Ai, Bi, S, Cin, Fi, Cout。线条整齐,无多余装饰,计算机组成原理作业。
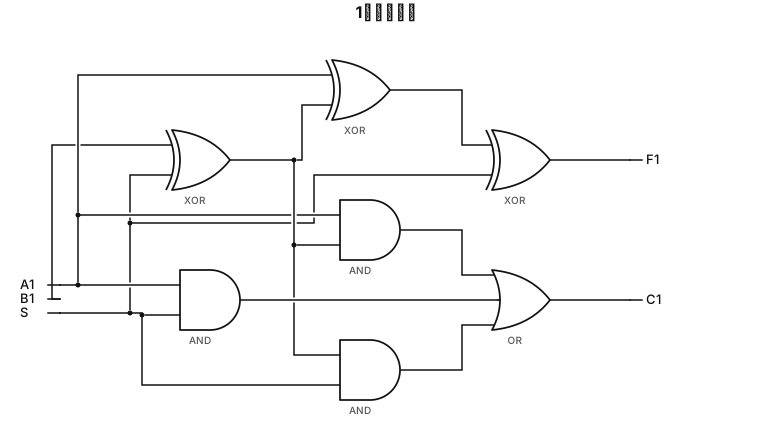
黑白线稿,1位加减法器,只用XOR异或门、AND与门、OR或门,不标注P1。 输入:A1,B1,控制信号S。 第一个异或门,两个输入端分别接B1和S;该异或门输出直接接到后面全加器的一个输入。 全加器另外两个输入:A1,以及C0=S。 全加器内部结构:第一个XOR接收A1和前面异或门的输出;第二个XOR接收该结果和C0,输出F1; 三个与门:A1和前面异或输出、A1和C0、前面异或输出和C0; 一个或门接收三个与门输出,输出C1。 所有引脚标注:A1、B1、S、F1、C1,线条简洁,无多余中间变量标签,计组作业图。