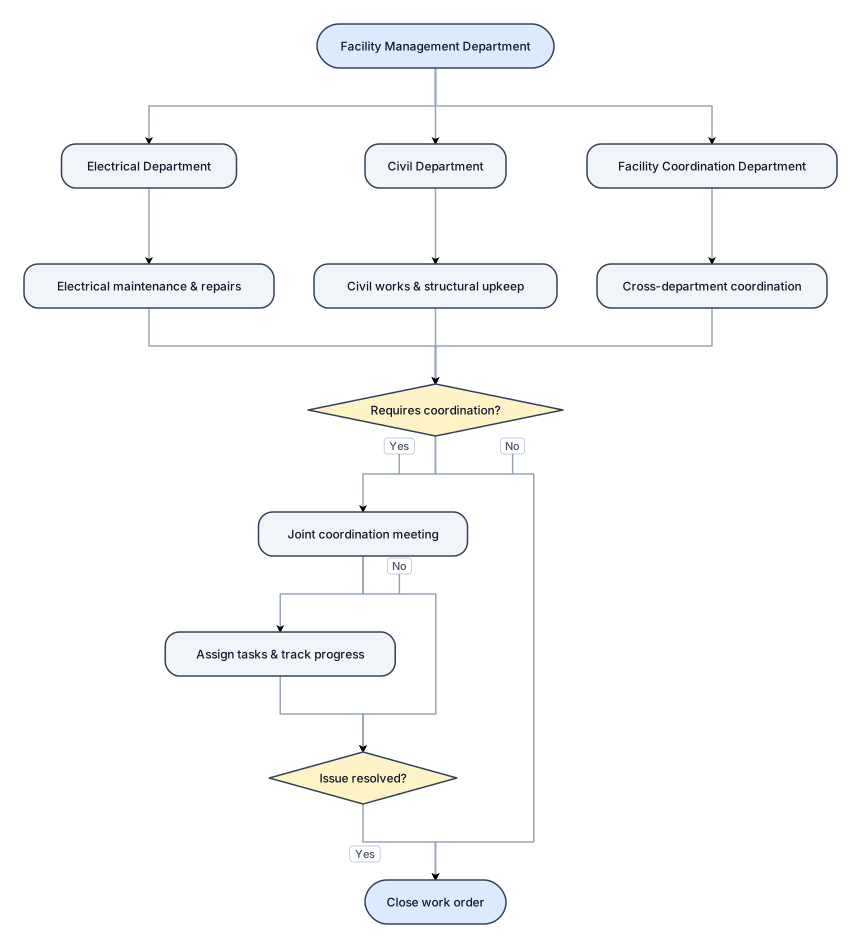
Facility Management Department with Electrical Civil Facility Cordination Departments as Branches
NODE ARCHIVE · REAL DIAGRAM BRIEFS
Diagram Examples from Real Visitor Prompts
Browse eligible diagrams shared by FreeDiagram visitors, inspect the exact prompts, and build your own version.
Browse 3300 real creationsCOMMUNITY OUTPUTS · EXACT PROMPTS
All visitor creations
Showing 1777–1800 of 3300. No stock examples or system defaults. Choose a tool, study a real result, then reopen its prompt as your starting point.
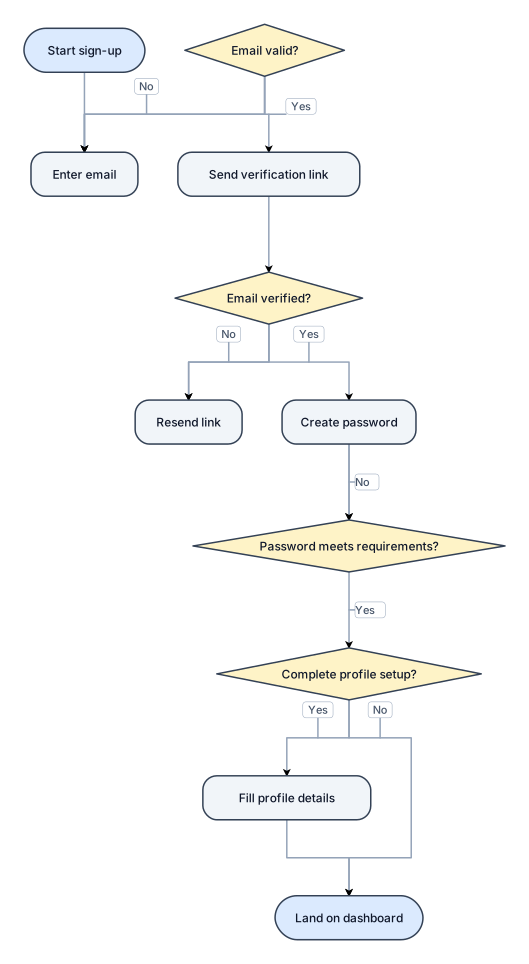
A flowchart for a user sign-up process: enter email, verify email, create password, optional profile setup, then land on the dashboard
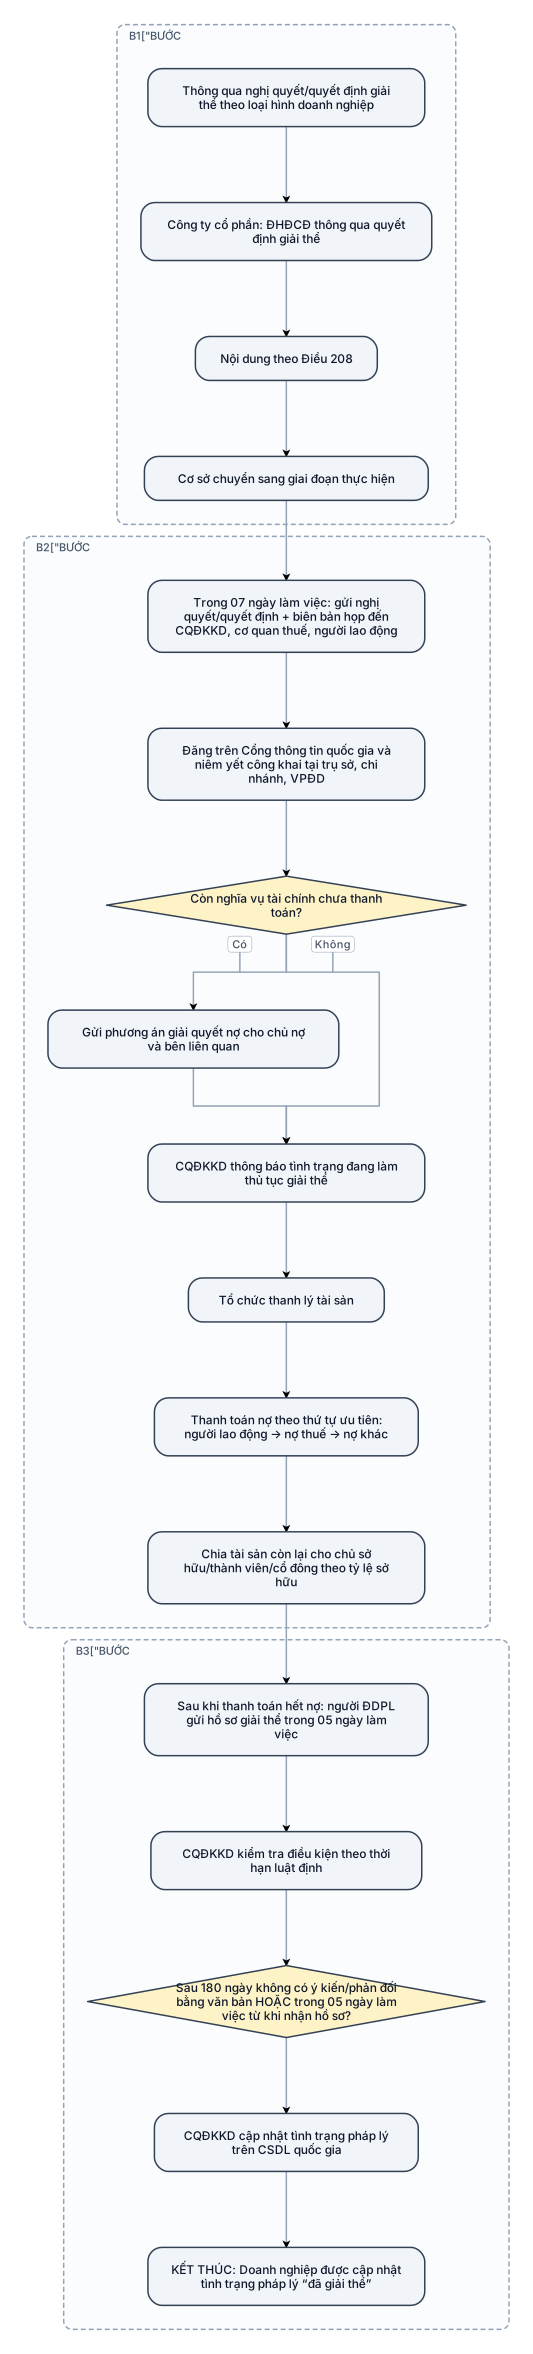
BƯỚC 1. QUYẾT ĐỊNH GIẢI THỂ - Thông qua nghị quyết/quyết định giải thể theo thủ tục tương ứng với loại hình doanh nghiệp. - Đối với công ty cổ phần: Đại hội đồng cổ đông thông qua quyết định giải thể. - Nghị quyết/quyết định phải thể hiện các nội dung chủ yếu theo Điều 208. - Làm cơ sở chuyển sang giai đoạn thực hiện quyết định giải thể. BƯỚC 2. THỰC HIỆN QUYẾT ĐỊNH GIẢI THỂ - Trong 07 ngày làm việc kể từ ngày thông qua: gửi nghị quyết/quyết định giải thể và biên bản họp đến Cơ quan đăng ký kinh doanh, cơ quan thuế và người lao động. - Đăng nghị quyết/quyết định giải thể trên Cổng thông tin quốc gia về đăng ký doanh nghiệp và niêm yết công khai tại trụ sở chính, chi nhánh, văn phòng đại diện. - Nếu còn nghĩa vụ tài chính chưa thanh toán: gửi phương án giải quyết nợ cho chủ nợ và các bên có quyền, nghĩa vụ, lợi ích liên quan. - Cơ quan đăng ký kinh doanh thông báo tình trạng doanh nghiệp đang làm thủ tục giải thể. - Tổ chức thanh lý tài sản. - Thanh toán nợ theo thứ tự ưu tiên: người lao động → nợ thuế → các khoản nợ khác. - Sau khi thanh toán chi phí giải thể và các khoản nợ, chia phần tài sản còn lại cho chủ sở hữu/thành viên/cổ đông theo tỷ lệ sở hữu. BƯỚC 3. KẾT THÚC THỦ TỤC GIẢI THỂ - Sau khi thanh toán hết các khoản nợ: người đại diện theo pháp luật gửi hồ sơ giải thể trong thời hạn 05 ngày làm việc. - Cơ quan đăng ký kinh doanh kiểm tra điều kiện theo thời hạn luật định. - Sau 180 ngày kể từ ngày nhận nghị quyết/quyết định giải thể mà không có ý kiến về việc giải thể hoặc phản đối của bên liên quan bằng văn bản; hoặc trong 05 ngày làm việc kể từ ngày nhận hồ sơ giải thể, Cơ quan đăng ký kinh doanh cập nhật tình trạng pháp lý của doanh nghiệp trên Cơ sở dữ liệu quốc gia về đăng ký doanh nghiệp. - KẾT THÚC: Doanh nghiệp được cập nhật tình trạng pháp lý “đã giải thể”.

A timing diagram for an I2C read transaction: SCL clock, SDA with START condition, 7-bit address byte, ACK bit, data byte, and STOP condition
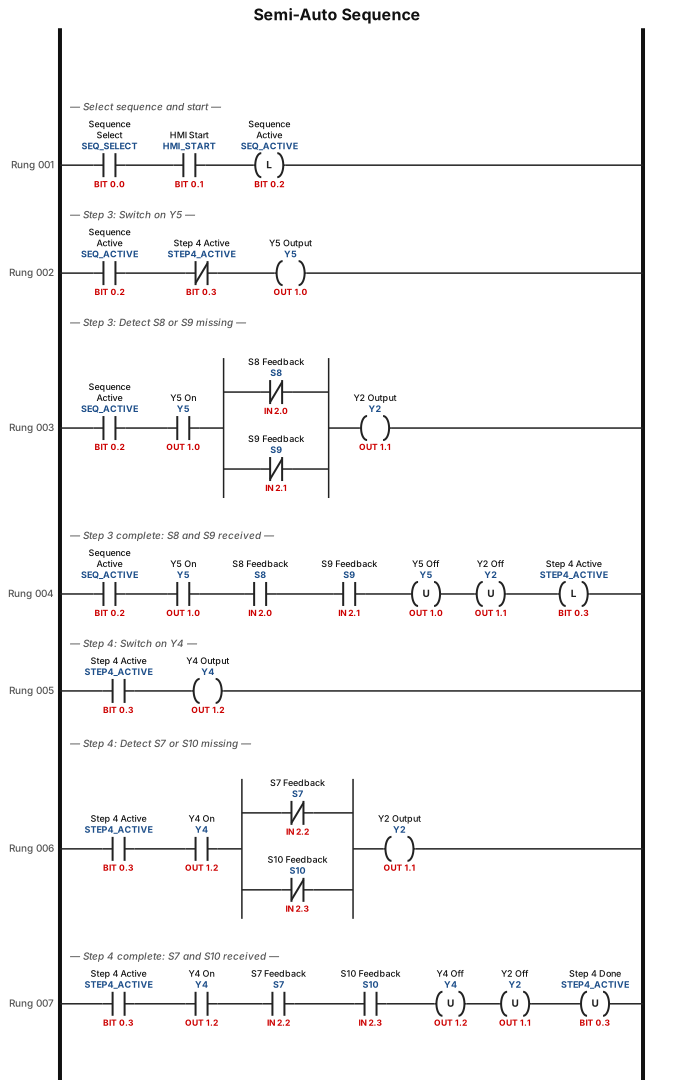
1) Select the sequence in semi auto\ 2) press sequence start from HMI 3) Switch On Y5 on, Limit switch S7 & S10 changes to S8 & S9, In case S8 or S9 is missing Y2 On. If S8 & S9 both limit switch feedback received Switch off Y5 and Y2 4) Switch on Y4 Limit switch S8 & S9 changes to S7 & S10, In case S7 or S10 is missing Y2 On. If S7 & S10 both limit switch feedback received Switch off Y4 and Y2 5) Repeat step 3
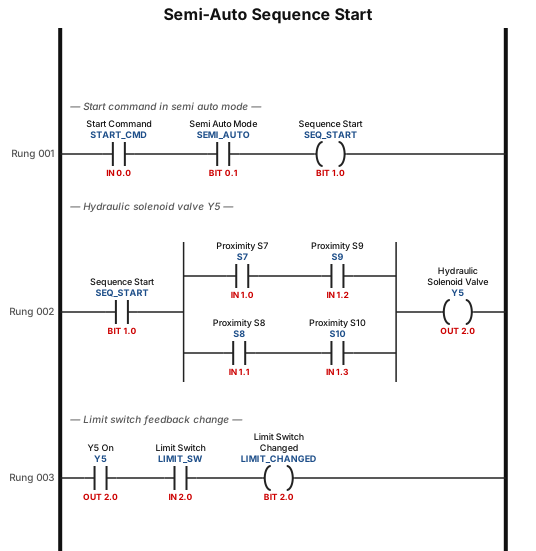
Sequence start command in semi auto mode. Y5 -Hydraulic solenoid valve-on in case S7 & S9 or S8 & S10 proximity switch feedback once Y5 on the limit switch feedback change
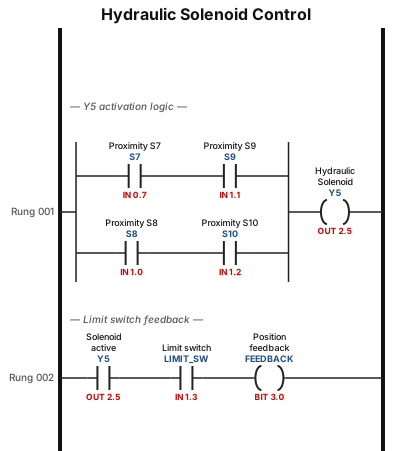
Y5 (Hydraulic solenoid valve) on in case S7 & S9 or S8 & S10 proximity switch feedback once Y5 on the limit switch feedback change
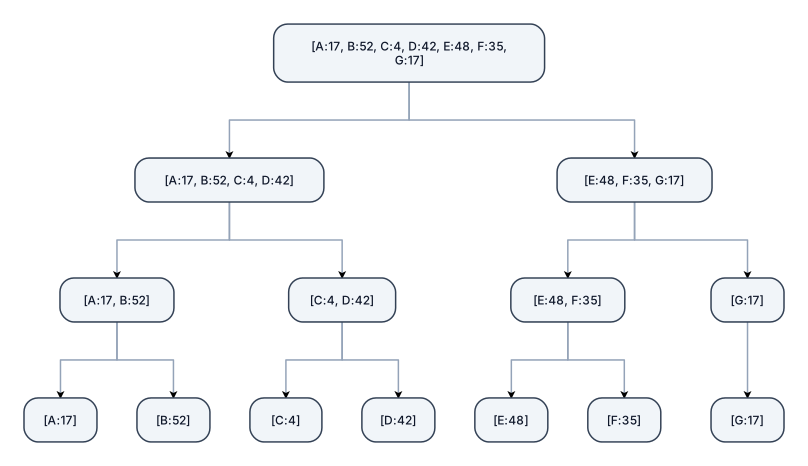
Create only the split phase of a merge sort tree for the following list: [A:17, B:52, C:4, D:42, E:48, F:35, G:17] Do not show any merging or sorting. Start with the complete list at the top: [A:17, B:52, C:4, D:42, E:48, F:35, G:17] Split it into two sublists: [A:17, B:52, C:4, D:42] [E:48, F:35, G:17] Then split these sublists again: [A:17, B:52] [C:4, D:42] [E:48, F:35] [G:17] Finally, split every remaining sublist until every receptor is alone: [A:17] [B:52] [C:4] [D:42] [E:48] [F:35] [G:17] Show this as a clear top to bottom tree. Keep the receptor letters and values together at every level. Do not change the order of the elements during the split phase. Do not sort anything. Do not merge anything. Do not add any extra information. The final level must contain exactly these seven separate elements: [A:17] [B:52] [C:4] [D:42] [E:48] [F:35] [G:17]
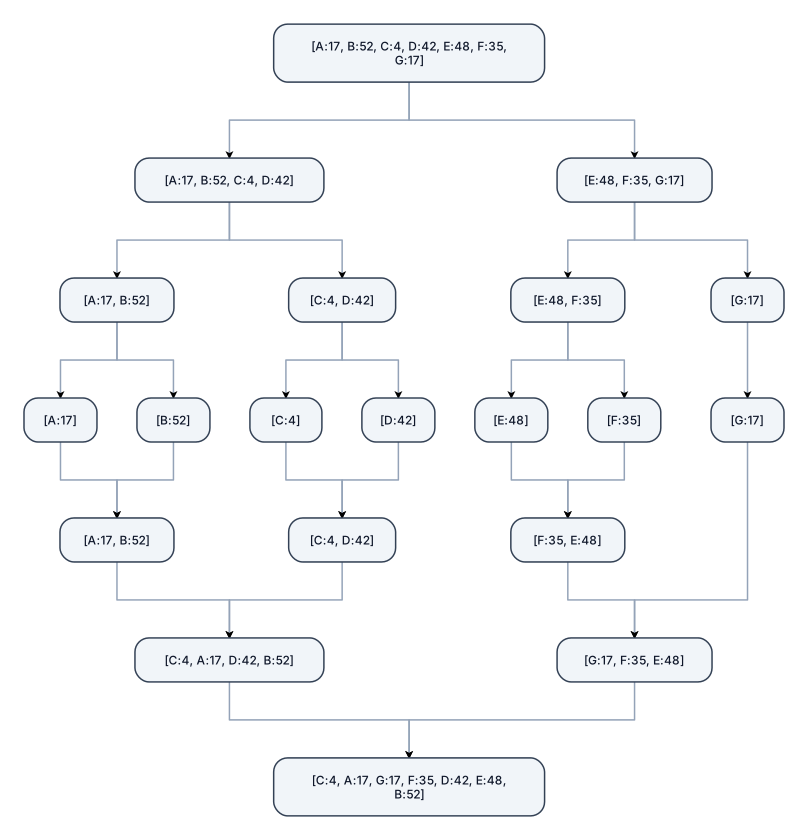
Create a merge sort tree for this list of receptors: A: 17 B: 52 C: 4 D: 42 E: 48 F: 35 G: 17 The tree must show the complete merge sort process. Start with: [A:17, B:52, C:4, D:42, E:48, F:35, G:17] Show the complete split phase first. Divide the list into two smaller lists, then continue dividing each list until every receptor is a separate element. After the split phase, show the complete merge phase. Merge the single elements back together in sorted order. Every merge must clearly show both input sublists and the resulting sorted sublist. Keep the receptor letters attached to their values at every step. The split should be: [A:17, B:52, C:4, D:42, E:48, F:35, G:17] → [A:17, B:52, C:4, D:42] and [E:48, F:35, G:17] → [A:17, B:52] and [C:4, D:42] and [E:48, F:35] and [G:17] → [A:17] [B:52] [C:4] [D:42] [E:48] [F:35] [G:17] Then show every merge: [A:17] + [B:52] → [A:17, B:52] [C:4] + [D:42] → [C:4, D:42] [E:48] + [F:35] → [F:35, E:48] [A:17, B:52] + [C:4, D:42] → [C:4, A:17, D:42, B:52] [F:35, E:48] + [G:17] → [G:17, F:35, E:48] Finally: [C:4, A:17, D:42, B:52] + [G:17, F:35, E:48] → [C:4, A:17, G:17, F:35, D:42, E:48, B:52] The final sorted order must be: C:4, A:17, G:17, F:35, D:42, E:48, B:52 Use a clear top-to-bottom tree layout. Do not skip any split or merge step. Make all text readable. This is for a university assignment, so keep the diagram clean and academic. Do not add unrelated information.
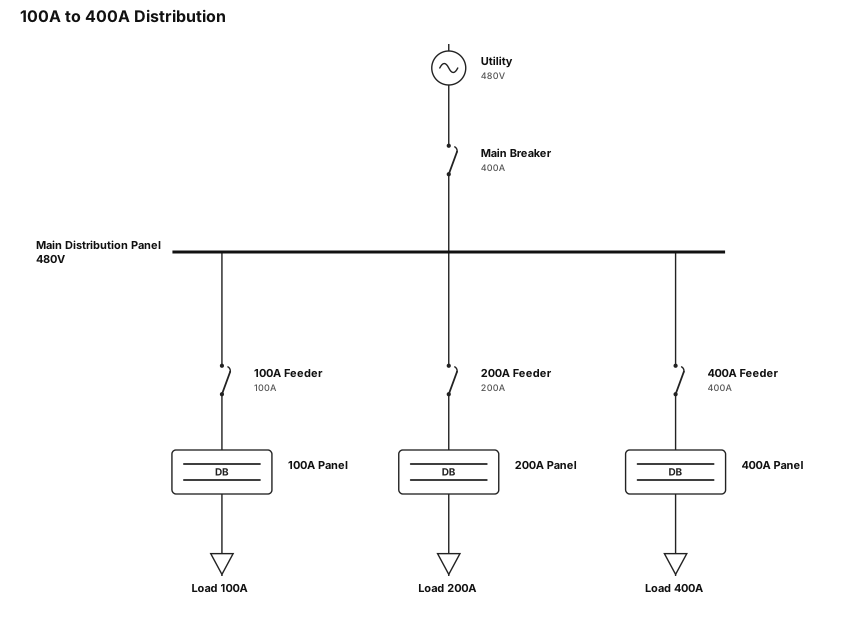
single line drawing for 100Amp to 400Amp
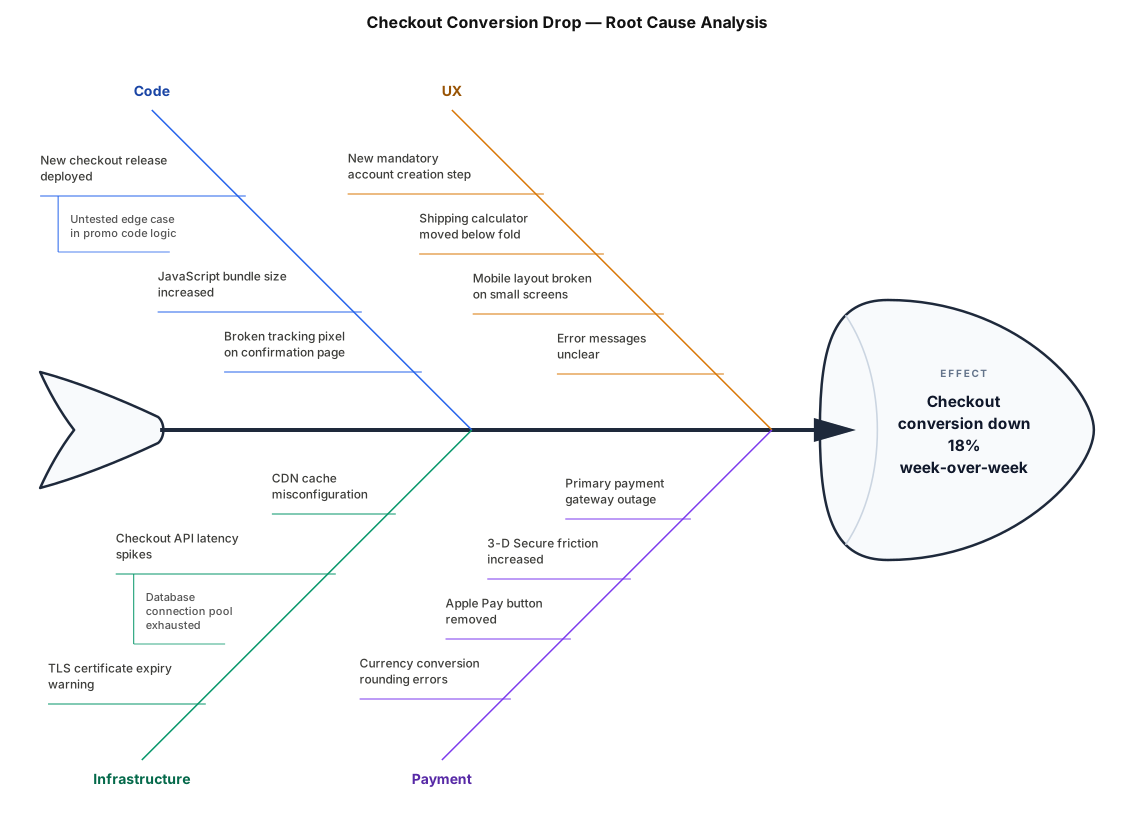
A fishbone diagram analysing why checkout conversion dropped 18% last week: categories for Code, Infrastructure, UX, and Payment
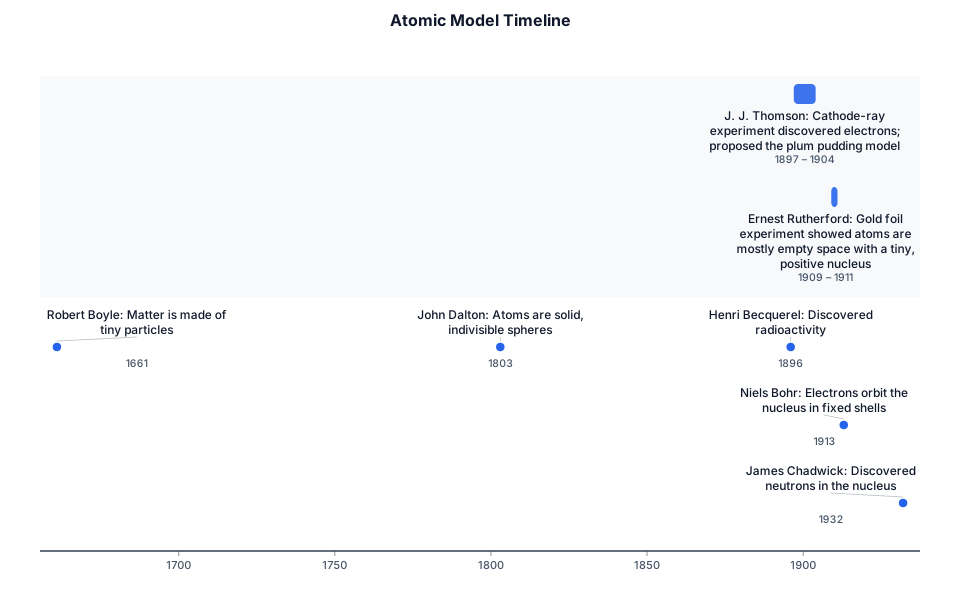
How learning Due date 22 September 2026 Construct a timeline showing the developing ideas of the atom using the scientist shown below. Include the experiments done by J. J Thomson and Ernest Rutherford. Atomic Model Timeline ● 1661 – Robert Boyle: Matter is made of tiny particles. ● 1803 – John Dalton: Atoms are solid, indivisible spheres. ● 1896 – Henri Becquerel: Discovered radioactivity. ● 1897–1904 – J. J. Thomson: Cathode-ray experiment discovered electrons; proposed the plum pudding model. ● 1909–1911 – Ernest Rutherford: Gold foil experiment showed atoms are mostly empty space with a tiny, positive nucleus. ● 1913 – Niels Bohr: Electrons orbit the nucleus in fixed shells. ● 1932 – James Chadwick: Discovered neutrons in the nucleus. What is a timeline? A timeline is a way to show events in the order they happened. You can draw it as a line (horizontal or vertical) and put dates, names, and events along it so it’s easy to see the sequence. What each scientist thought the atom looked like ● Robert Boyle (1661): Matter is made of tiny particles. ● John Dalton (1803): A solid, indivisible sphere. ● Henri Becquerel (1896): No atomic model; discovered radioactivity. ● J. J. Thomson (1904): Positive sphere with negative electrons embedded inside (plum pudding). ● Ernest Rutherford (1911): Tiny, positive nucleus surrounded by mostly empty space. ● Niels Bohr (1913): Nucleus with electrons in fixed shells. ● James Chadwick (1932): Nucleus containing protons and neutrons, with electrons in shells around it.

A breadboard wiring diagram for this boolean expression ((((M' · A')' + (A + E)')' + (((M' · A') + (E' · C'))' + E)')' + (M · C')')
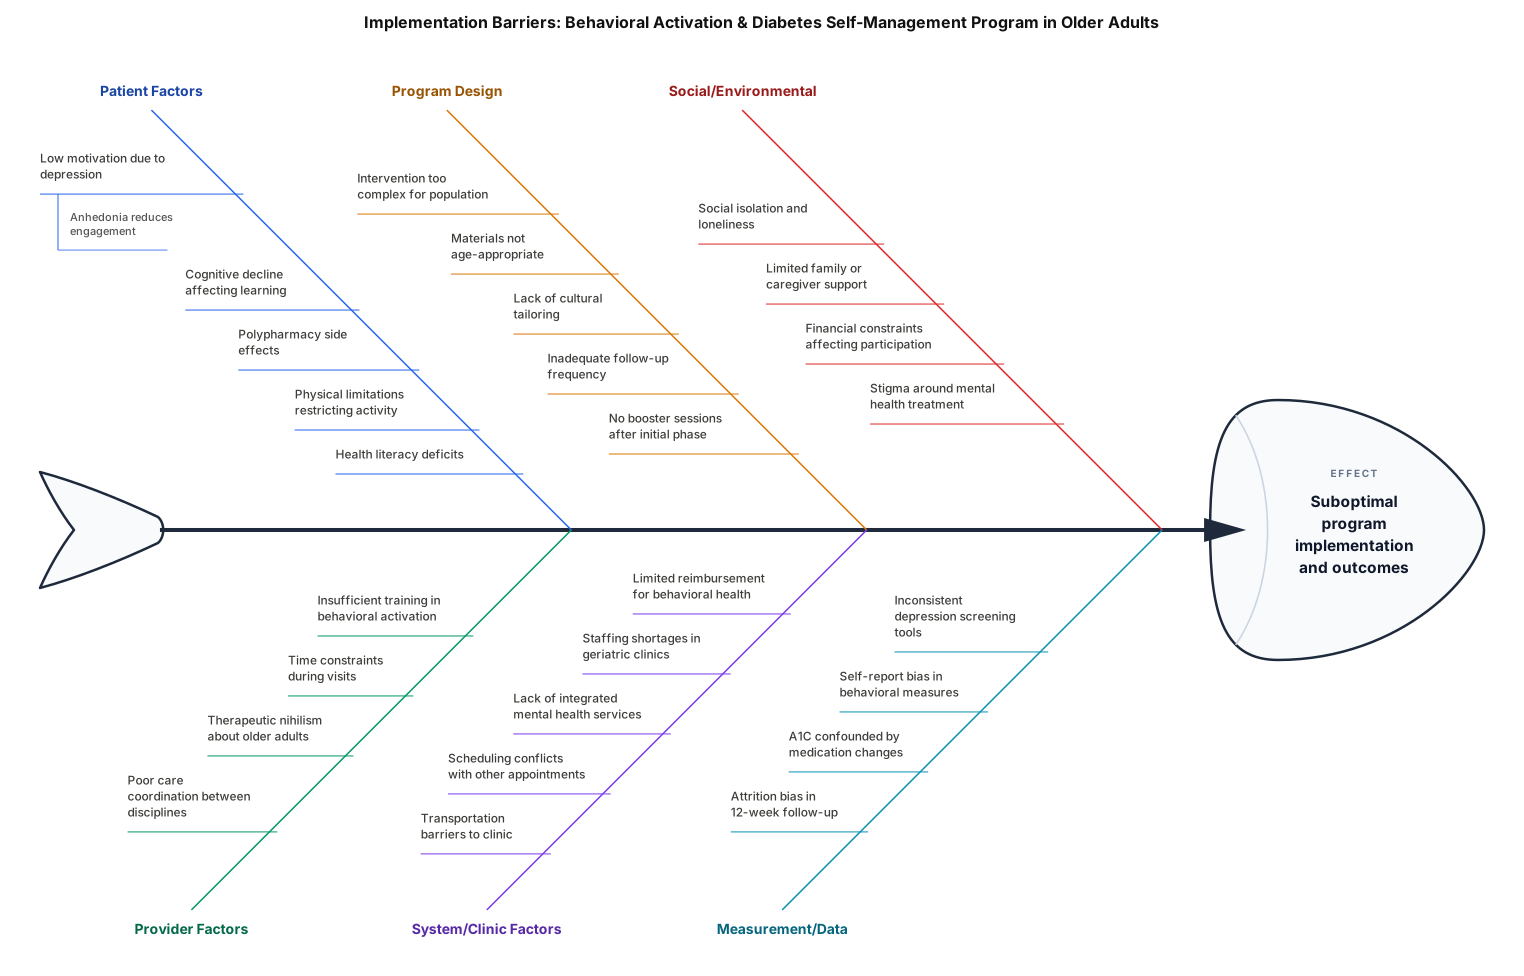
Solve this assignment by Creating a fishbone diagram. You have been developing a problem statement for your area of interest. A fishbone diagram is one method of developing your problem statement. It is a systematic method of looking at various causes. It helps you to think outside your normal thought patterns by suggesting other possible causes of a problem. You may create your own or use the template provided within the instructions. Discussion post In the "Response" area below, create a post of 300-500 words, provide a brief summary statement of your fishbone diagram. Discuss your problem statement and the identified potential causes. Offer references to support your work. This is my proposed topic: Picot Question - In adults aged 65 years and older with type 2 diabetes and mild-to-moderate depressive symptoms receiving outpatient geriatric care, how does participation in a brief behavioral-activation and diabetes self-management education program, compared with usual care, affect depressive symptoms, diabetes self-management behaviors, and hemoglobin A1C over 12 weeks? Topic; Implementation of a Brief Behavioral-Activation and Diabetes Self-Management Education Program to Improve Depressive Symptoms, Self-Management, and Glycemic Control in Older Adults With Type 2 Diabetes in Outpatient Geriatric Care. Implementation of a Brief Behavioral Activation and Diabetes Self-Management Education Program for Older Adults With Type 2 Diabetes in Outpatient Geriatric Care-
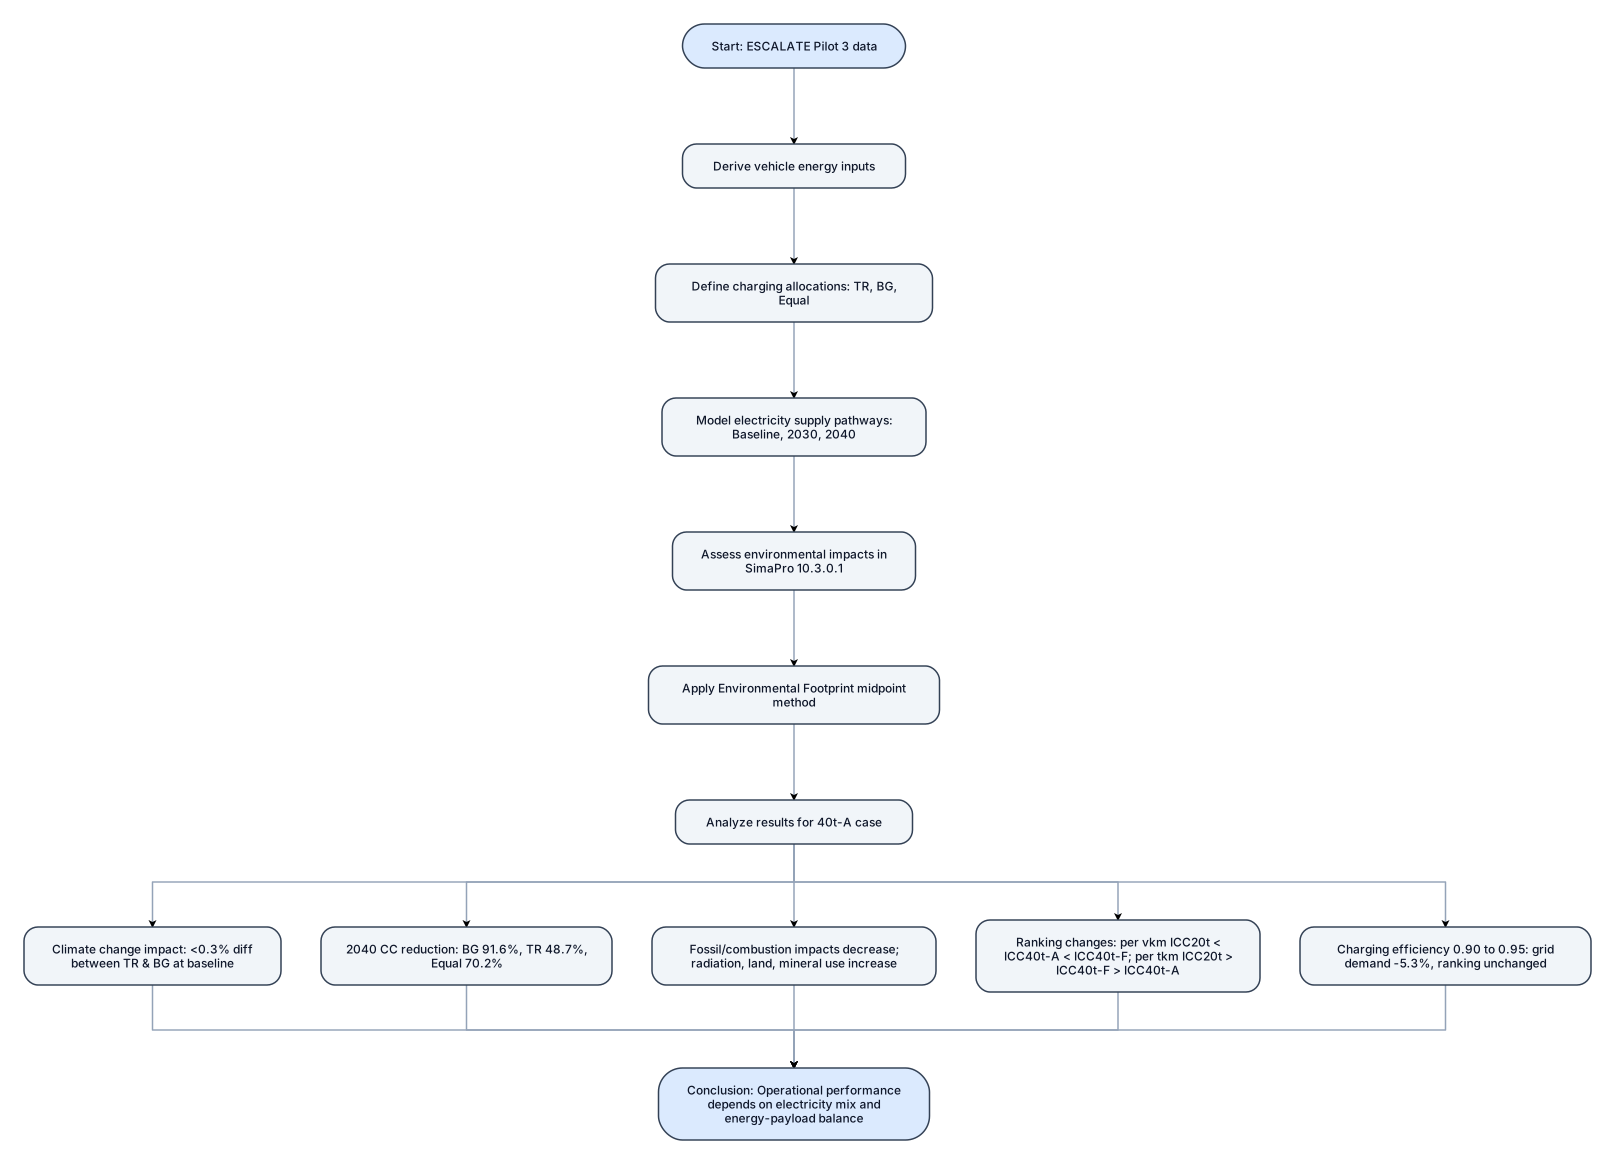
Abstract This study provides an operational environmental performance assessment of battery electric long haul freight transport in a cross border Türkiye-Bulgaria context, using the Istanbul-Sofia corridor as a case study. The analysis considered vehicle operating conditions, charging allocations, baseline and projected electricity supply pathways for 2030 and 2040, and charging efficiency assumptions. Vehicle energy inputs were derived from ESCALATE Pilot 3 data, and environmental impacts were assessed in SimaPro 10.3.0.1 using the Environmental Footprint midpoint method. For the 40t-A case, baseline climate change impacts differed by less than 0.3% between the Türkiye and Bulgaria charging allocations. By 2040, climate change impacts decreased by 91.6% for BG, 48.7% for TR, and 70.2% for Equal TR-BG relative to baseline. Fossil and combustion related impacts generally decreased, while ionising radiation, land use, and mineral and metal resource use became more prominent in selected 2040 pathways. The functional basis changed the comparative climate change ranking from ICC, 20t < ICC, 40t-A < ICC, 40t-F on a vehicle kilometre basis to ICC, 20t > ICC, 40t-F > ICC, 40t-A on a tonne kilometre basis. Increasing charging efficiency from 0.90 to 0.95 reduced grid side electricity demand by 5.3% without changing the ranking. The results show that operational performance depends strongly on electricity supply composition and the balance between energy demand and payload capacity.
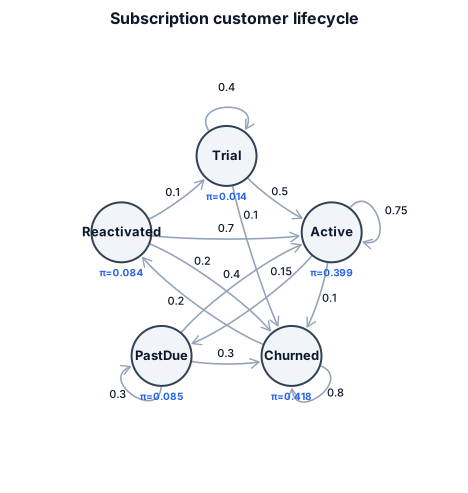
A Markov chain for subscription customers moving between trial, active, past due, churned, and reactivated states
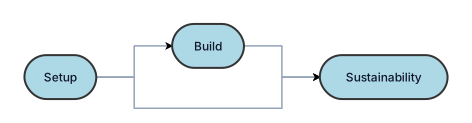
I need a three arrows in a circle showing continues lifecycle. Light blue color is ok, text inside the arrows as follows: One arrow shows setup, second shows build, third shows sustanability. I was looking for three arrows not boxes
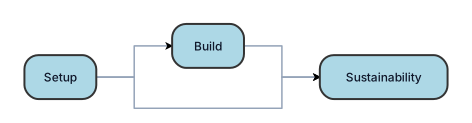
I need a three arrows in a circle showing continues lifecycle. Light blue color is ok, text inside the arrows as follows: One arrow shows setup, second shows build, third shows sustanability.
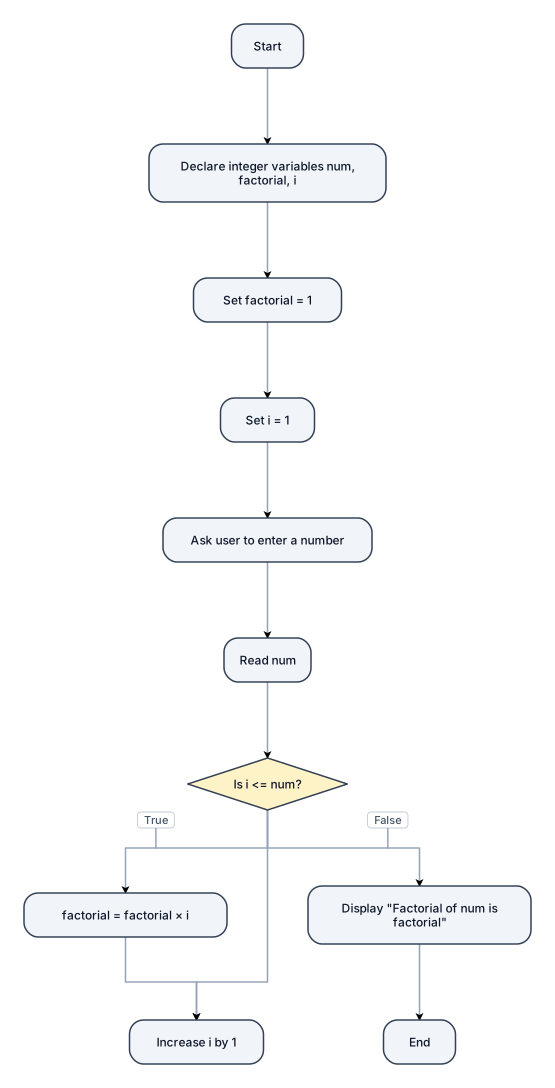
Create a flowchart for a C++ program that calculates the factorial of an integer using a while loop. Start → Declare integer variables num, factorial, and i → Set factorial = 1 → Set i = 1 → Ask the user to enter a number → Read num → Decision: Is i <= num? If True → Calculate factorial = factorial × i → Increase i by 1 → Return to "Is i <= num?" If False → Display "Factorial of num is factorial" → End. Use standard flowchart symbols. Label the decision branches clearly as True and False.
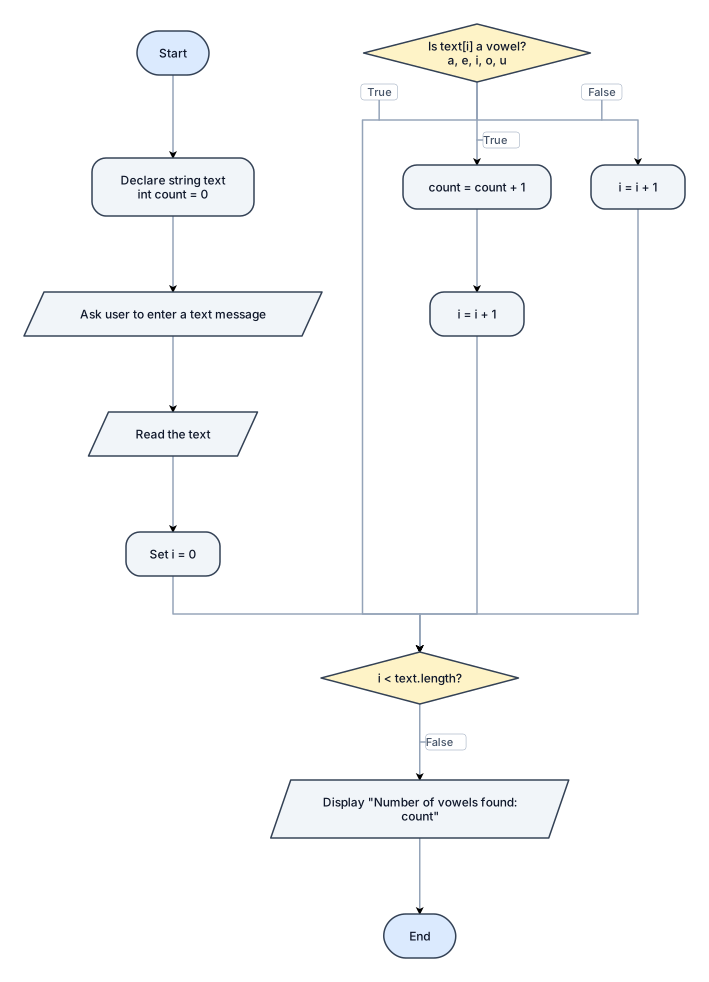
Create a flowchart for a C++ Vowel Counter program. Start → Declare string text and integer count = 0 → Ask the user to enter a text message → Read the text → Set i = 0. Decision 1: Is i < text.length()? * True → Go to Decision 2. * False → Display "Number of vowels found: count" → End. Decision 2: Is text[i] a vowel (a, e, i, o, or u)? * True → count = count + 1 → i = i + 1 → Return to Decision 1. * False → i = i + 1 → Return to Decision 1. Use standard flowchart symbols: oval for Start/End, parallelogram for input/output, rectangle for processing, and diamond for decisions. Label every decision branch clearly as True or False. make it like the diagrams in apps diagrams, make the diamonds and other shapes sharp corners and the diamond is symmetrical vertical and horizontal, still follow the format like in apps.diagrams make the rectangles have sharp corners.
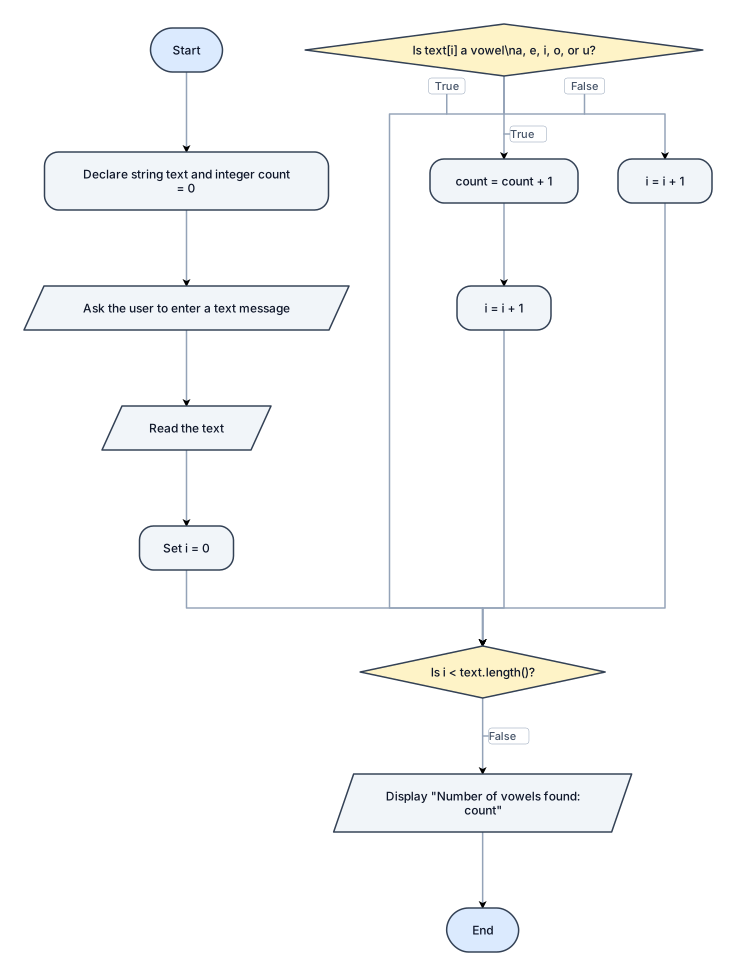
Create a flowchart for a C++ Vowel Counter program. Start → Declare string text and integer count = 0 → Ask the user to enter a text message → Read the text → Set i = 0. Decision 1: Is i < text.length()? * True → Go to Decision 2. * False → Display "Number of vowels found: count" → End. Decision 2: Is text[i] a vowel (a, e, i, o, or u)? * True → count = count + 1 → i = i + 1 → Return to Decision 1. * False → i = i + 1 → Return to Decision 1. Use standard flowchart symbols: oval for Start/End, parallelogram for input/output, rectangle for processing, and diamond for decisions. Label every decision branch clearly as True or False. make it like the diagrams in apps diagrams, make the diamonds and other shapes sharp corners and the diamond is symmetrical vertical and horizontal, still follow the format like in apps.diagrams
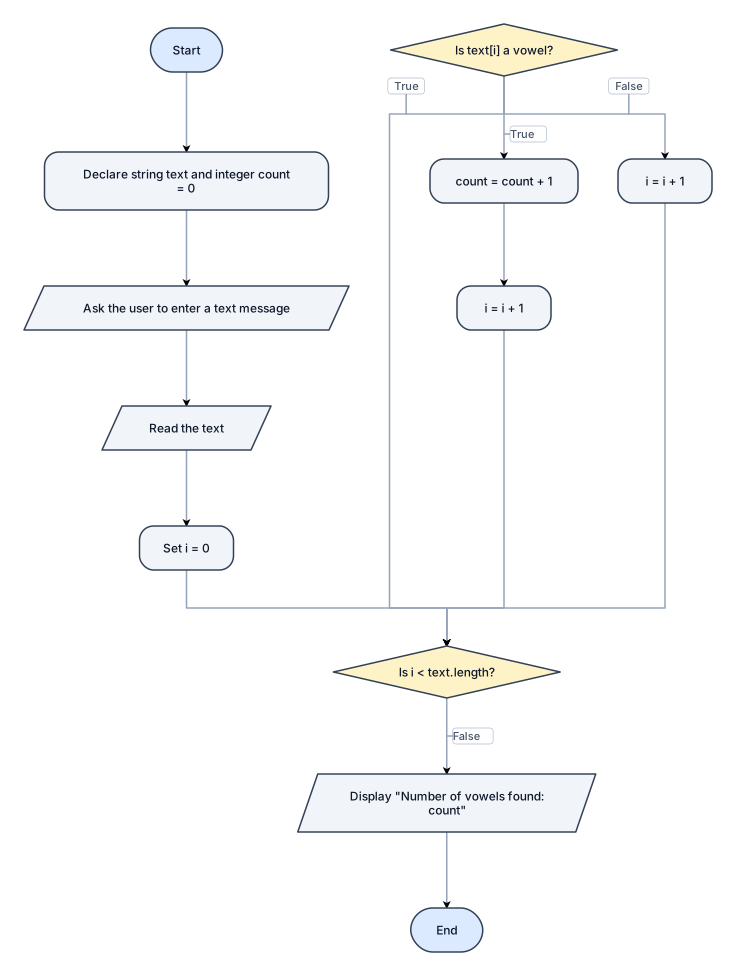
Create a flowchart for a C++ Vowel Counter program. Start → Declare string text and integer count = 0 → Ask the user to enter a text message → Read the text → Set i = 0. Decision 1: Is i < text.length()? * True → Go to Decision 2. * False → Display "Number of vowels found: count" → End. Decision 2: Is text[i] a vowel (a, e, i, o, or u)? * True → count = count + 1 → i = i + 1 → Return to Decision 1. * False → i = i + 1 → Return to Decision 1. Use standard flowchart symbols: oval for Start/End, parallelogram for input/output, rectangle for processing, and diamond for decisions. Label every decision branch clearly as True or False. make it like the diagrams in apps diagrams, make the diamonds and other shapes sharp corners and the diamond is symmetrical vertical and horizontal
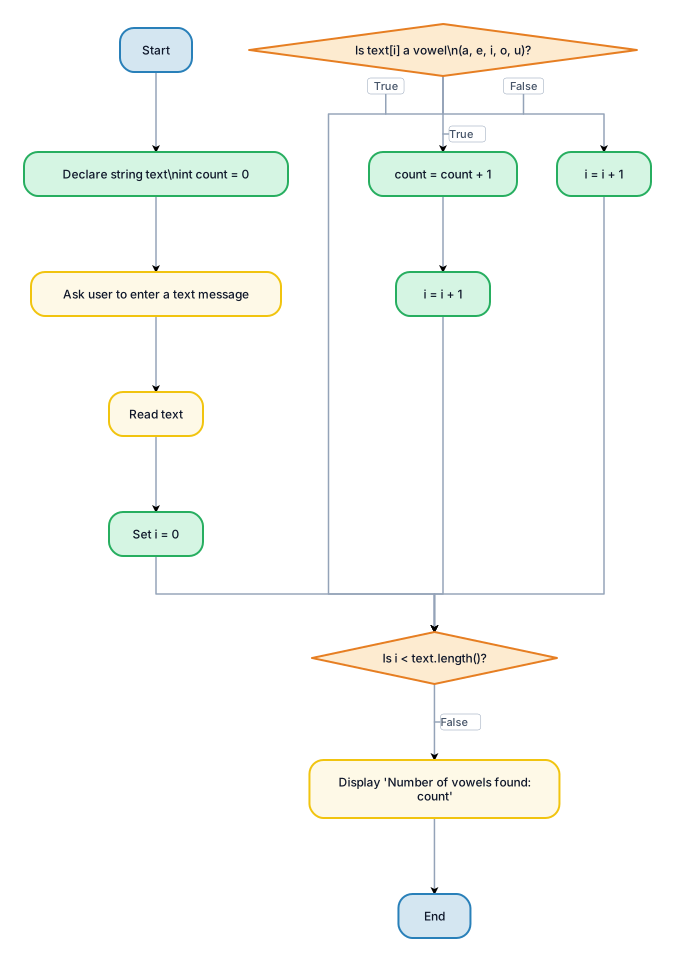
Create a flowchart for a C++ Vowel Counter program. Start → Declare string text and integer count = 0 → Ask the user to enter a text message → Read the text → Set i = 0. Decision 1: Is i < text.length()? * True → Go to Decision 2. * False → Display "Number of vowels found: count" → End. Decision 2: Is text[i] a vowel (a, e, i, o, or u)? * True → count = count + 1 → i = i + 1 → Return to Decision 1. * False → i = i + 1 → Return to Decision 1. Use standard flowchart symbols: oval for Start/End, parallelogram for input/output, rectangle for processing, and diamond for decisions. Label every decision branch clearly as True or False. make it like the diagrams in apps diagrams
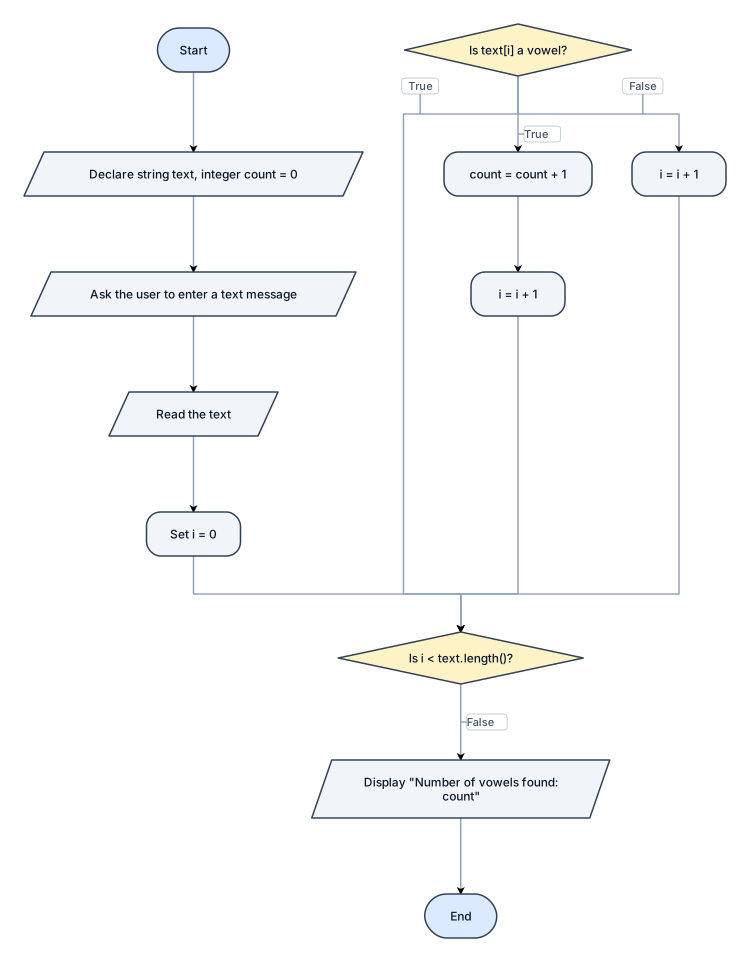
Create a flowchart for a C++ Vowel Counter program. Start → Declare string text and integer count = 0 → Ask the user to enter a text message → Read the text → Set i = 0. Decision 1: Is i < text.length()? * True → Go to Decision 2. * False → Display "Number of vowels found: count" → End. Decision 2: Is text[i] a vowel (a, e, i, o, or u)? * True → count = count + 1 → i = i + 1 → Return to Decision 1. * False → i = i + 1 → Return to Decision 1. Use standard flowchart symbols: oval for Start/End, parallelogram for input/output, rectangle for processing, and diamond for decisions. Label every decision branch clearly as True or False.