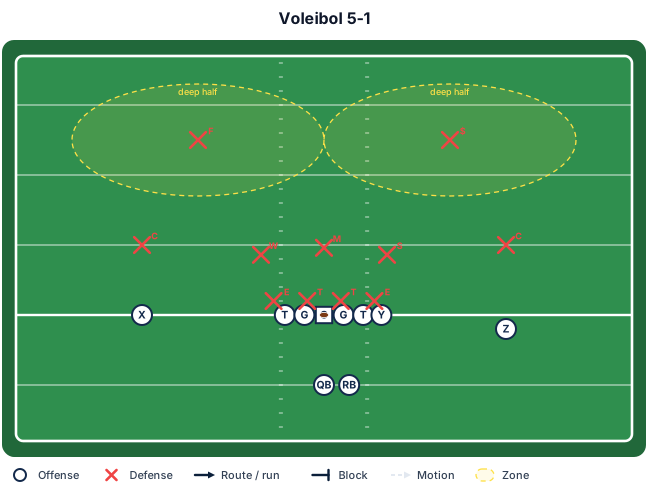
Crea un libro de jugadas de voleibol, con 6 jugador contra 6, con una formacion 5-1
NODE ARCHIVE · REAL DIAGRAM BRIEFS
Diagram Examples from Real Visitor Prompts
Browse eligible diagrams shared by FreeDiagram visitors, inspect the exact prompts, and build your own version.
Browse 1021 real creationsCOMMUNITY OUTPUTS · EXACT PROMPTS
All visitor creations
Showing 457–480 of 1021. No stock examples or system defaults. Choose a tool, study a real result, then reopen its prompt as your starting point.
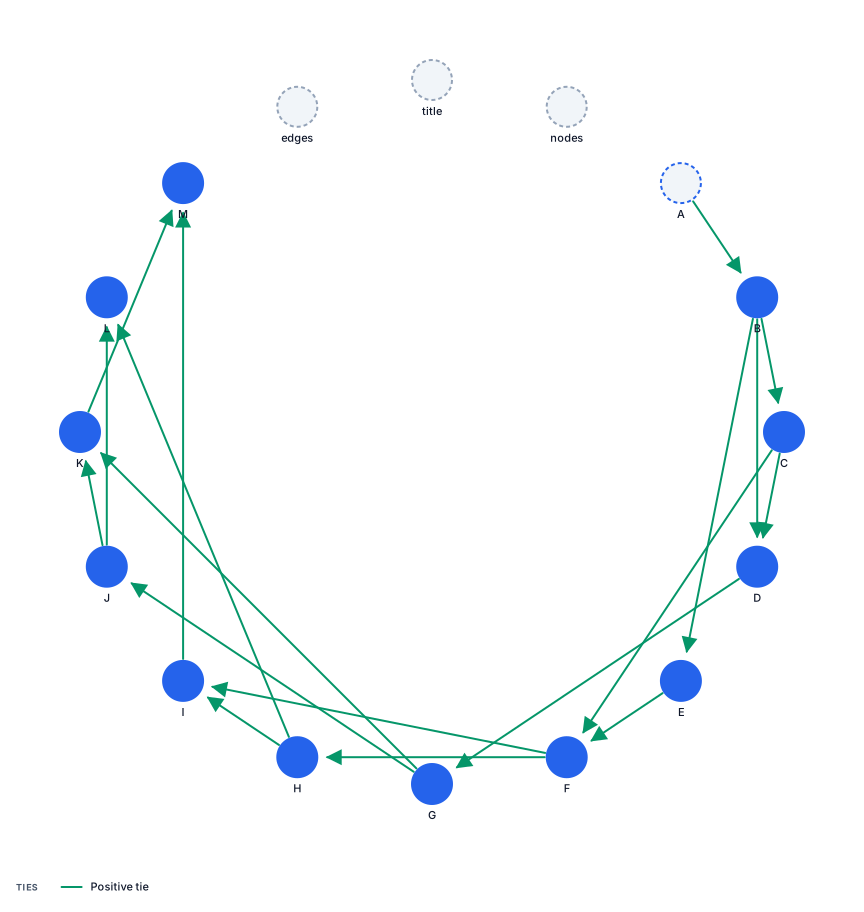
Sociograma de una institucion educativa
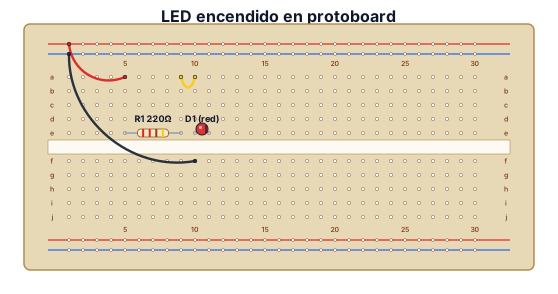
Crea un esquema de un led encendido en una protoboard
Crea un esquema de un encendido/apagado de un led en una protoboard
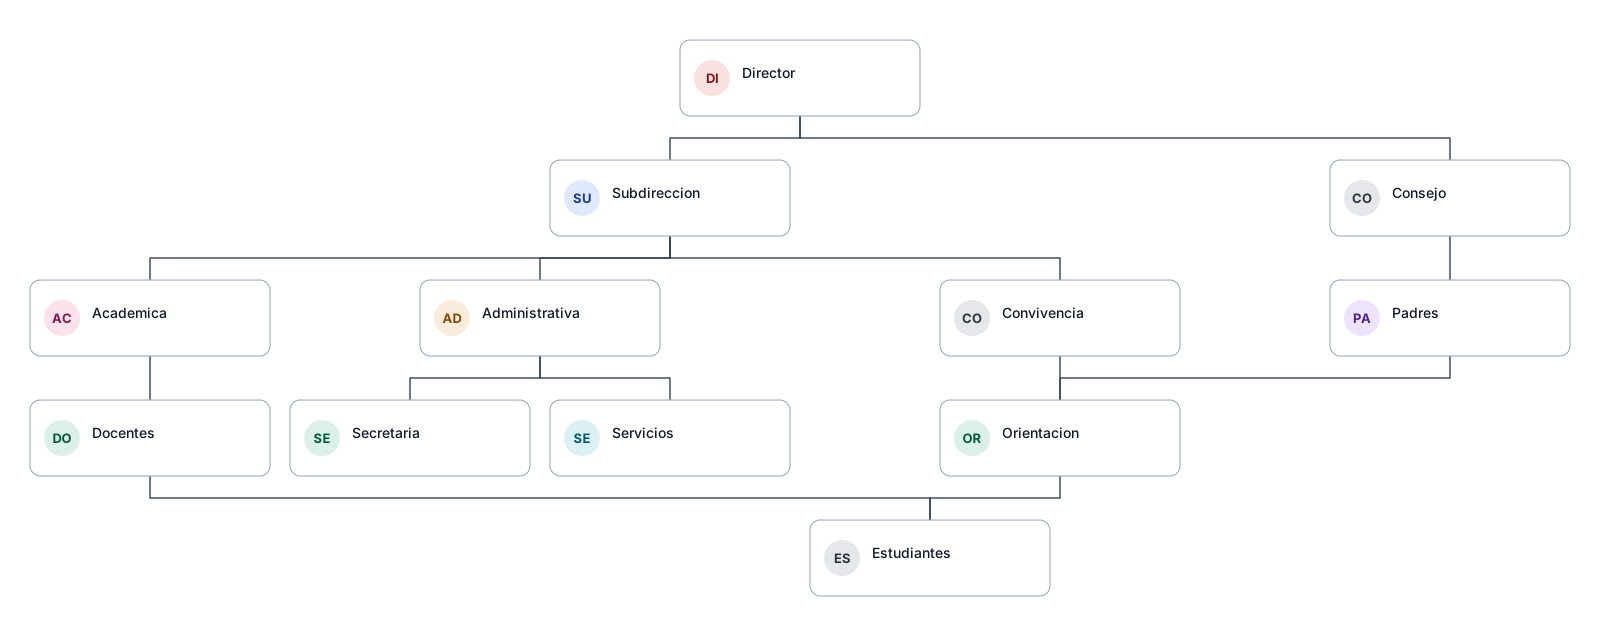
Organigrama de una institucion educativa publica
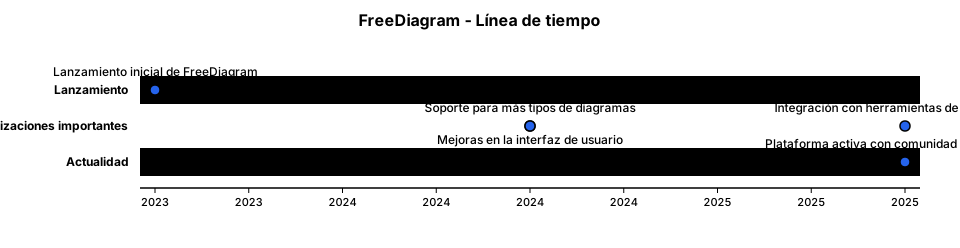
Crea una linea de tiempo de FreeDiagram, cuando salio, actualizaciones importantes y actualidad
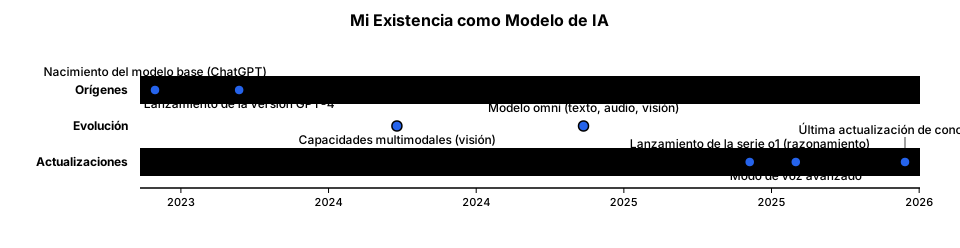
Crea una linea de tiempo de tu propia existencia, y actualizaciones
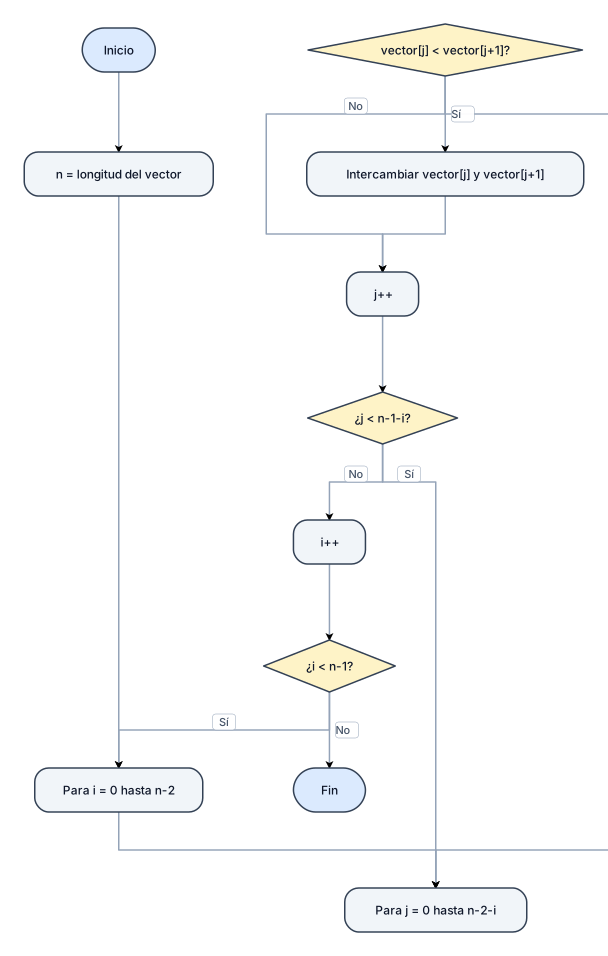
Crea un diagrama de flujo que ordene un vector de mayor a menor
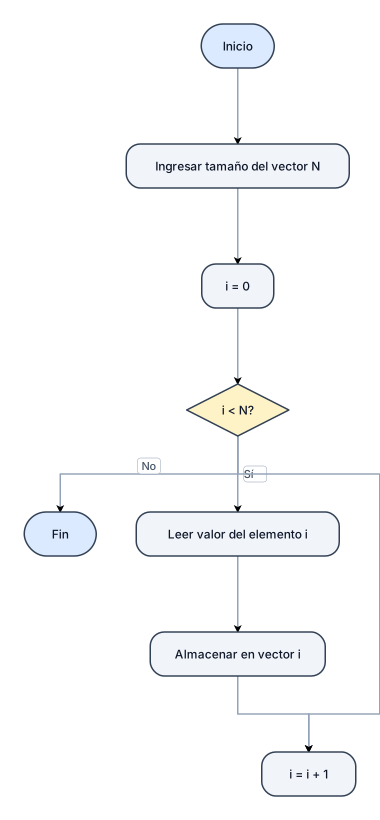
Crea un diagrama de flujo de un vector cargado
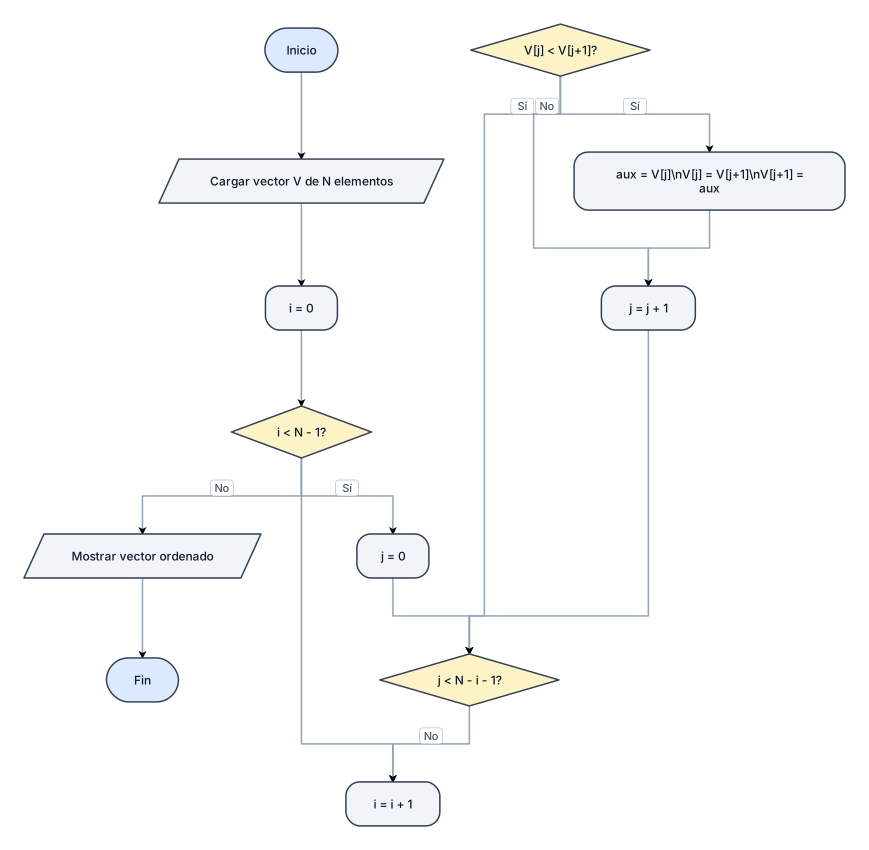
Crea un diagrama de flujo que ordene de mayor a menor un vector cargado
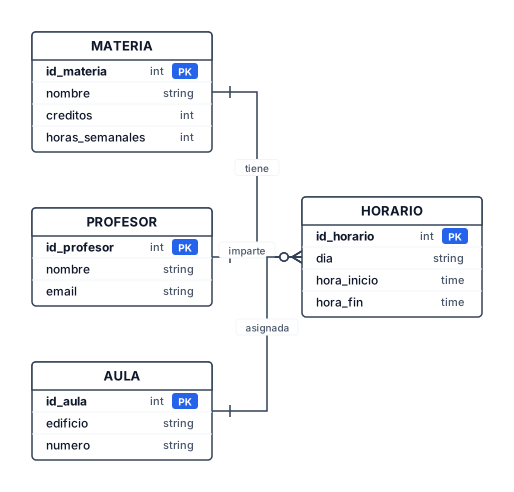
Crea una base de datos con las materias de una escuela
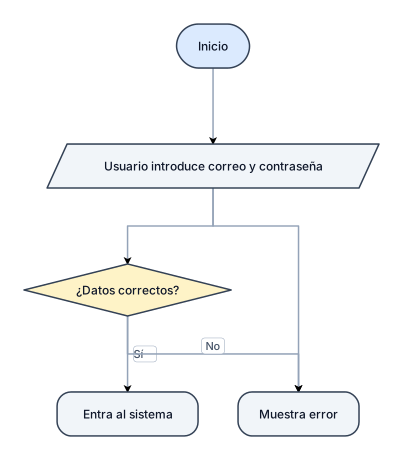
Crear un sistema de login donde el usuario introduce su correo y contraseña, se verifica si los datos son correctos y, si lo son, entra al sistema; de lo contrario, se muestra un error
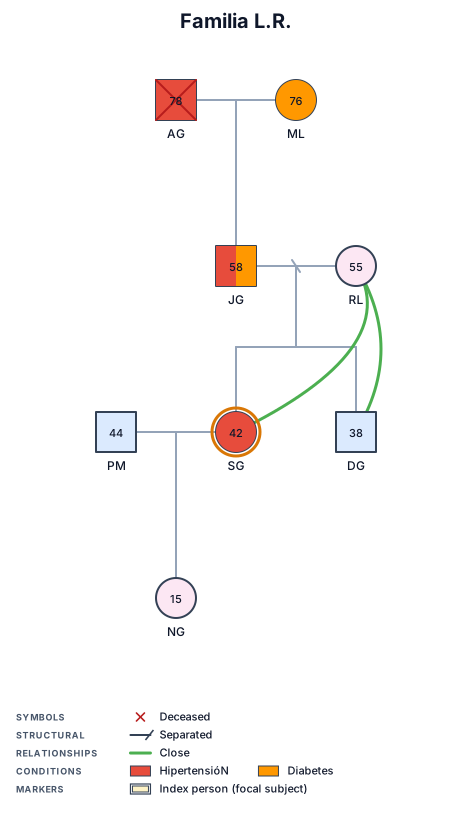
- FAMILIA L.R.* *Entrevistada:* Mujer 42 años, voluntaria. Persona índice. *Generación 1 (abuelos paternos):* - A.G. - Hombre, 78 años, fallecido, hipertensión, fumador. - M.L. - Mujer, 76 años, viva, diabetes. *Generación 2 (padres):* - J.G. - Hombre, 58 años, vivo, hipertensión + diabetes. Hijo de A.G. y M.L. - R.L. - Mujer, 55 años, viva, sana. Separada de J.G. Factor protector, apoyo emocional. *Generación 3 (hijos y nieta):* - S.G. - Mujer, 42 años, viva, hipertensión. Hija de J.G. y R.L. *PERSONA ÍNDICE.* - D.G. - Hombre, 38 años, vivo, sano. Hermano de S.G. - P.M. - Hombre, 44 años, vivo, sano. Pareja de S.G. - N.G. - Mujer, 15 años, viva, sana. Hija de S.G. y P.M. *Patrones encontrados:* 1. Hipertensión hereditaria: A.G., J.G., S.G. (3 generaciones). 2. Diabetes hereditaria: M.L., J.G. (2 generaciones). 3. Factor de riesgo ambiental: Tabaquismo en G1, estrés crónico en G2 y G3. 4. Factor protector: Vínculo cercano con R.L., deporte en D.G. *Interpretación psicofisiológica:* Interacción gen-ambiente. Predisposición genética a hipertensión y diabetes potenciada por estrés y hábitos. El apoyo social de R.L. regula el sistema nervioso. *Instrucción para la IA:* Genograma 3 generaciones, solo iniciales, cuadro=hombre, círculo=mujer, X=fallecido, rojo=hipertensión, naranja=diabetes, doble borde en S.G.
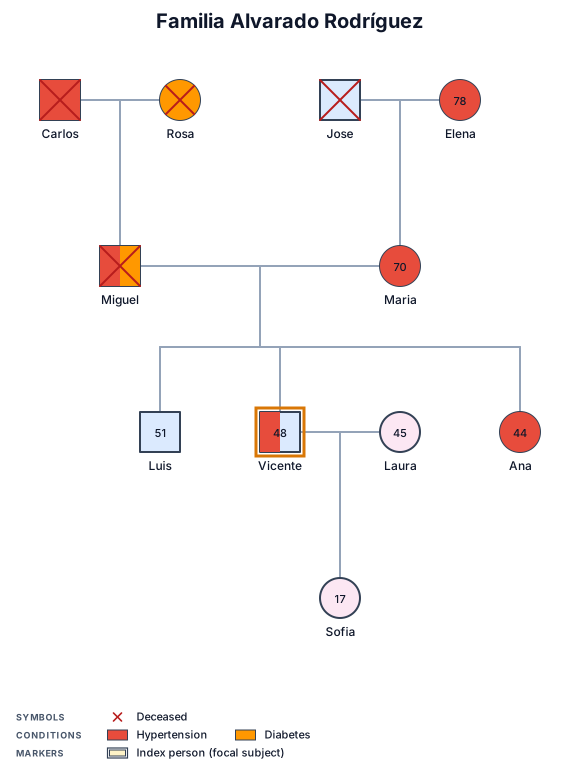
Haz un GENOGRAMA FAMILIAR DE 3 GENERACIONES. PERSONA ÍNDICE: Vicente Rodrigo Alvarado Rodríguez, hombre de 48 años, hipertensión controlada. Márcalo como persona índice. PRIMERA GENERACIÓN: Carlos, hombre, fallecido, hipertensión. Rosa, mujer, fallecida, diabetes. Carlos y Rosa fueron pareja y tuvieron un hijo llamado Miguel. José, hombre, fallecido, sin enfermedades conocidas. Elena, mujer, 78 años, hipertensión. José y Elena fueron pareja y tuvieron una hija llamada María. SEGUNDA GENERACIÓN: Miguel, hombre, fallecido a los 68 años, hipertensión y diabetes. María, mujer, 70 años, hipertensión. Miguel y María fueron pareja. Miguel y María tuvieron tres hijos: 1. Luis, hombre, 51 años, sin enfermedades conocidas. 2. Vicente, hombre, 48 años, hipertensión controlada. 3. Ana, mujer, 44 años, hipertensión. Luis, Vicente y Ana son hermanos y deben aparecer conectados a los mismos padres, Miguel y María. TERCERA GENERACIÓN: Vicente está en pareja con Laura, mujer de 45 años, sin enfermedades importantes. Vicente y Laura tienen una hija: Sofía, mujer, 17 años, sin enfermedades conocidas. RELACIONES QUE DEBE MOSTRAR: Carlos + Rosa → hijo Miguel. José + Elena → hija María. Miguel + María → hijos Luis, Vicente y Ana. Vicente + Laura → hija Sofía. Usa símbolos estándar de genograma: cuadrado = hombre, círculo = mujer, X = persona fallecida, línea horizontal = pareja, línea vertical = padres e hijos. Muestra las enfermedades como indicadores de hipertensión o diabetes. No agregues personas ni relaciones adicionales. Organiza el genograma claramente en tres niveles generacionales.
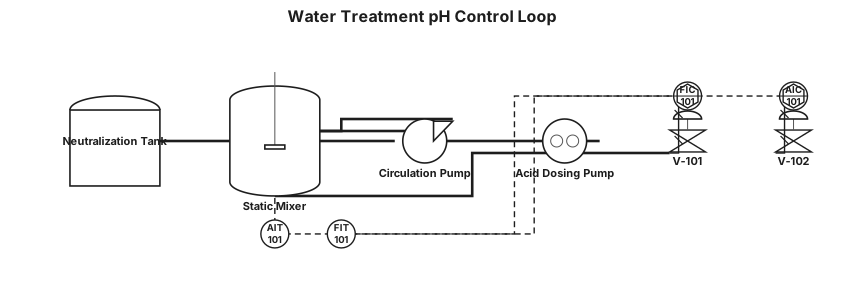
Water treatment loop with pH control and dosing pump
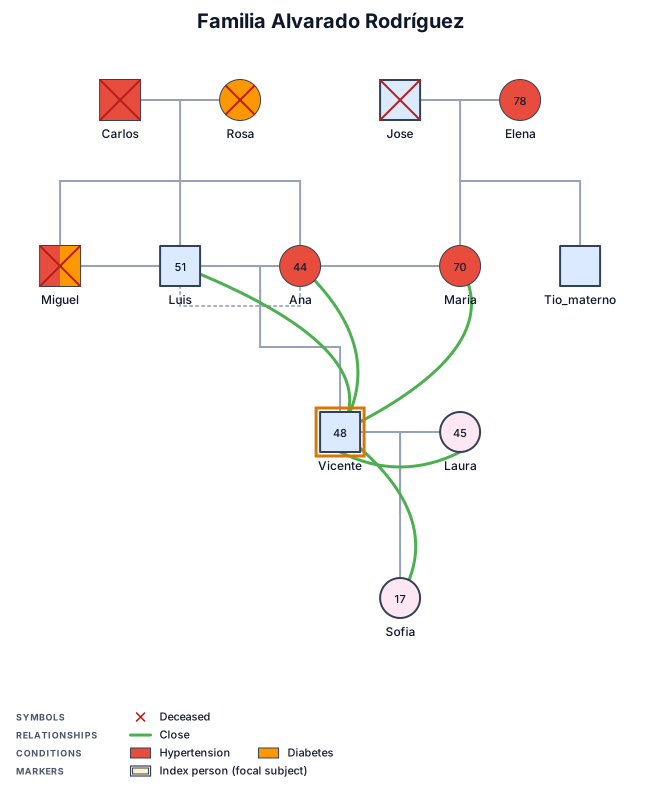
Vicente Rodrigo Alvarado Rodríguez es un hombre de 48 años que vive con su esposa y su hija. Para elaborar el genograma se analizaron tres generaciones de su familia. Por parte de su padre, Vicente tiene un abuelo paterno llamado Carlos, quien falleció a los 76 años y tenía antecedentes de hipertensión. Su abuela paterna, Rosa, falleció a los 72 años y padecía diabetes. Carlos y Rosa estuvieron casados y tuvieron tres hijos. El padre de Vicente, Miguel, fue uno de sus hijos. Miguel falleció a los 68 años y tenía antecedentes de hipertensión y diabetes. Sus otros dos hijos fueron Luis, hermano mayor de Vicente, actualmente de 51 años y sin enfermedades conocidas, y Ana, hermana menor de Vicente, de 44 años, quien presenta hipertensión. Por parte de su madre, Vicente tiene un abuelo materno llamado José, quien falleció a los 80 años y no tenía antecedentes importantes conocidos. Su abuela materna, Elena, tiene actualmente 78 años y presenta hipertensión. José y Elena tuvieron dos hijos: la madre de Vicente, María, y un hermano. María tiene actualmente 70 años y presenta hipertensión. Se casó con Miguel y tuvieron tres hijos: Luis, Vicente y Ana. Vicente, de 48 años, está casado con Laura, de 45 años, quien no presenta antecedentes de enfermedades importantes. Tienen una hija llamada Sofía, de 17 años, que no presenta enfermedades conocidas. En la familia se observa una repetición de antecedentes de hipertensión en diferentes integrantes de las tres generaciones. También existen antecedentes de diabetes principalmente en la línea paterna. La familia mantiene relaciones cercanas y existe apoyo entre varios de sus integrantes. El objetivo del genograma es representar las relaciones familiares, los antecedentes de salud y los posibles patrones que pueden observarse a través de tres generaciones.

A three-generation genogram for a family therapy case: grandparents on both sides, parents who divorced and remarried, two children — the younger showing anxiety
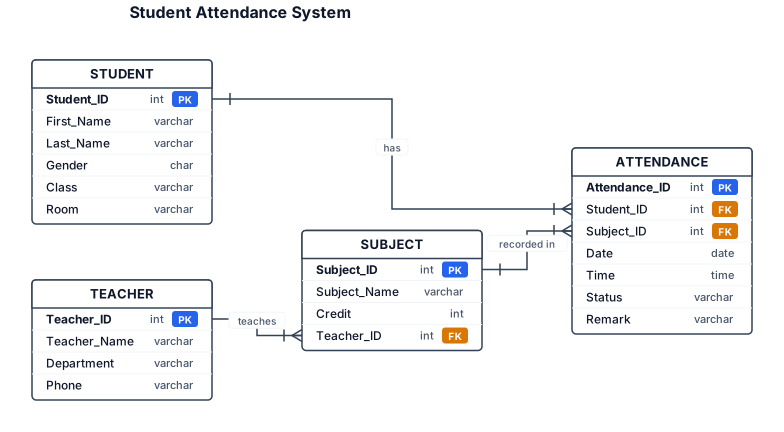
Create a database diagram for a Student Attendance System. Create exactly 4 tables: STUDENT Student_ID (PK) First_Name Last_Name Gender Class Room TEACHER Teacher_ID (PK) Teacher_Name Department Phone SUBJECT Subject_ID (PK) Subject_Name Credit Teacher_ID (FK) ATTENDANCE Attendance_ID (PK) Student_ID (FK) Subject_ID (FK) Date Time Status Remark ONLY these 3 relationships are allowed: 1. TEACHER 1:N SUBJECT Teacher_ID connects TEACHER to SUBJECT. 2. STUDENT 1:N ATTENDANCE Student_ID connects STUDENT to ATTENDANCE. 3. SUBJECT 1:N ATTENDANCE Subject_ID connects SUBJECT to ATTENDANCE. IMPORTANT: - Do NOT connect STUDENT to SUBJECT. - There must be NO direct line between STUDENT and SUBJECT. - ATTENDANCE is the ONLY table connecting STUDENT and SUBJECT. - Show PK and FK clearly. - Show 1:N cardinality. - Do not create any additional relationships.
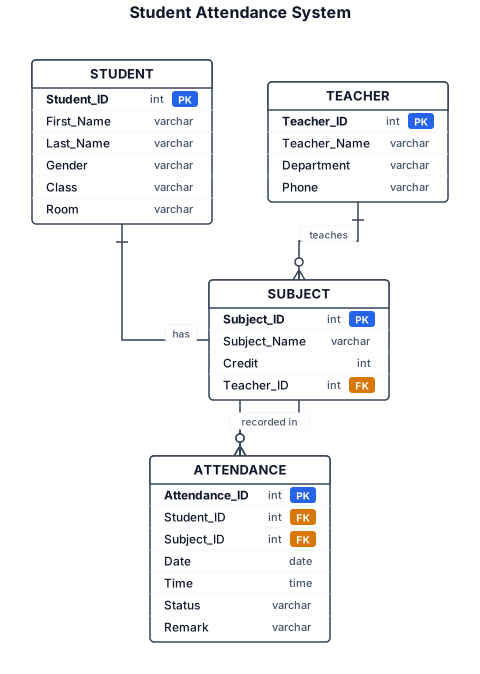
Create a database diagram for a Student Attendance System. Use 4 tables only: STUDENT - Student_ID (PK) - First_Name - Last_Name - Gender - Class - Room TEACHER - Teacher_ID (PK) - Teacher_Name - Department - Phone SUBJECT - Subject_ID (PK) - Subject_Name - Credit - Teacher_ID (FK) ATTENDANCE - Attendance_ID (PK) - Student_ID (FK) - Subject_ID (FK) - Date - Time - Status - Remark Connections: TEACHER 1:N SUBJECT One teacher teaches many subjects. STUDENT 1:N ATTENDANCE One student has many attendance records. SUBJECT 1:N ATTENDANCE One subject has many attendance records. Important: Do NOT connect STUDENT directly to SUBJECT. ATTENDANCE must be the bridge between STUDENT and SUBJECT. Connect: TEACHER.Teacher_ID → SUBJECT.Teacher_ID STUDENT.Student_ID → ATTENDANCE.Student_ID SUBJECT.Subject_ID → ATTENDANCE.Subject_ID Show PK, FK, and 1:N on the relationship lines. Use simple table boxes and a clean layout.
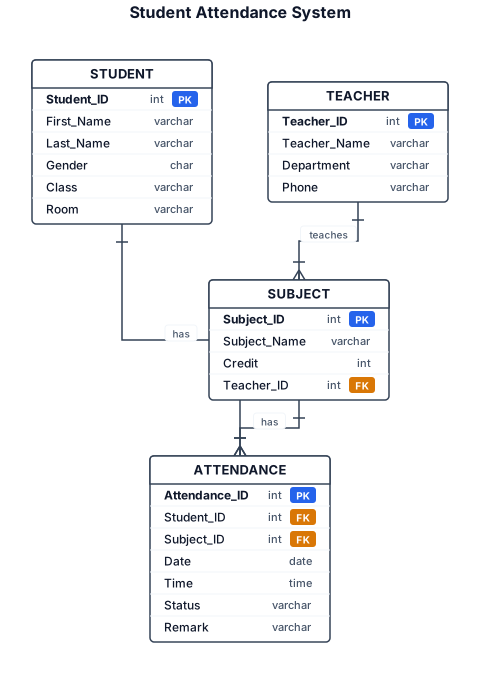
Create a database diagram for a Student Attendance System. There are 4 tables: STUDENT - Student_ID (PK) - First_Name - Last_Name - Gender - Class - Room TEACHER - Teacher_ID (PK) - Teacher_Name - Department - Phone SUBJECT - Subject_ID (PK) - Subject_Name - Credit - Teacher_ID (FK) ATTENDANCE - Attendance_ID (PK) - Student_ID (FK) - Subject_ID (FK) - Date - Time - Status - Remark Connections: - One TEACHER teaches many SUBJECTS. - One STUDENT has many ATTENDANCE records. - One SUBJECT has many ATTENDANCE records. Connect the foreign keys to the correct primary keys. Show PK, FK, and 1:N relationships. Keep the diagram simple and easy to read. Show each table as a box. Put the column names inside each box. Show primary keys and foreign keys clearly. Draw lines between related tables. Use one-to-many (1:N) relationships.
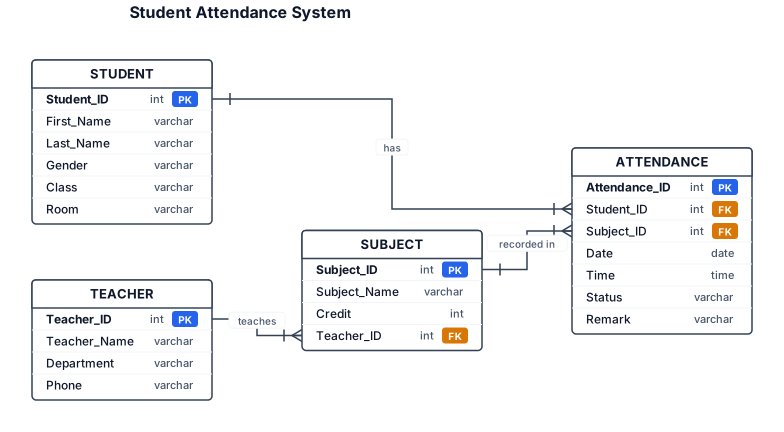
Create an ER Diagram for a **Student Attendance System**. Entities: **STUDENT** * Student_ID (PK) * First_Name * Last_Name * Gender * Class * Room **TEACHER** * Teacher_ID (PK) * Teacher_Name * Department * Phone **SUBJECT** * Subject_ID (PK) * Subject_Name * Credit * Teacher_ID (FK → TEACHER.Teacher_ID) **ATTENDANCE** * Attendance_ID (PK) * Student_ID (FK → STUDENT.Student_ID) * Subject_ID (FK → SUBJECT.Subject_ID) * Date * Time * Status * Remark Relationships: * TEACHER 1:N SUBJECT * STUDENT 1:N ATTENDANCE * SUBJECT 1:N ATTENDANCE Show PK, FK, attributes, relationship lines, and cardinality clearly. Use a clean and simple layout.
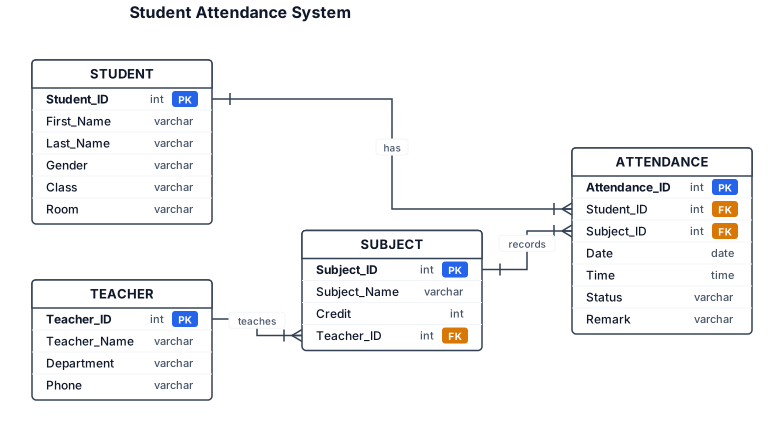
สร้าง ER Diagram สำหรับระบบเช็คชื่อนักเรียน STUDENT (นักเรียน) * Student_ID (PK) * First_Name * Last_Name * Gender * Class * Room TEACHER (ครู) * Teacher_ID (PK) * Teacher_Name * Department * Phone SUBJECT (วิชา) * Subject_ID (PK) * Subject_Name * Credit * Teacher_ID (FK) ATTENDANCE (การเช็คชื่อ) * Attendance_ID (PK) * Student_ID (FK) * Subject_ID (FK) * Date * Time * Status * Remark ความสัมพันธ์: * TEACHER 1:N SUBJECT * STUDENT 1:N ATTENDANCE * SUBJECT 1:N ATTENDANCE แสดง PK, FK, Attribute และ Cardinality ให้ชัดเจน จัดแผนผังให้เป็นระเบียบและอ่านง่าย
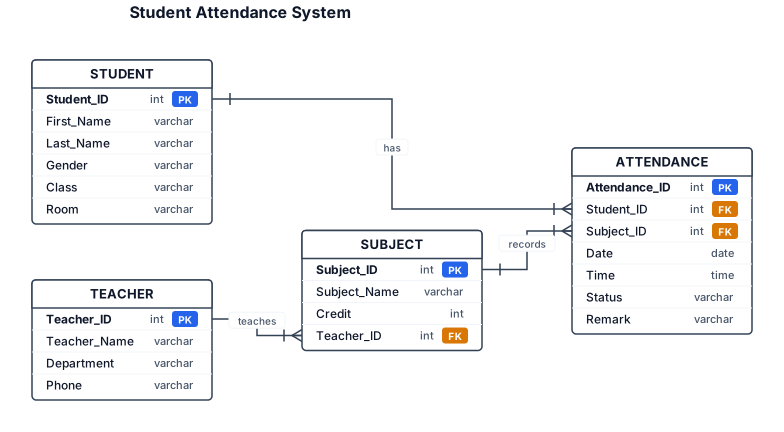
Create an ERD for a Student Attendance System. STUDENT(Student_ID PK, First_Name, Last_Name, Gender, Class, Room) TEACHER(Teacher_ID PK, Teacher_Name, Department, Phone) SUBJECT(Subject_ID PK, Subject_Name, Credit, Teacher_ID FK) ATTENDANCE(Attendance_ID PK, Student_ID FK, Subject_ID FK, Date, Time, Status, Remark) Relationships: TEACHER 1:N SUBJECT STUDENT 1:N ATTENDANCE SUBJECT 1:N ATTENDANCE Show all PKs, FKs, attributes, and cardinalities.
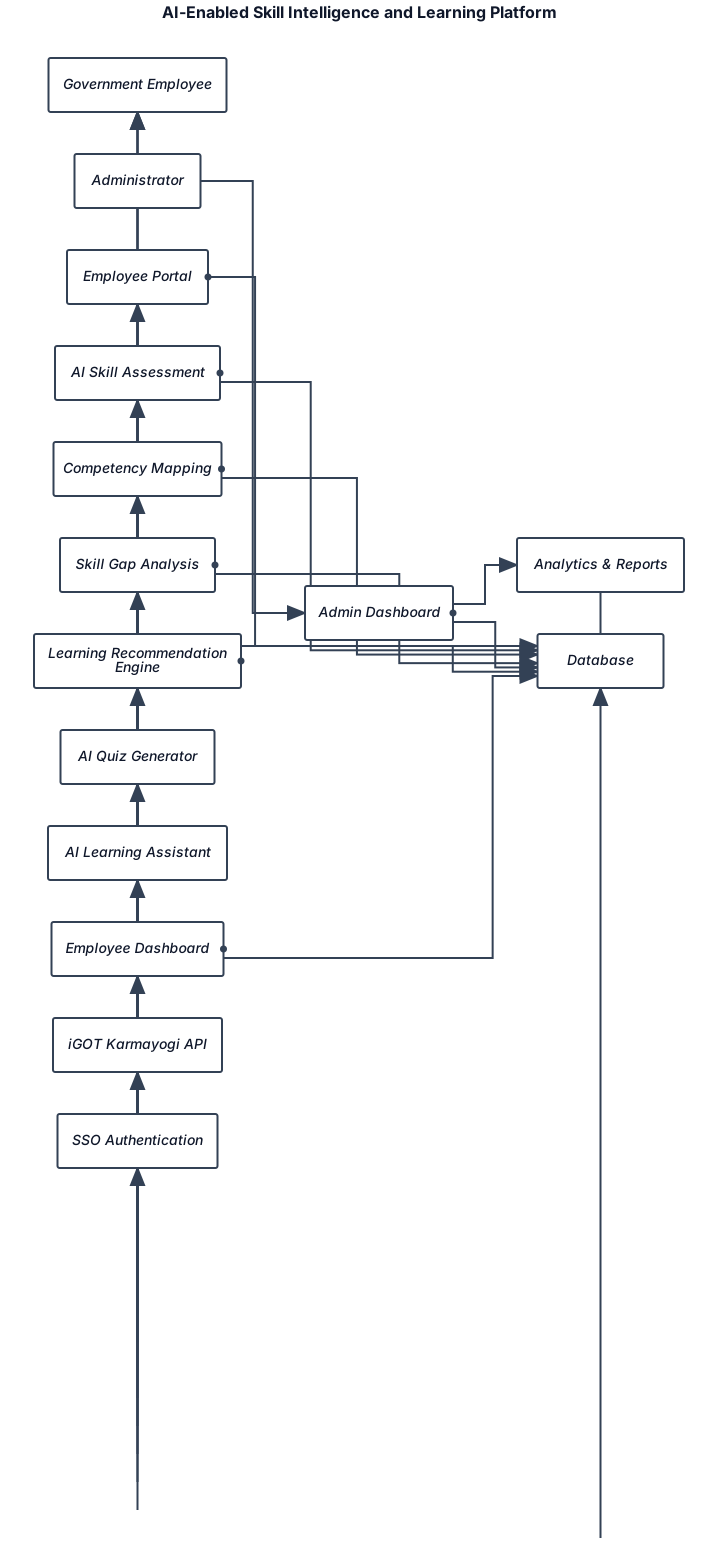
Create a system architecture diagram for an AI-enabled Skill Intelligence and Learning Platform. Actors: - Government Employee - Administrator Core Modules: - Employee Portal - AI Skill Assessment - Competency Mapping - Skill Gap Analysis - Learning Recommendation Engine - AI Quiz Generator - AI Learning Assistant - Employee Dashboard - Admin Dashboard External Integrations: - iGOT Karmayogi API - SSO Authentication Storage: - Database Flow: Employee -> Portal -> AI Assessment -> Skill Gap Analysis -> Learning Recommendation -> iGOT Courses -> Dashboard Admin -> Dashboard -> Analytics -> Reports
Focused examples and prompt ideas
Start with the complete visitor wall above, then use these focused collections when you want a narrower subject and more prompt context.
The first curated collection is being prepared.