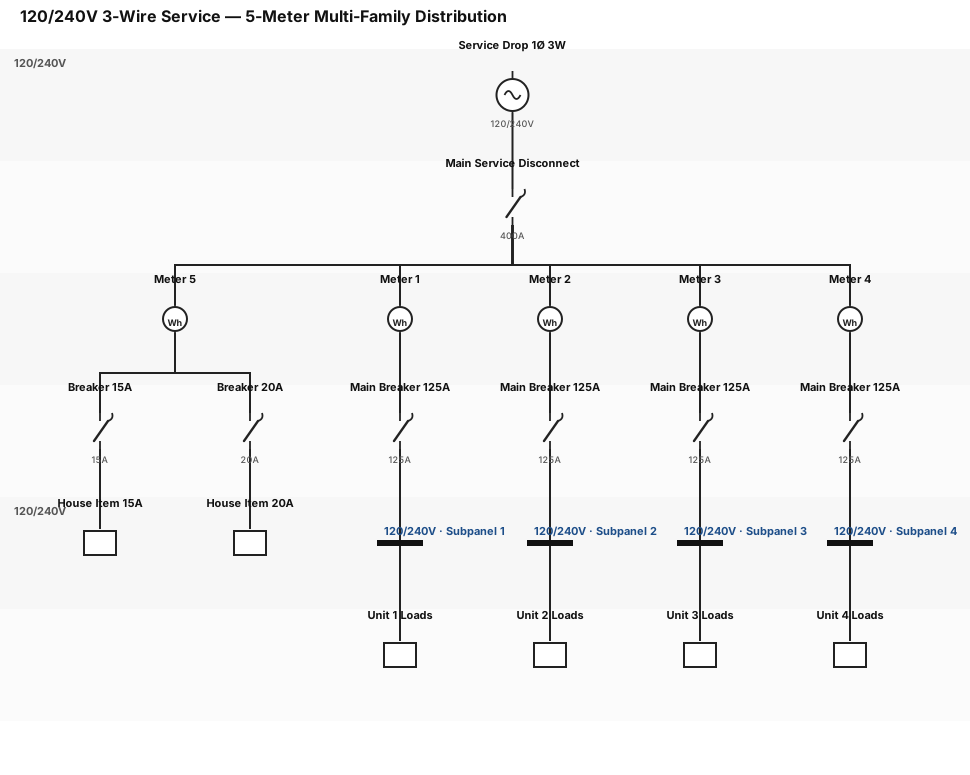
single line diagram single phase 3 wire 120/240v service feeding a 400A main that has a 3 meter stack with 3 meters and 125a main breakers leading to 3 subpanels and a 2 meter stack with 1 meter and a 125A main breaker leading to a subpanel and another meter with a 15A breaker and a 20A breaker house items
NODE ARCHIVE · REAL DIAGRAM BRIEFS
Diagram Examples from Real Visitor Prompts
Browse eligible diagrams shared by FreeDiagram visitors, inspect the exact prompts, and build your own version.
Browse 1008 real creationsCOMMUNITY OUTPUTS · EXACT PROMPTS
All visitor creations
Showing 49–72 of 1008. No stock examples or system defaults. Choose a tool, study a real result, then reopen its prompt as your starting point.
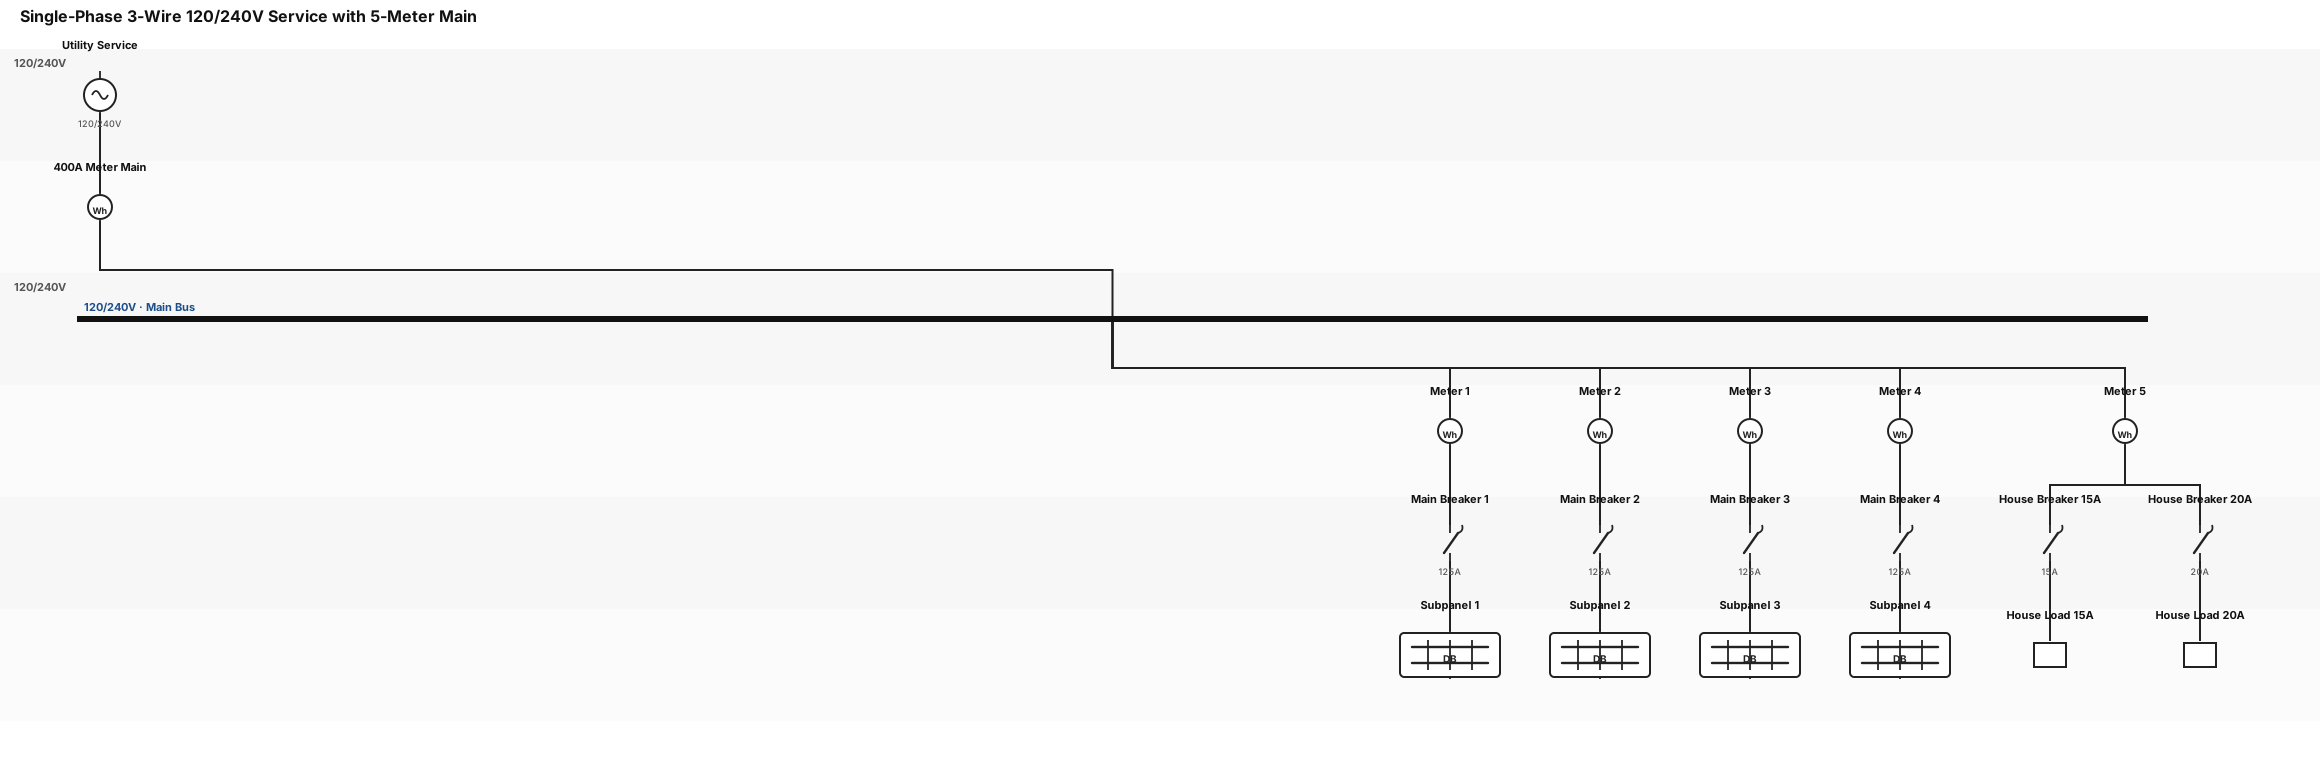
single line diagram single phase 3 wire 120/240v service feeding a 400A meter main that has 4 meters with 125a main breakers leading to 4 subpanels and 1 meter with a 15A breaker and a 20A breaker house items
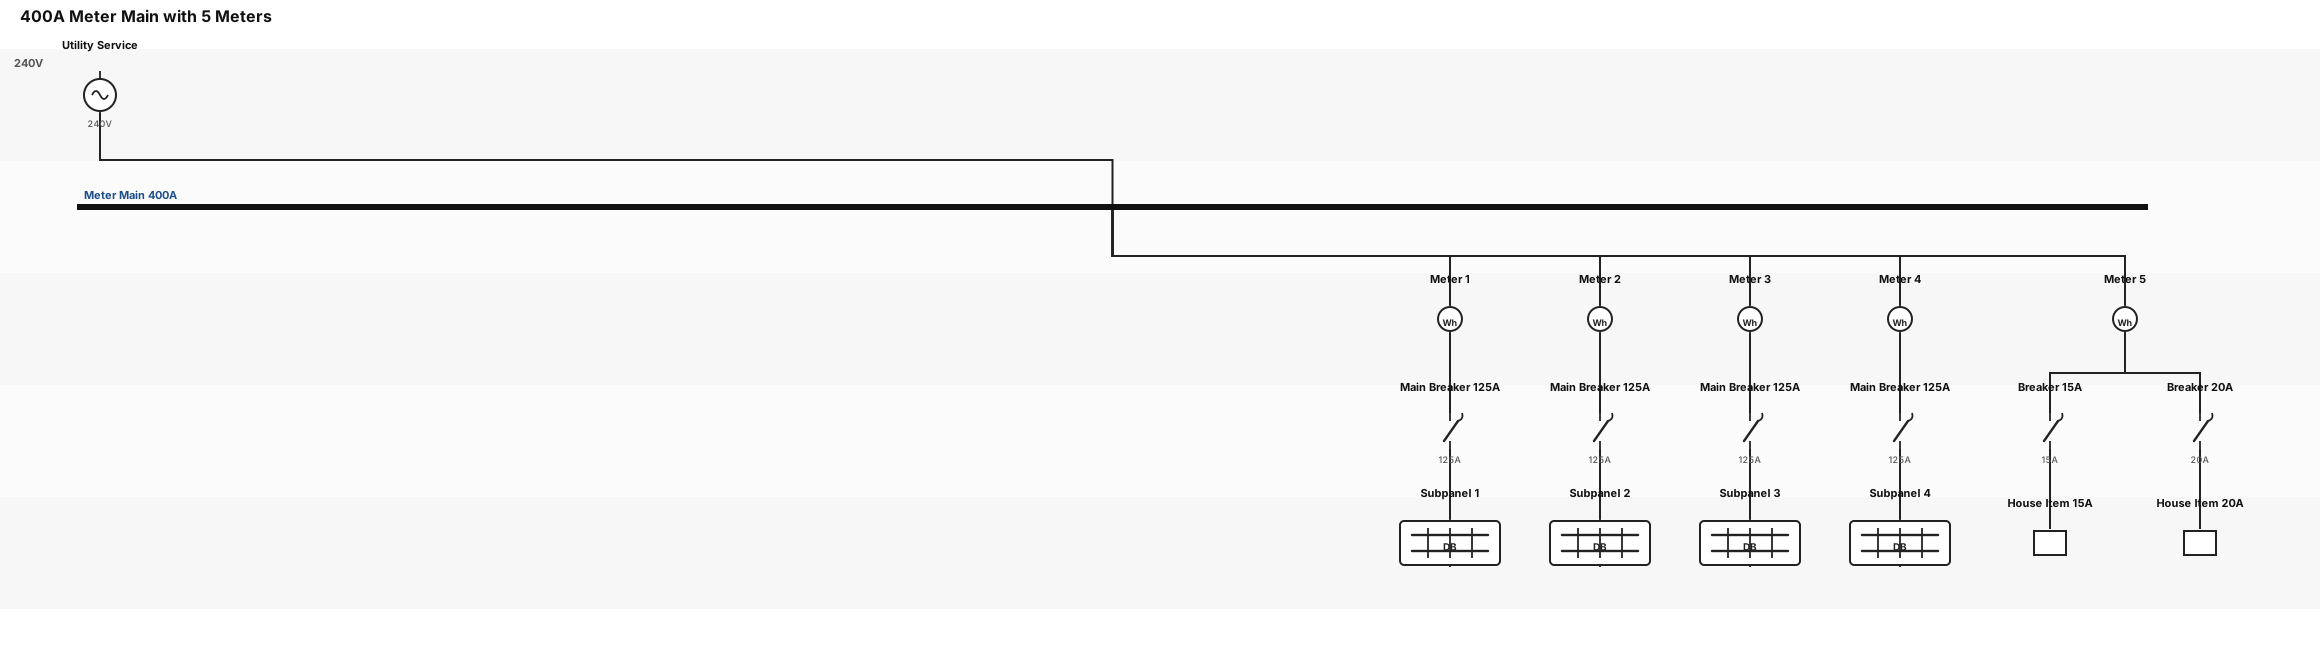
single line diagram a 400A meter main that has 4 meters with 125a main breakers leading to 4 subpanels and 1 meter with a 15A breaker and a 20A breaker house items
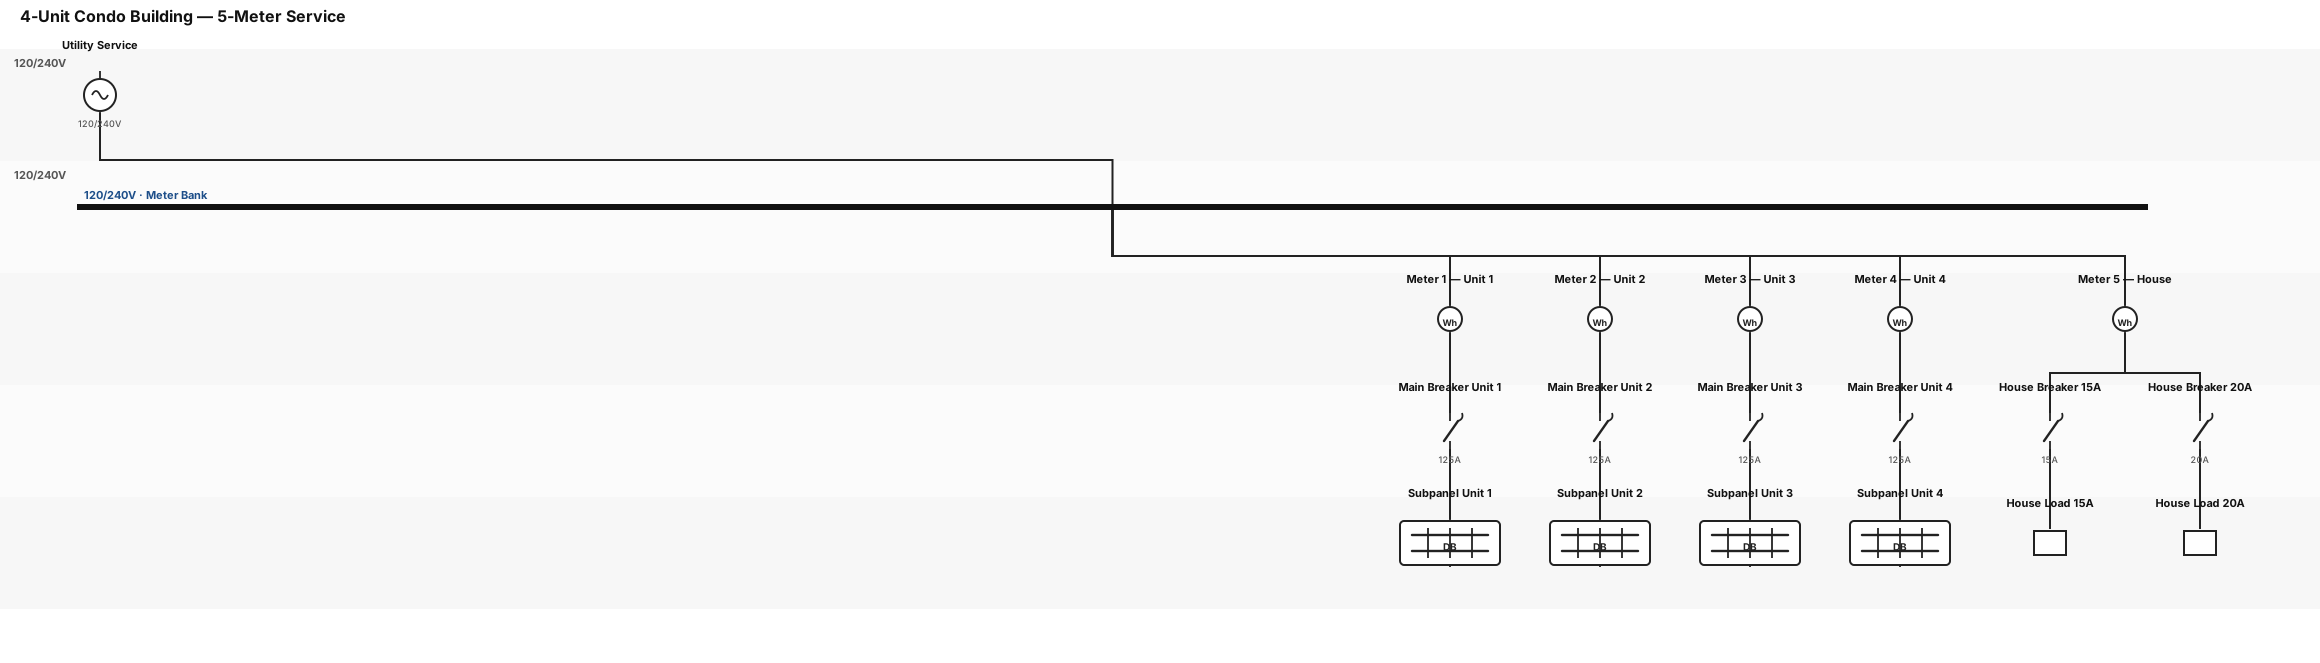
single line diagram for a 4 unit condo building with 4 meters with 125a main breakers leading to 4 subpanels and 1 meter with a 15A breaker and a 20A breaker house items
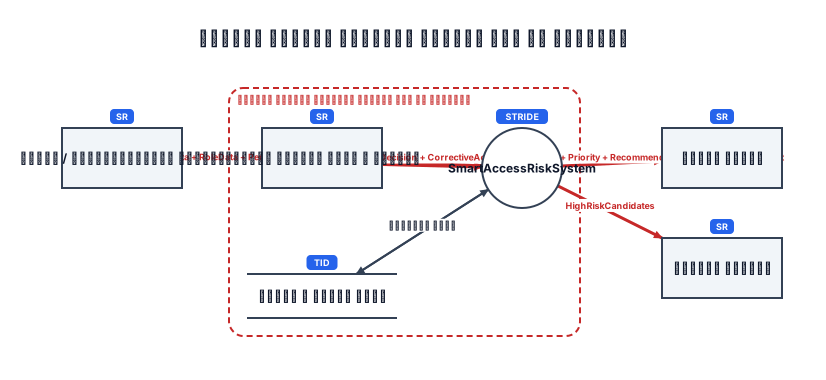
حالا شکل DFD0 پروژه 33 فصل 6 را بصورت PNGمتن زیر با توجه به متنی که قبلا دادی یعنی این : ۶-۶-2. نمودار جریان داده سطح صفر (DFD0) نمودار جریان داده سطح صفر، نمای کلی و سطح بالای سامانه را ارائه میکند و نشان میدهد که سامانه چگونه با موجودیتهای بیرونی ارتباط برقرار میکند. در پروژه ۳۳، فرآیند اصلی میتواند به صورت سامانه هوشمند ارزیابی دسترسی امن به اطلاعات تعریف شود. در این سطح، جزئیات داخلی الگوریتم یا مراحل مختلف قیف نمایش داده نمیشوند؛ بلکه هدف، مشخص کردن ورودیهای اصلی، خروجیهای اصلی و ارتباط سامانه با محیط بیرونی است. موجودیتهای بیرونی اصلی عبارتاند از: کاربر یا درخواستکننده دسترسی؛ مسئول امنیت؛ سامانه دیریت هویت و دسترسی؛ منابع و مخازن داده؛ ارزیاب انسانی. دادههای ورودی اصلی عبارتاند از: UserData + RoleData + PermissionData + ResourceData + AccessData + ContextData و خروجیهای اصلی عبارتاند از: RiskLevel+RiskExplanation+Priority+Recommendation+ManagementReportRiskLevel+ RiskExplanation+ Priority+ Recommendation+ ManagementReport در این سطح، سامانه باید نشان دهد که چگونه دادههای دسترسی را دریافت کرده و پس از تحلیل، نتیجهای قابل استفاده برای کنترل دسترسی تولید میکند. جریان اصلی ریسک AccessData → RiskAssessment → RiskLevel دادههای دسترسی ارزیابی میشوند و در نهایت سطح ریسک دسترسی تعیین میشود. جریان اصلی قیف AccessData → AccessFunnel → HighRiskCandidates ادههای دسترسی از قیف تحلیل عبور میکنند و دسترسیهای پرریسک برای بررسی و ارزیابی بیشتر شناسایی میشوند. جریان اصلی هوشمندی HighRiskCandidates → IntelligentAnalysis → RiskClassification → Decision موارد پرریسک با تحلیل هوشمند بررسی، سطح ریسک آنها طبقهبندی و سپس تصمیم امنیتی مناسب اتخاذ میشود. جریان ترکیبی DFD سطح صفر AccessData → SmartAccessRiskSystem → RiskDecision → CorrectiveAction در این سطح، هدف اصلی نمایش مرز سامانه و ارتباط آن با محیط است؛ جزئیات مربوط به چگونگی انجام هر فرآیند در سطوح یک و دو DFD توسعه داده خواهد شد. بده البته فارسی و ریسک و قیف و هوشمندی DFD0 را برای این پروژه هم داشته باشد
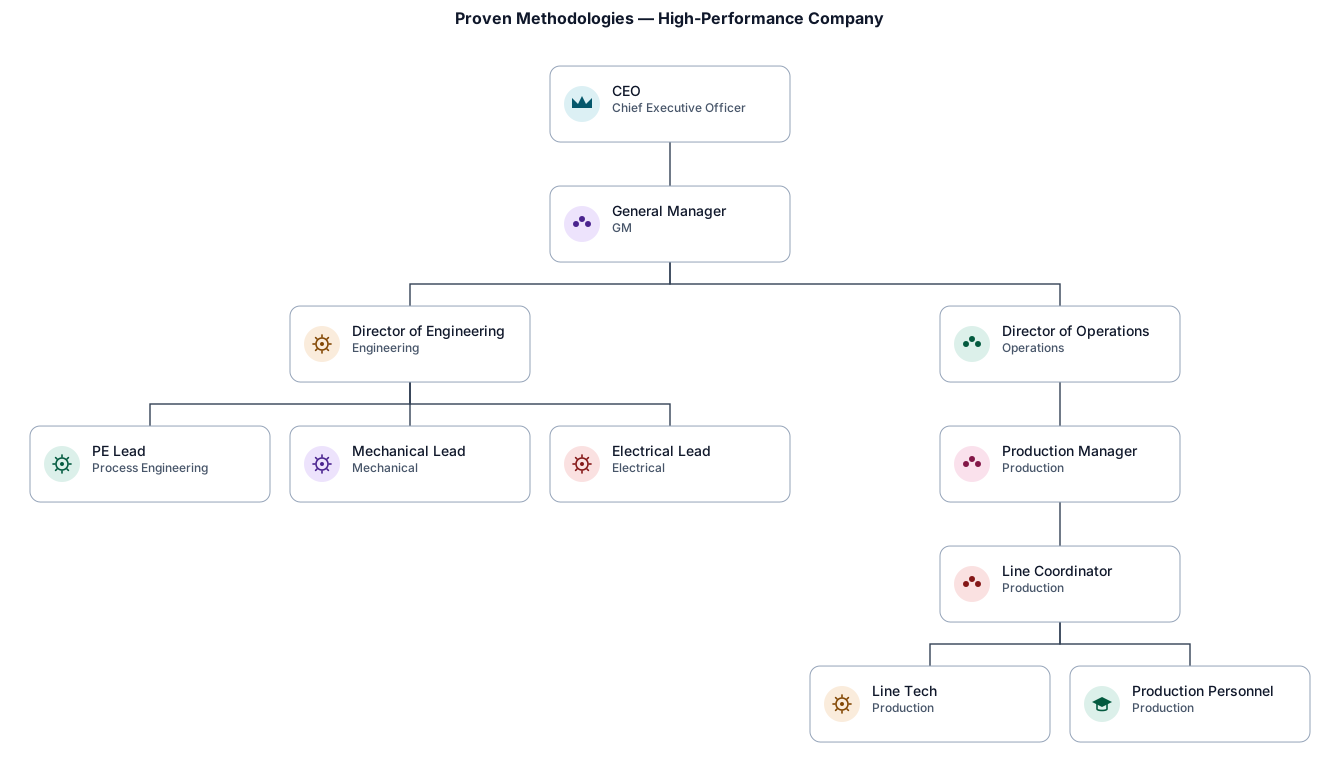
genrate a organization chart for proven methologie s on highly succeful companyes with value strem for organitions covering not neccearyly in that order. CEO General manager Director of engineering Director of operation Engineering team(PE, mechanical, electrical.etc) Production managers Line techs Line Coordinator Produciton personnel.
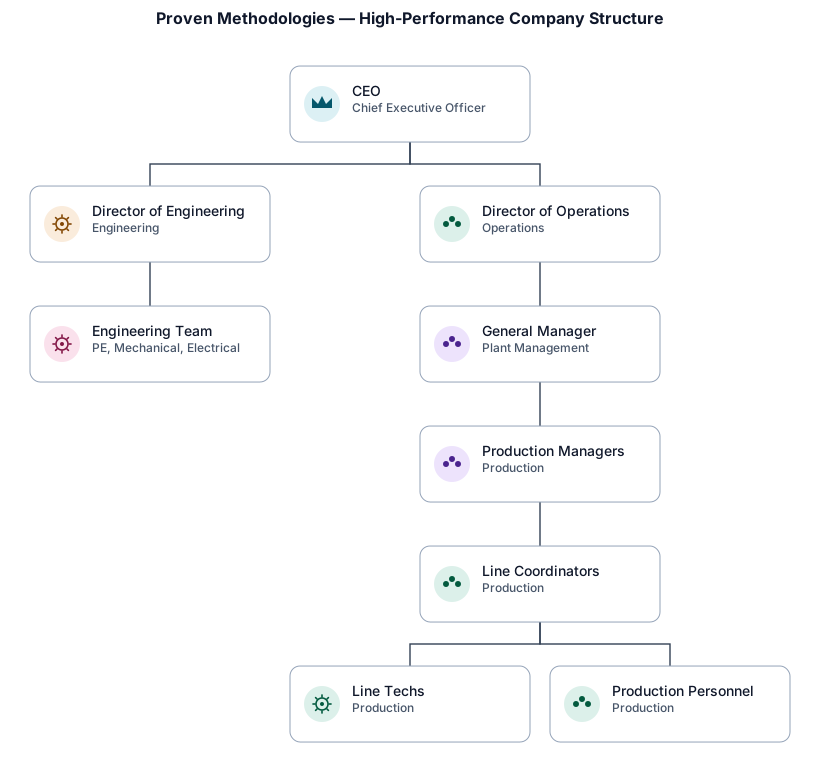
genrate a organization chart for proven methologie s on highly succeful companyes with value strem for organitions covering not neccearyly in that order. CEO Director of engineering Director of operation General manager Engineering team(PE, mechanical, electrical.etc) Production managers Line techs Line Coordinator Produciton personnel.
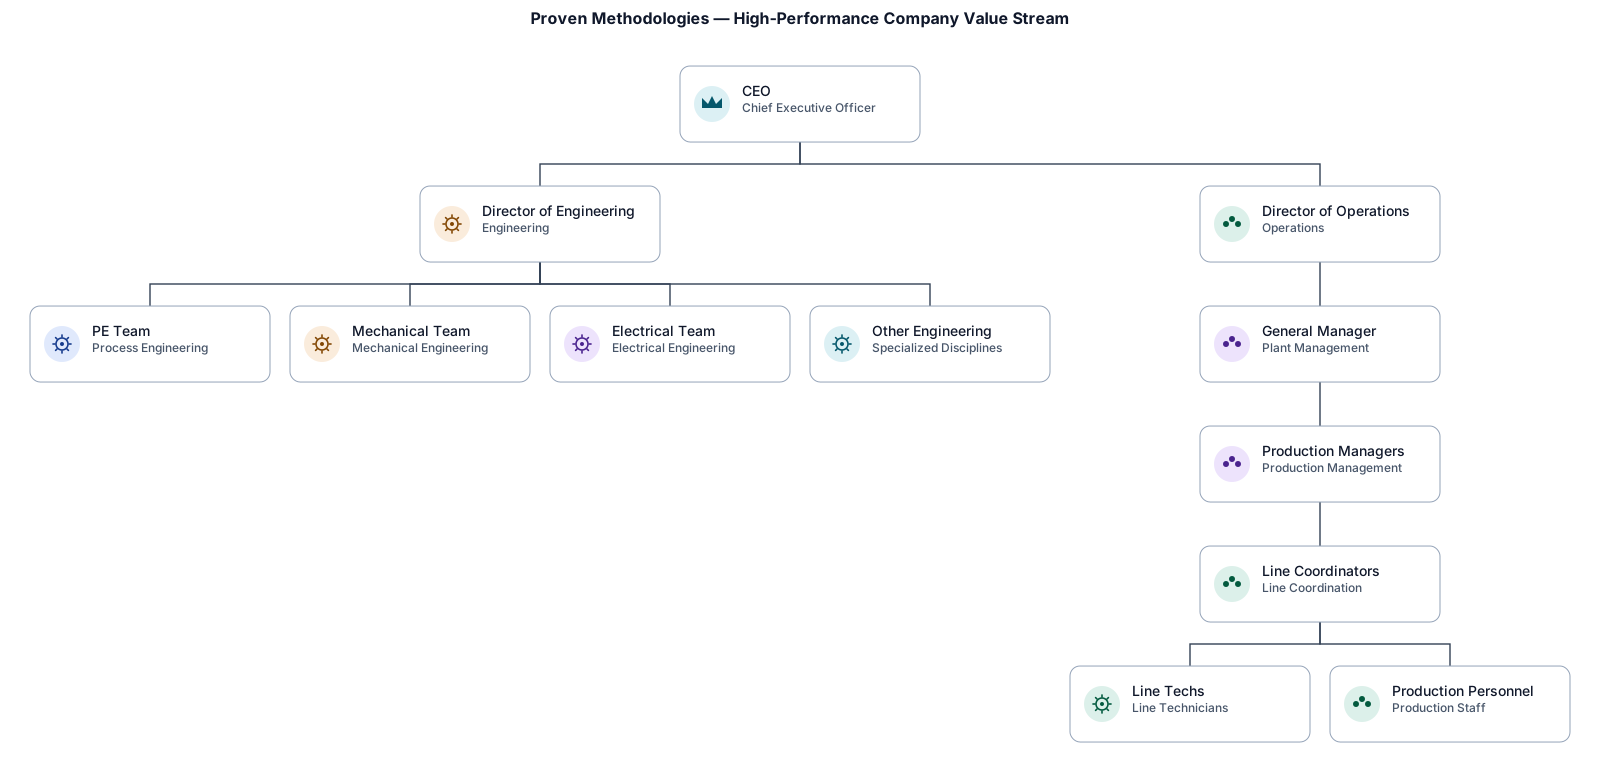
genrate a organization chart for proven methologie s on highly succeful companyes with value strem for organitions covering CEO Director of engineering Director of operation General manager Engineering team(PE, mechanical, electrical.etc) Production managers Line techs Line Coordinator Produciton personnel.
reate a professional 16:9 executive manufacturing diagram. Show Production and Engineering as two equal teams working together, with their existing reporting structures remaining unchanged. Put "Shared Manufacturing Priorities" between them with a bidirectional connection. Above Production show Director of Operations; above Engineering show Engineering Director. Around the shared priorities show four priorities: Safety, Quality, Customer/Production Commitments, and Continuous Improvement. Below show the process: Identify Issue → Assess Business & Technical Impact → Agree Priority → Assign Owner → Set Target Date → Execute → Escalate if Blocked → Close. At the bottom show the outcomes: Visibility, Accountability, Faster Resolution, Better Manufacturing Performance. Use navy blue, manufacturing blue, engineering green, white background, clean corporate style, minimal text, executive leadership presentation quality.
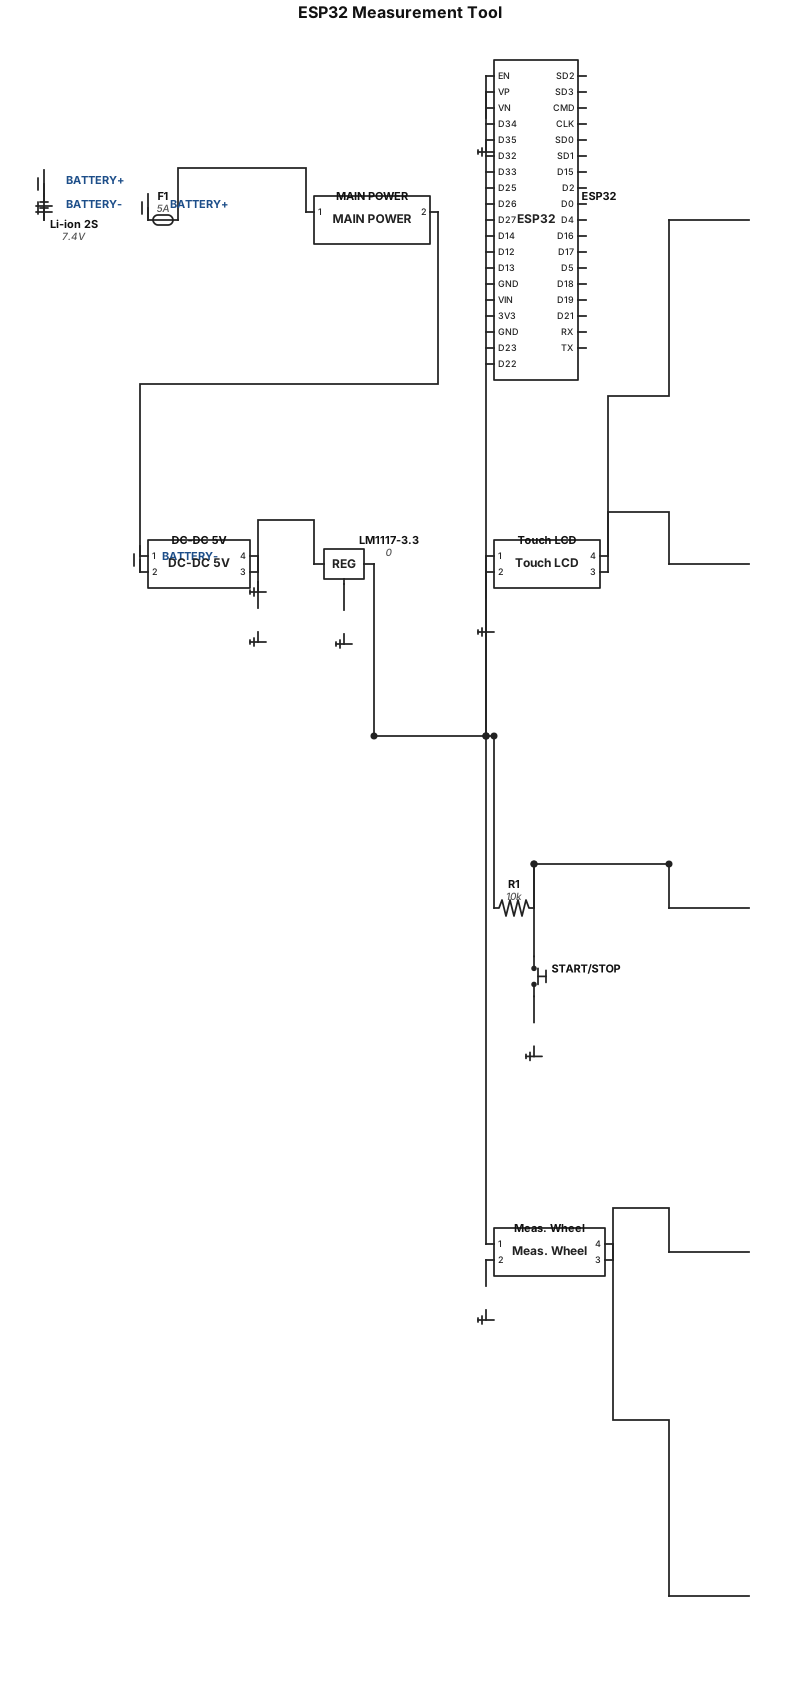
Create a clean, minimal, and professional electronic block diagram and netlist for a microcontroller-based measurement tool. System Components: 1. Power Subsystem: Rechargeable battery connected to a 5A fuse, a main DPST power switch, a DC-DC buck converter (stepping down to 5V), and a 3.3V voltage regulator (LM1117-3.3). 2. Processing Core: ESP32 microcontroller powered by 3.3V/5V with properly routed ground (GND) planes. 3. User Interface: Touchscreen LCD connected via I2C (SDA, SCL) and a Start/Stop push button with a pull-up resistor. 4. Measurement Subsystem: Rotary encoder connected to a mechanical measuring wheel, outputting dual quadrature signals (A and B channels) directly to designated ESP32 digital GPIO pins. Output Format: Provide a structured, text-based pin mapping table and schematic connection guide detailing every net name (BATTERY+, BATTERY-, VCC, GND, 3.3V, 5V, SDA, SCL, A, B, BUTTON, and GPIO pins) suitable for importing into an electronic design layout or documentation file.
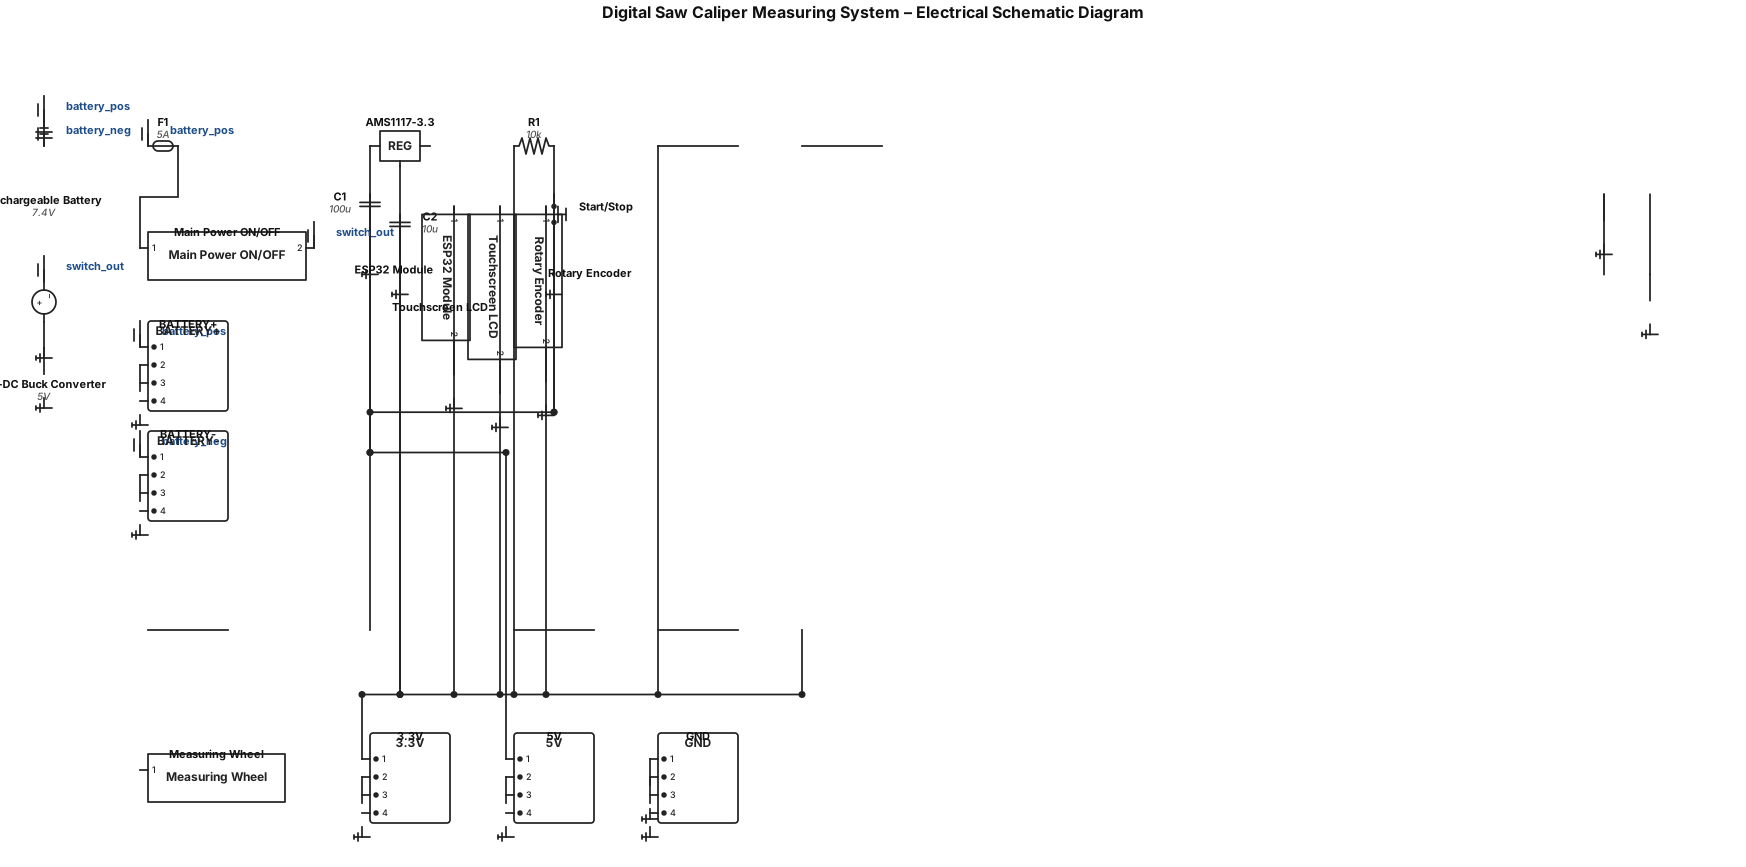
A professional, high-resolution technical electrical schematic diagram for a Digital Saw Caliper Measuring System, designed for engineering prototype documentation. Rendered in a clean black-and-white engineering blueprint style with standard electronic component symbols, solid black wiring lines, and a white background. Layout & Structure: - Title at the top: DIGITAL SAW CALIPER MEASURING SYSTEM – ELECTRICAL SCHEMATIC DIAGRAM - Left side: Rechargeable battery connected through a 5A fuse and a DPST main power ON/OFF switch, feeding into a DC-DC buck converter (stepping down to 5V) and an AMS1117-3.3 voltage regulator (stepping down to 3.3V). - Center: An ESP32 microcontroller module with properly routed VCC (3.3V/5V), GND planes, and GPIO pins. - Connected Peripherals: - A touchscreen LCD connected via I2C (SDA, SCL) and power lines. - A start/stop push button with a pull-up resistor connected to a GPIO pin. - A rotary encoder connected to a measuring wheel, with clear A and B quadrature signal lines routed to designated ESP32 GPIO pins. - Right side: A detailed "Symbols and Components Legend" box containing standard icons for Battery, Power Switch, Button, Touchscreen LCD, Rotary Encoder, Measuring Wheel, Voltage Regulator, Fuse, Connector, VCC, and GND. Style Notes: Crisp vector lines, sharp text labels for all pins and nets (BATTERY+, BATTERY-, VCC, GND, 3.3V, 5V, SDA, SCL, GPIO, A, B, BUTTON), clean orthogonal wire routing with junction dots, and no cartoon elements.

Create a clean professional academic flowchart for a final-year Computer Science project titled "Proposed Methodology / System Architecture" for a "Waste Management Analytics System". Create a single horizontal left-to-right workflow with 7 connected rounded rectangular boxes and clear arrows between them. Box 1: Dataset 300 Records Box 2: Data Preprocessing Clean & Validate Box 3: Data Analysis Waste Quantities Box 4: Performance Indicators Collection, Treatment & Recycling Rates Box 5: Priority Classification High, Medium & Normal Box 6: Streamlit Dashboard Interactive Visualization Box 7: Insights & Visualization Trends, Comparisons & Rule-Based Insights Use a professional university presentation style with a white background, dark blue and teal boxes, clear black or dark text, consistent typography, equal spacing, straight arrows, and a clean academic appearance. Make all text large and highly readable. Keep the diagram simple and uncluttered. Use 16:9 landscape proportions. Do not add any extra boxes, text, icons, statistics, logos, or decorative elements.
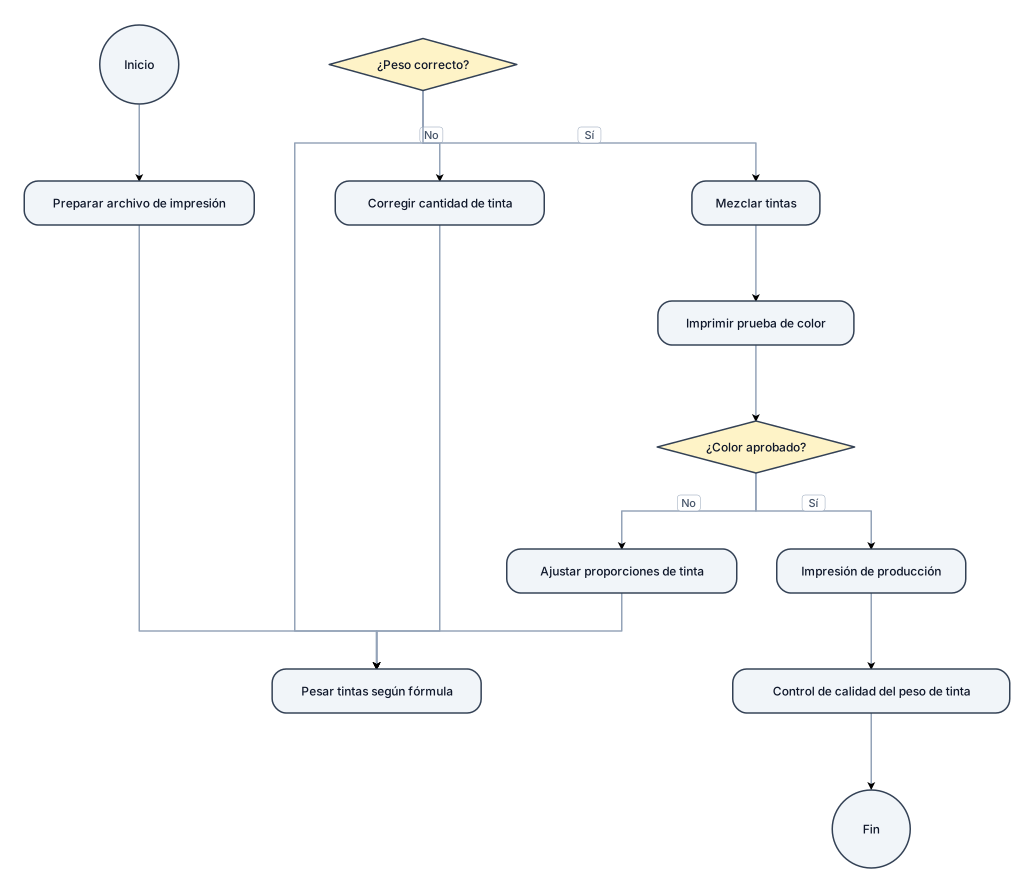
diagrama de flujo para proceso de impresion con peso de tintas
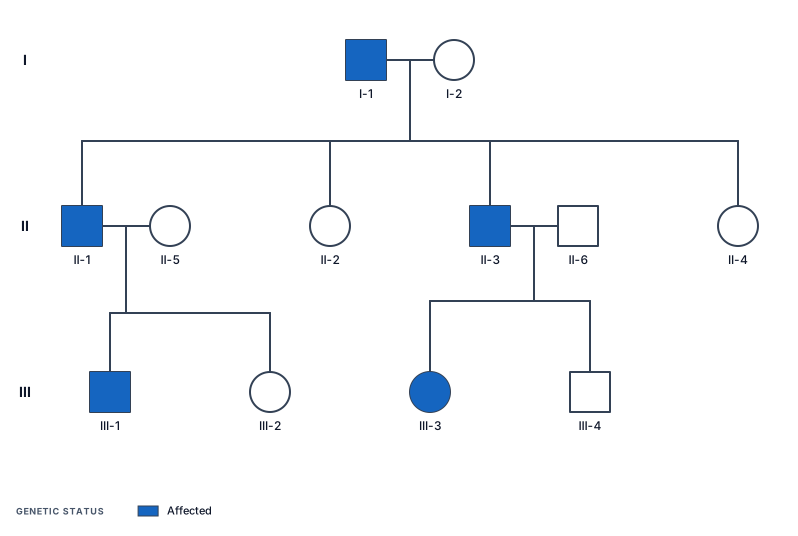
A pedigree chart showing autosomal dominant inheritance across three generations with carrier status

create a entity structure diagram of a full stacked Adaptive Orchestration via Multi-Agent Systems (MAS) a framework that operates on a Bi-Directional Recursive Feedback Loop Layout
a entity mindmap of a full stacked Adaptive Orchestration via Multi-Agent Systems (MAS) a framework that operates on a Bi-Directional Recursive Feedback Loop Layout

a entity mindmap of a Adaptive Orchestration via Multi-Agent Systems (MAS) a framework that operates on a Bi-Directional Recursive Feedback Loop Layout with a comparison beside it of a Bio-Psycho-Social Cybernetic Frameworke that makes up humanity
Adaptive Orchestration via Multi-Agent Systems (MAS) a framework that operates on a Bi-Directional Recursive Feedback Loop Layout with a comparison beside it of a Bio-Psycho-Social Cybernetic Frameworke that makes up humanity
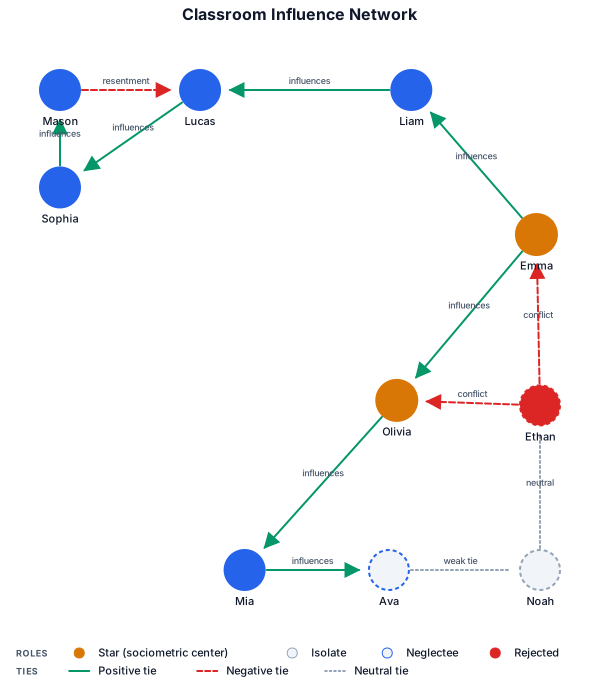
A sociogram of a classroom showing who influences whom, with positive and negative ties
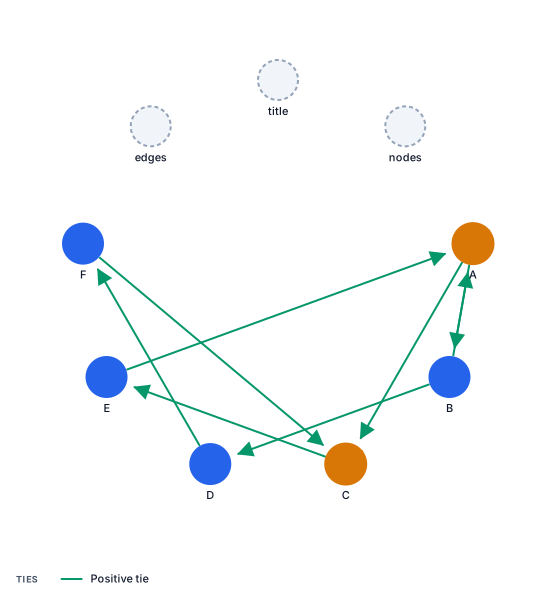
créer un sociogramme
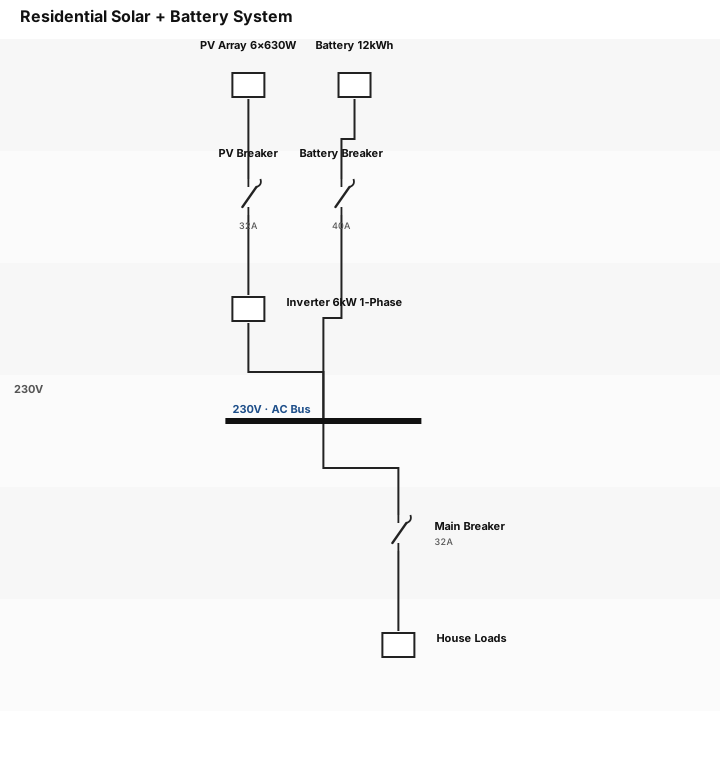
Please draw a single line diagram for a: 1. 6 kW inverter ,single phase 2. 12kwh battery 3. 6 modules 630 W each
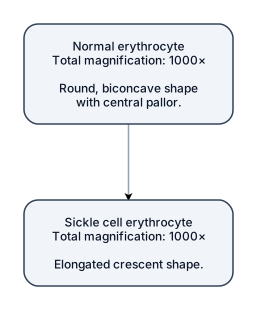
Create a fully hand-drawn biology worksheet image on plain white paper in a student notebook style. The page should show a side-by-side comparison of Normal erythrocyte and Sickle cell erythrocyte. Use pencil sketch shading with visible graphite texture and slightly imperfect hand-drawn lines so it clearly looks manually drawn by hand. On the left, draw a normal erythrocyte as a round biconcave disc with central pallor. Add the handwritten title “Normal erythrocyte” and below it write “Total magnification: 1000×”. Under the drawing, add a short handwritten note: “Round, biconcave shape with central pallor.” On the right, draw a sickle cell erythrocyte as an elongated crescent-shaped red blood cell. Add the handwritten title “Sickle cell erythrocyte” and below it write “Total magnification: 1000×”. Under the drawing, add the handwritten note: “Elongated crescent shape.” Make the whole image look like a real hand-drawn educational biology page, neat and attractive, with black handwritten labels, underlined headings, and soft pencil shading. It must look fully hand-drawn, not digitally illustrated, not 3D, not vector art, and not like a polished infographic.
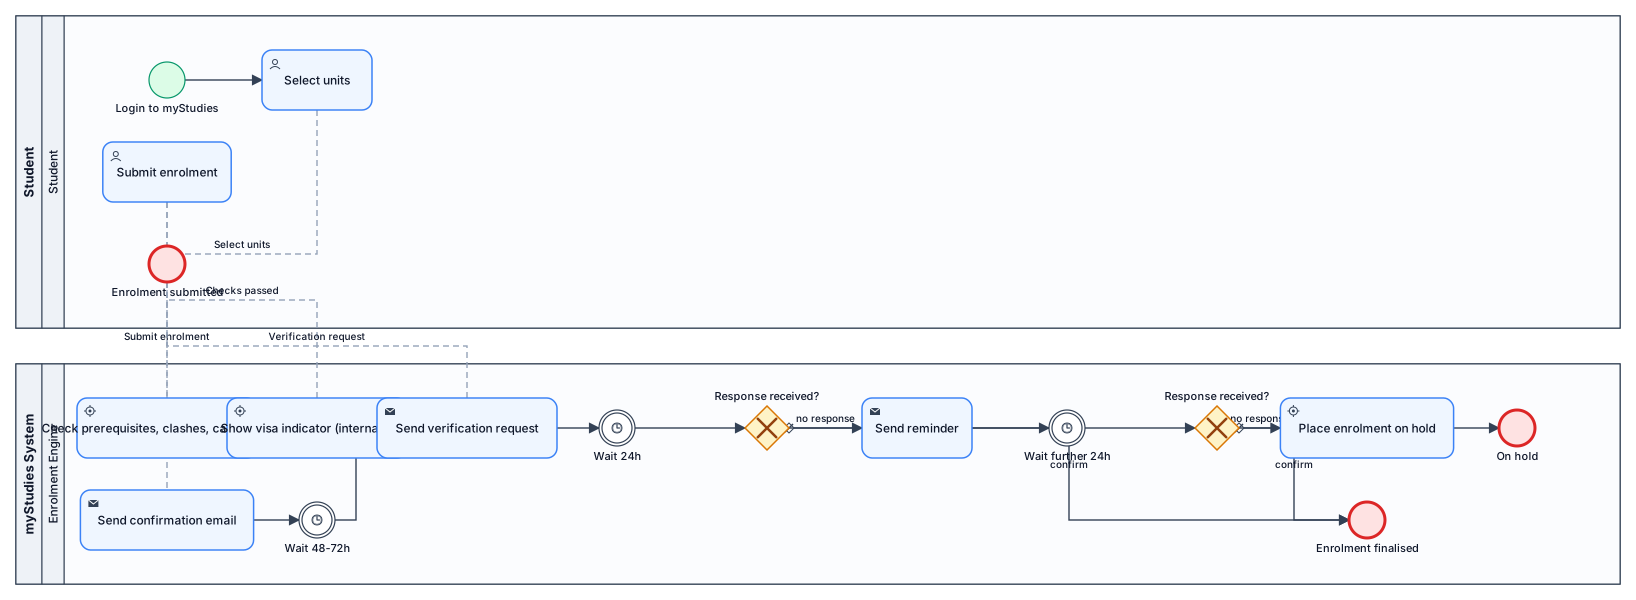
Online Self-Enrolment via the myStudies Portal The myStudies portal is the primary enrolment channel. The student logs in with their university credentials, navigates to the enrolment section, and selects their units for the semester. The system automatically checks for prerequisite compliance, timetable clashes, unit capacity, and load limits. If all checks pass, the student submits the enrolment and receives an automated confirmation email. International students are additionally shown a visa compliance indicator before submitting. Between 48 and 72 hours after submitting, the student receives a confirmation message asking them to verify their enrolment. The student must respond ‘Confirm’ to finalise. If no confirmation is received within 24 hours of the message being sent, the system sends a reminder. If no response is received within a further 24 hours, the enrolment is placed on hold and the student must contact Student Central to resolve it.
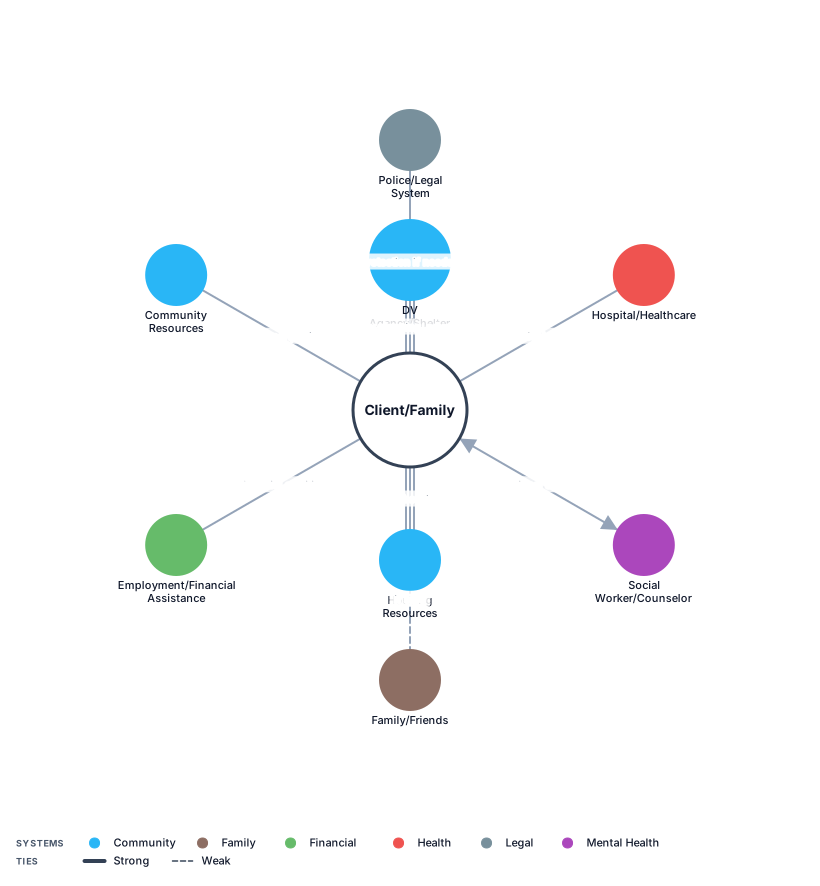
An ecomap for a client/family in the center. Around her, you could connect systems such as: Domestic-violence agency/shelter → safety planning, advocacy, emergency shelter Police/legal system → protection if needed Hospital/healthcare provider → medical care Social worker/counseling → emotional support and assessment Family/friends → informal support, if available and safe Employment/financial assistance → financial stability Housing resources → safe housing Community resources → food, transportation, childcare, etc.
Focused examples and prompt ideas
Start with the complete visitor wall above, then use these focused collections when you want a narrower subject and more prompt context.
The first curated collection is being prepared.