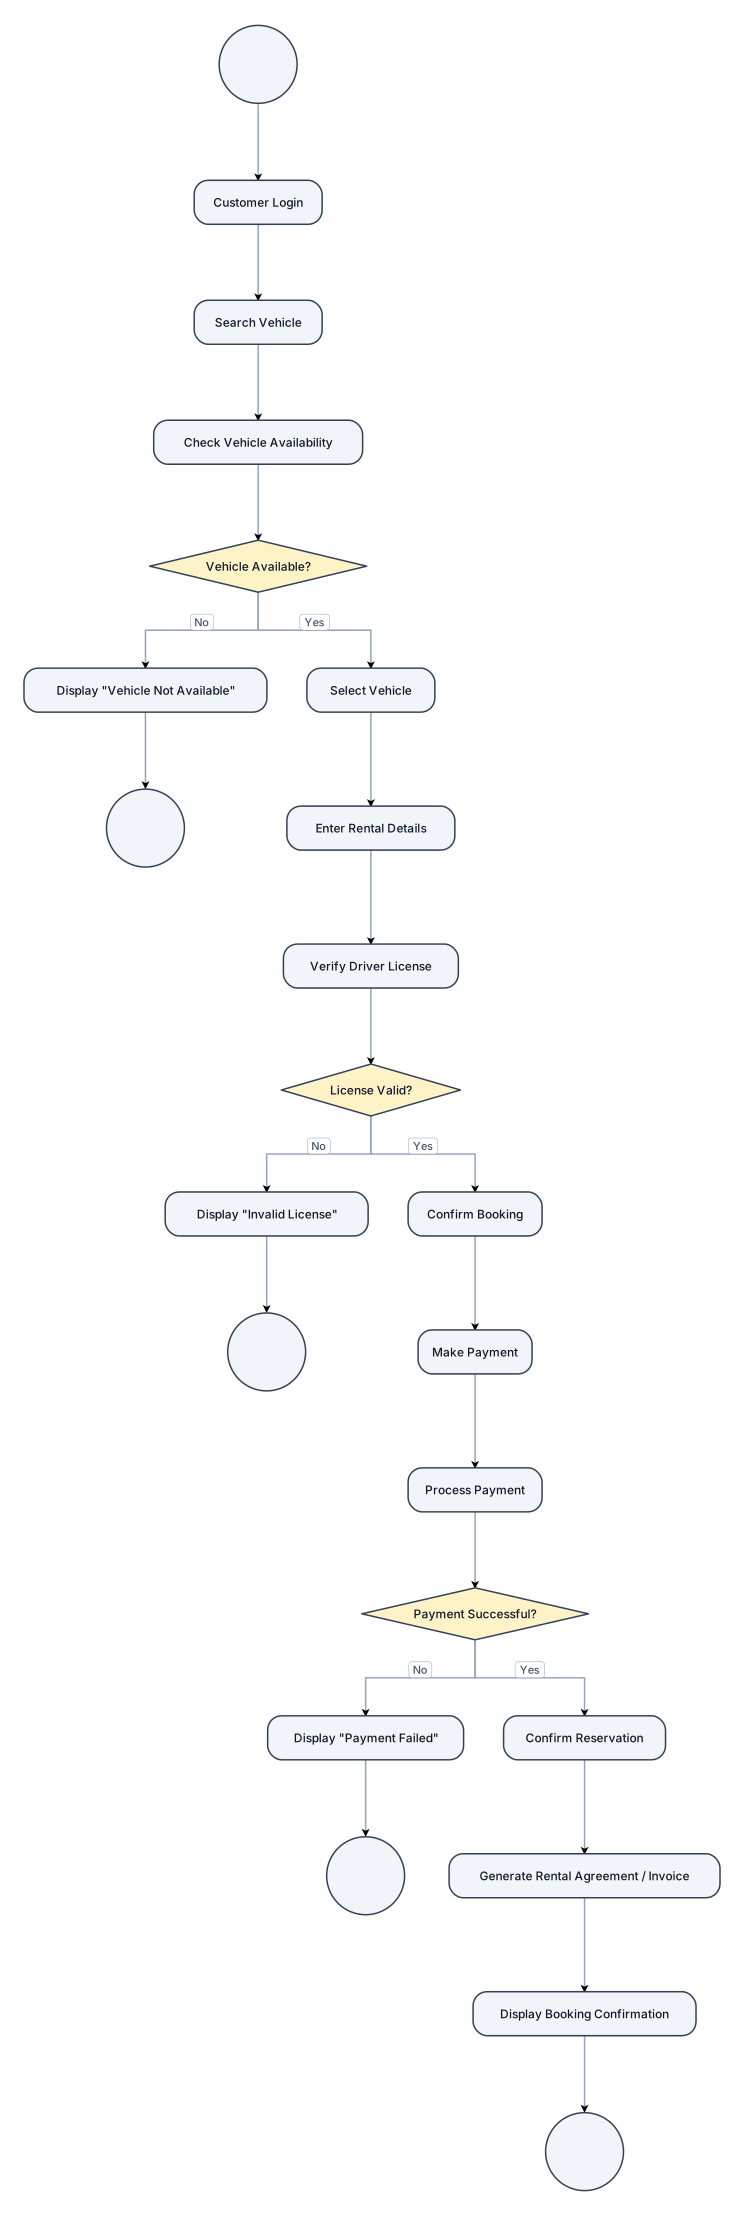
Create a simple UML Activity Diagram for a Vehicle Rental System. Title: Vehicle Booking Process Show ONLY this workflow: START ↓ Customer Login ↓ Search Vehicle ↓ Check Vehicle Availability ↓ [Vehicle Available?] NO → Display "Vehicle Not Available" → END YES → Select Vehicle ↓ Enter Rental Details ↓ Verify Driver License ↓ [License Valid?] NO → Display "Invalid License" → END YES → Confirm Booking ↓ Make Payment ↓ Process Payment ↓ [Payment Successful?] NO → Display "Payment Failed" → END YES → Confirm Reservation ↓ Generate Rental Agreement / Invoice ↓ Display Booking Confirmation ↓ END Use standard UML Activity Diagram notation: - Initial node - Rounded rectangle activity nodes - Diamond decision nodes - Directional arrows - [Yes] and [No] decision guards - Final node IMPORTANT: Keep the diagram simple and compact. Do not add any activities other than those listed. Do not add registration, cancellation, vehicle return, vehicle inspection, refunds, late fees, maintenance, reports, fleet management, notifications, or database activities. Do not create a Use Case Diagram. Do not use actor stick figures or use-case ellipses. Do not expand any activity into additional steps.
Diagram Examples from Real Visitor Prompts
Browse eligible diagrams shared by FreeDiagram visitors, inspect the exact prompts, and build your own version.
Browse 1024 real creationsAll visitor creations
Showing 745–768 of 1024. No stock examples or system defaults. Choose a tool, study a real result, then reopen its prompt as your starting point.

Org chart for Render Reporting project Delivery Lead (IST) - Aruna V R Strategist (USA) - Chris Rasmussen Data and Dashboard Engineer - Jayakrishnan Harikumar Data Engineer - Ann Therese Jose DevOps, SRE - Soorya Narayanan S QA - Stuthy G S Architecture, Architectural Decisions - Stalin Pereira Developer - **Sanjana P P , Harshvardhan K **, Saikrishnan A R, Deepu Das UX Design- Anoop Nandanan Executive Sponsor (ESii) coordinates client relationship and financials - Antony Satyadas People Operation Representive - Jancy Maria Lagy

Org chart for Render Reporting project Delivery Lead (IST) - Aruna V R Strategist (USA) - Chris Rasmussen Data and Dashboard Engineer - Jayakrishnan Harikumar Data Engineer - Ann Therese Jose DevOps, SRE - Soorya Narayanan S QA - Stuthy G S Architecture, Architectural Decisions - Stalin Pereira Developer - **Sanjana P P , Harshvardhan K ** UX Design- Anoop Nandanan Executive Sponsor (ESii) coordinates client relationship and financials - Antony Satyadas People Operation Representive - Jancy Maria Lagy

create org structure for render Reporting Report Delivery Lead (IST) - Aruna V R Strategist (USA) - Chris Rasmussen Data and Dashboard Engineer - Jayakrishnan Harikumar Data Engineer - Ann Therese Jose DevOps, SRE - Soorya Narayanan S QA - Stuthy G S Architecture, Architectural Decisions - Stalin Pereira Developer - **Sanjana P P , Harshvardhan K ** UX Design- Anoop Nandanan Executive Sponsor (ESii) coordinates client relationship and financials - Antony Satyadas People Operation Representive - Jancy Maria Lagy Project 2 - AI Automation Delivery Lead (IST) - Aruna V R GIS / Telecom SME (MST - Chris Rasmussen Lead Full-Stack Engineer — Governance/Platform - **Jude Sebastian Xavier ** AI Orchestration Lead - **Jasma K ** AI/ML Engineer - Classification Engine- Snehanjan Roy AI/ML Engineer — Classification Engine - Ashwin P QA Lead - Sthuthy G S Solution Architect- Stalin Pereira UX / Product Designer - Anoop Nandanan Executive Sponsor (ESii) coordinates client relationship and financials - Antony Satyadas SME , Business analyst - Alahari Sai Sreya Business Analyst - Anjana Sunil Software Engineer — Ingest - Saikrishnan A R Software Engineer — Ingest - **Deepu Das ** DevOps / Platform Engineer - Vishnu Nandanan M K People Operation Representive - Jancy Maria Lagy

create org structure for render II two project Reporting Ai Automation Report Delivery Lead (IST) - Aruna V R Strategist (USA) - Chris Rasmussen Data and Dashboard Engineer - Jayakrishnan Harikumar Data Engineer - Ann Therese Jose DevOps, SRE - Soorya Narayanan S QA - Stuthy G S Architecture, Architectural Decisions - Stalin Pereira Developer - **Sanjana P P , Harshvardhan K ** UX Design- Anoop Nandanan Executive Sponsor (ESii) coordinates client relationship and financials - Antony Satyadas People Operation Representive - Jancy Maria Lagy Project 2 - AI Automation Delivery Lead (IST) - Aruna V R GIS / Telecom SME (MST - Chris Rasmussen Lead Full-Stack Engineer — Governance/Platform - **Jude Sebastian Xavier ** AI Orchestration Lead - **Jasma K ** AI/ML Engineer - Classification Engine- Snehanjan Roy AI/ML Engineer — Classification Engine - Ashwin P QA Lead - Sthuthy G S Solution Architect- Stalin Pereira UX / Product Designer - Anoop Nandanan Executive Sponsor (ESii) coordinates client relationship and financials - Antony Satyadas SME , Business analyst - Alahari Sai Sreya Business Analyst - Anjana Sunil Software Engineer — Ingest - Saikrishnan A R Software Engineer — Ingest - Deepu Das DevOps / Platform Engineer - Vishnu Nandanan M K People Operation Representive - Jancy Maria Lagy

create org structure for render II two project Reporting Ai Automation Report Delivery Lead (IST) - Aruna V R Strategist (USA) - Chris Rasmussen Data and Dashboard Engineer - Jayakrishnan Harikumar Data Engineer - Ann Therese Jose DevOps, SRE - Soorya Narayanan S QA - Stuthy G S Architecture, Architectural Decisions - Stalin Pereira Developer - **Sanjana P P , Harshvardhan K ** UX Design- Anoop Nandanan Executive Sponsor (ESii) coordinates client relationship and financials - Antony Satyadas People Operation Representive - Jancy Maria Lagy Project 2 - AI Automation Delivery Lead (IST) - Aruna V R GIS / Telecom SME (MST - Chris Rasmussen Lead Full-Stack Engineer — Governance/Platform - **Jude Sebastian Xavier ** AI Orchestration Lead - **Jasma K ** AI/ML Engineer - Classification Engine- Snehanjan Roy AI/ML Engineer — Classification Engine - Ashwin P QA Lead - Sthuthy G S Solution Architect- Stalin Pereira UX / Product Designer - Anoop Nandanan Executive Sponsor (ESii) coordinates client relationship and financials - Antony Satyadas SME , Business analyst - Alahari Sai Sreya Business Analyst - Anjana Sunil Software Engineer — Ingest - Saikrishnan A R Software Engineer — Ingest - **Deepu Das ** DevOps / Platform Engineer - Vishnu Nandanan M K People Operation Representive - Jancy Maria Lagy
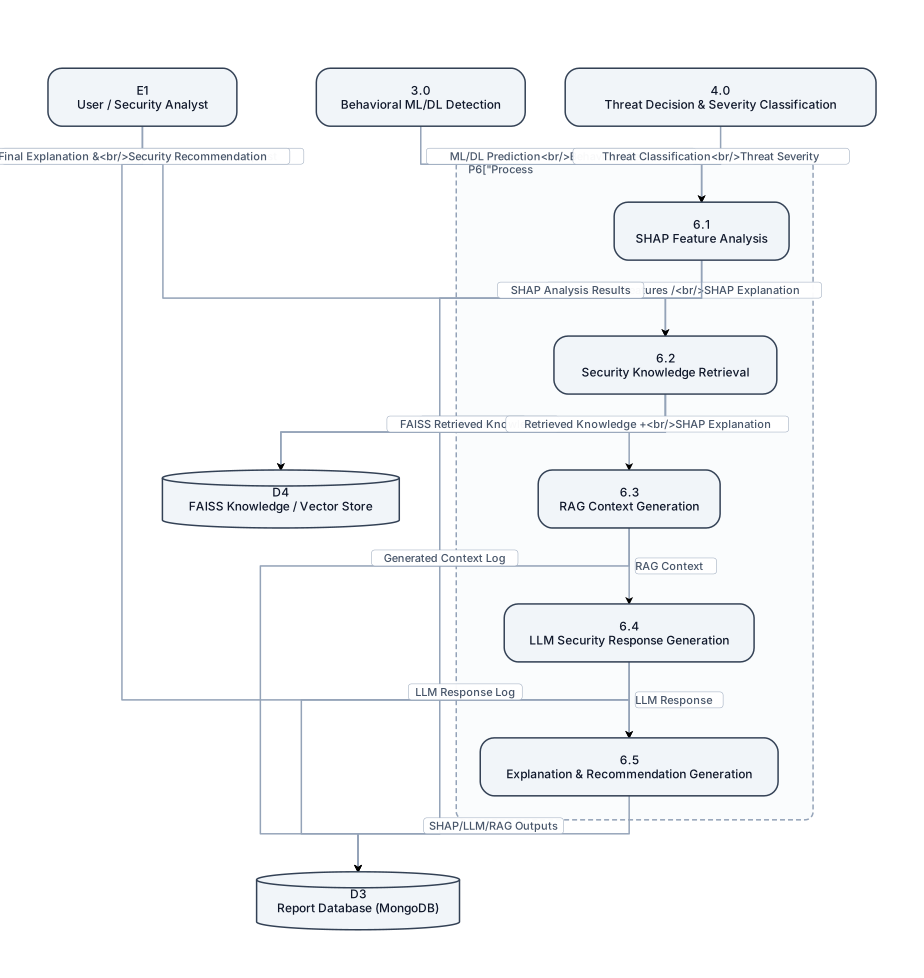
Create a detailed academic DFD Level 2 by decomposing Process 6.0 – LLM + RAG Security Assistant and SHAP Explainability from the Level 1 DFD of the Ransomware Detection and Autonomous Response System. Use standard DFD notation and include E1 User/Security Analyst, 3.0 Behavioral ML/DL Detection and 4.0 Threat Decision & Severity Classification as inputs. Decompose 6.0 into 6.1 SHAP Feature Analysis, 6.2 Security Knowledge Retrieval, 6.3 RAG Context Generation, 6.4 LLM Security Response Generation, and 6.5 Explanation & Recommendation Generation. Include D4 FAISS Knowledge/Vector Store and D3 Report Database (MongoDB). Show flows such as ML/DL Prediction, Behavioral Features, Threat Classification, Threat Severity → SHAP Analysis → Important Features/SHAP Explanation → Knowledge Retrieval → FAISS Retrieved Knowledge → RAG Context → LLM Response → Final Explanation & Security Recommendation → User. Also show User Security Query/Explanation Request entering the system and SHAP/LLM/RAG outputs being stored in MongoDB. Make it large, detailed, readable, professionally arranged, and suitable for a final-year engineering Review 1 PPT. Do not omit SHAP, LLM, RAG, FAISS, MongoDB, user interaction, detection information, explanations, and recommendations.
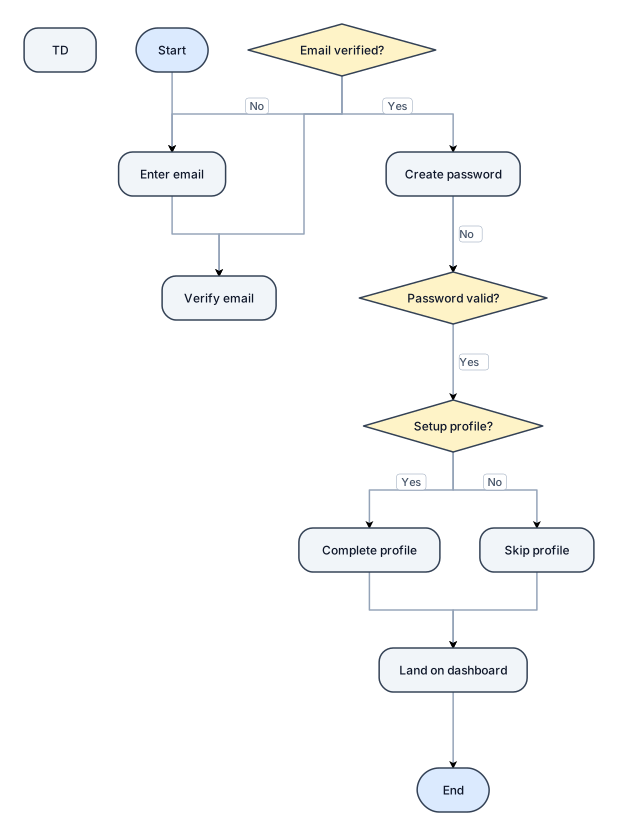
A flowchart for a user sign-up process: enter email, verify email, create password, optional profile setup, then land on the dashboard
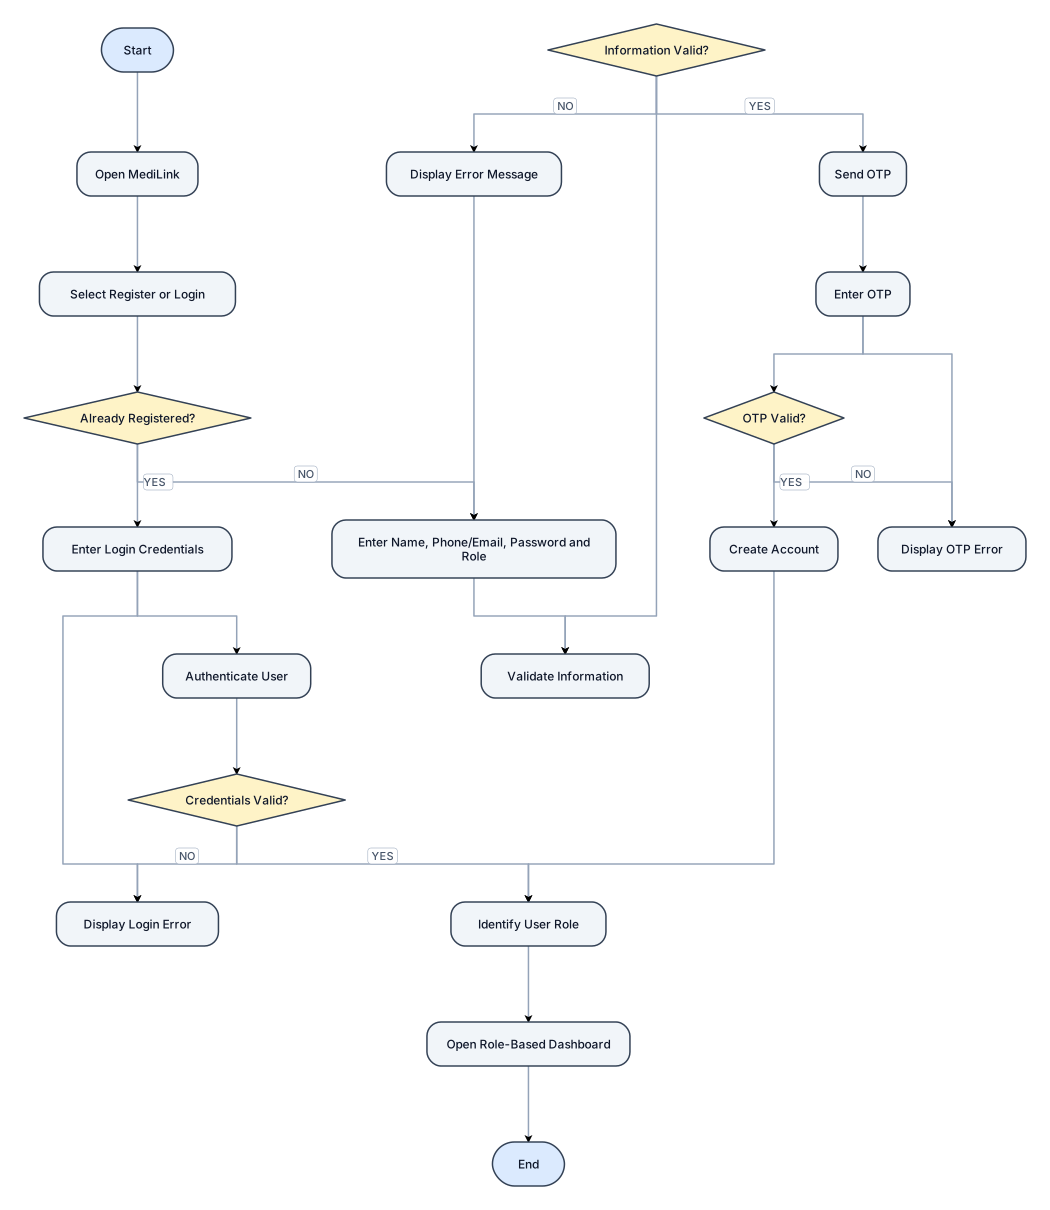
Create a flowchart titled: "Figure 5.1: MediLink User Registration and Login Flowchart" Show the complete authentication workflow. Flow: START → Open MediLink → Select Register or Login → Decision: "Already Registered?" If NO: → Enter Name, Phone/Email, Password and Role → Validate Information → Decision: "Information Valid?" → If NO: Display Error Message → Return to Enter Information → If YES: Send OTP → Enter OTP → Decision: "OTP Valid?" → If NO: Display OTP Error → Return to Enter OTP → If YES: Create Account If YES: → Enter Login Credentials → Authenticate User → Decision: "Credentials Valid?" → If NO: Display Login Error → Return to Login → If YES: Identify User Role Both successful registration and successful login must continue to: → Identify User Role → Open Role-Based Dashboard → END Use standard flowchart symbols and clearly label every YES and NO decision branch.
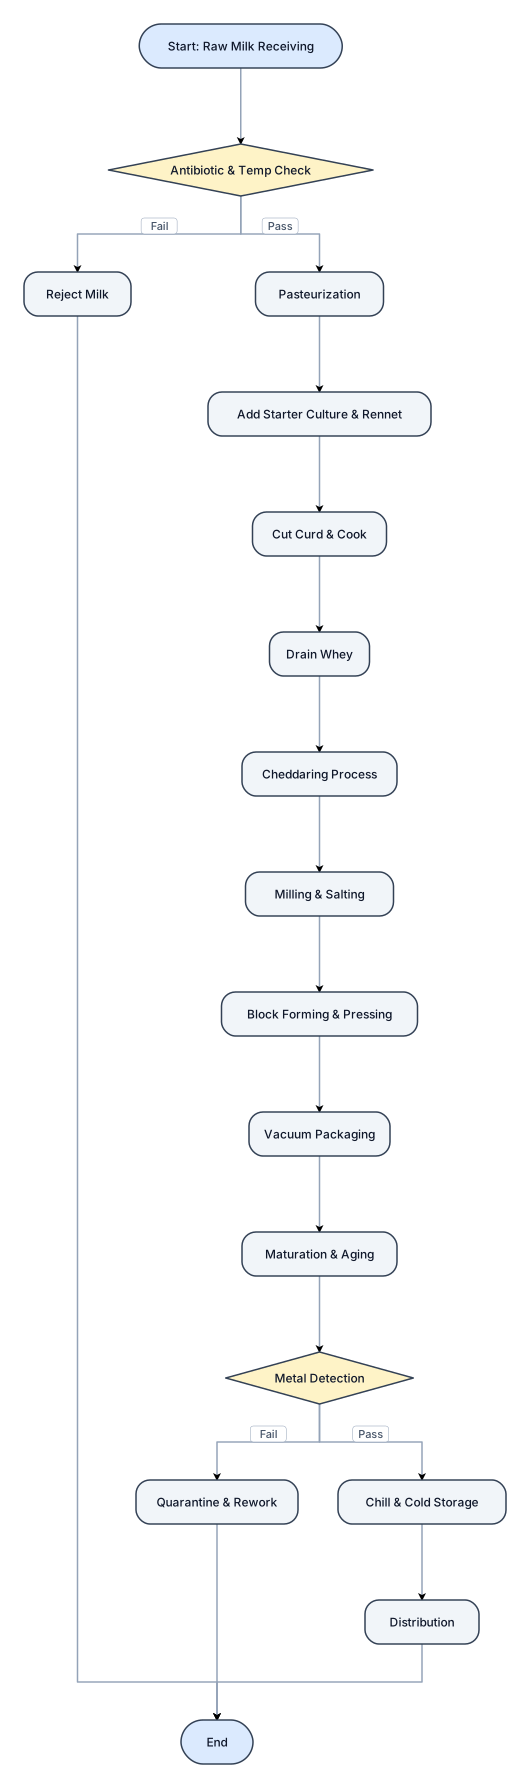
A flowchart of a Chadder Cheese HAcCP

A flowchart for chaddef cheese HACCP
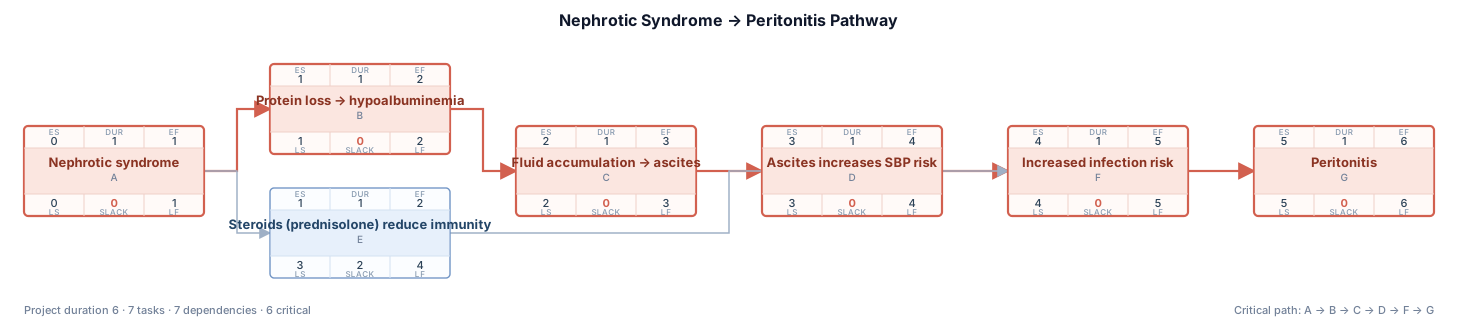
* في nephrotic syndrome يحدث: 1. فقدان بروتينات يؤدي إلى hypoalbuminemia 2. تجمع سوائل في البطن → ascites 3. وجود ascites يزيد خطر spontaneous bacterial peritonitis 4. استخدام steroids (prednisolone) قد يقلل المناعة ويزيد خطر العدوى end: peritonitis
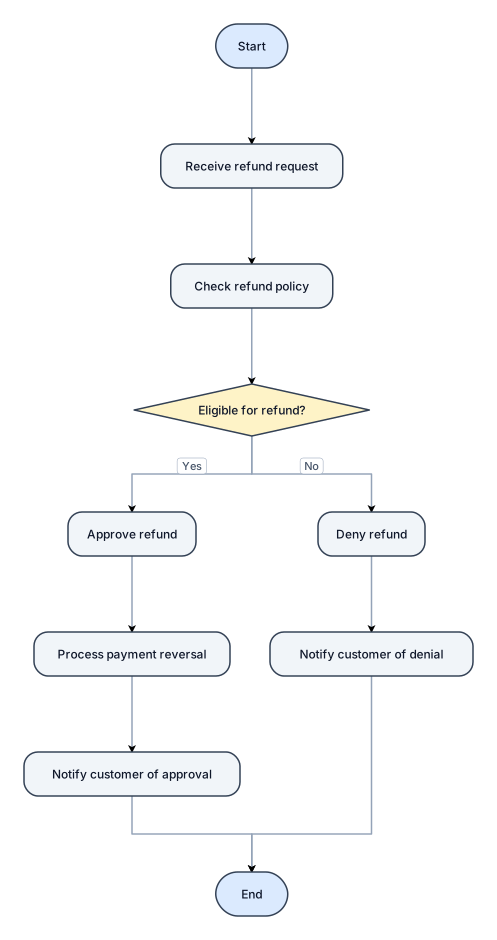
A flowchart for handling a customer refund request, with approve and deny paths
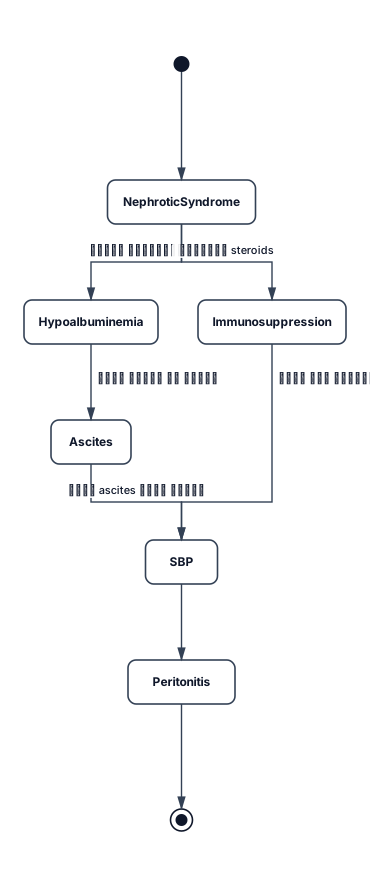
* في nephrotic syndrome يحدث: 1. فقدان بروتينات يؤدي إلى hypoalbuminemia 2. تجمع سوائل في البطن → ascites 3. وجود ascites يزيد خطر spontaneous bacterial peritonitis 4. استخدام steroids (prednisolone) قد يقلل المناعة ويزيد خطر العدوى end: peritonitis
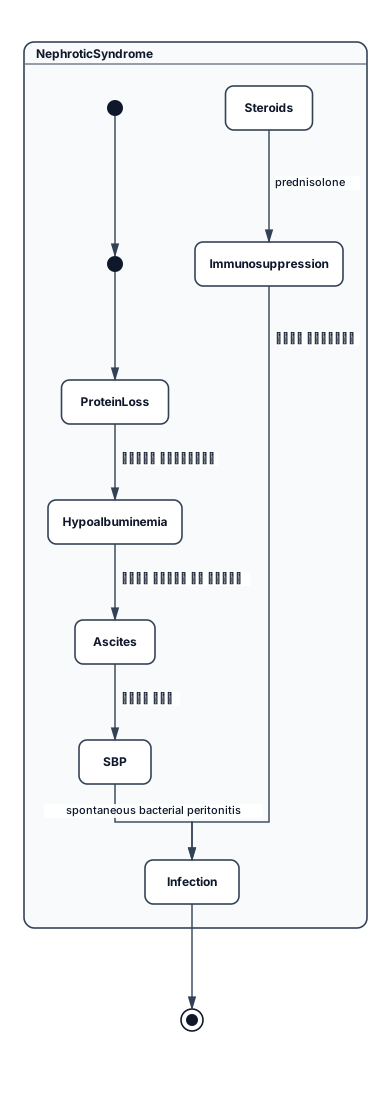
* في nephrotic syndrome يحدث: 1. فقدان بروتينات يؤدي إلى hypoalbuminemia 2. تجمع سوائل في البطن → ascites 3. وجود ascites يزيد خطر spontaneous bacterial peritonitis 4. استخدام steroids (prednisolone) قد يقلل المناعة ويزيد خطر العدوى
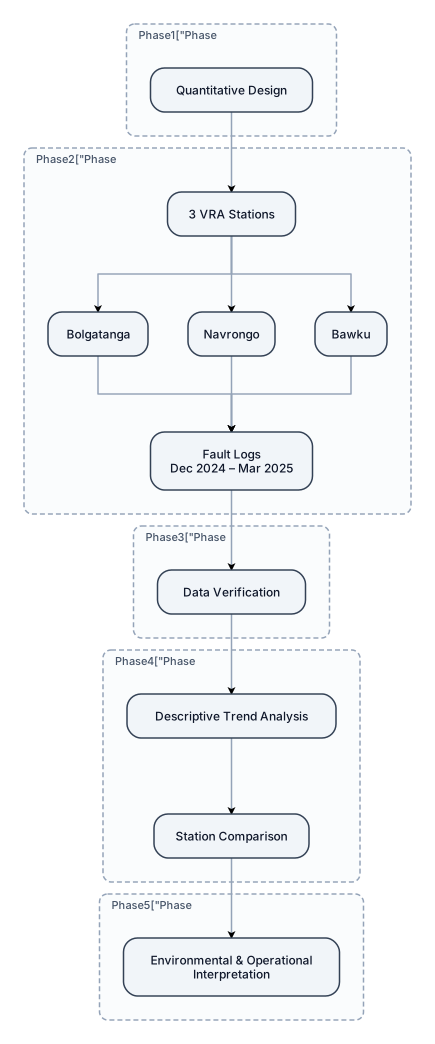
Quantitative Design → 3 VRA Stations (Bolgatanga, Navrongo, Bawku) → Fault Logs (Dec 2024–Mar 2025) → Data Verification → Descriptive Trend Analysis → Station Comparison → Environmental & Operational Interpretation. design it for academic conference paper
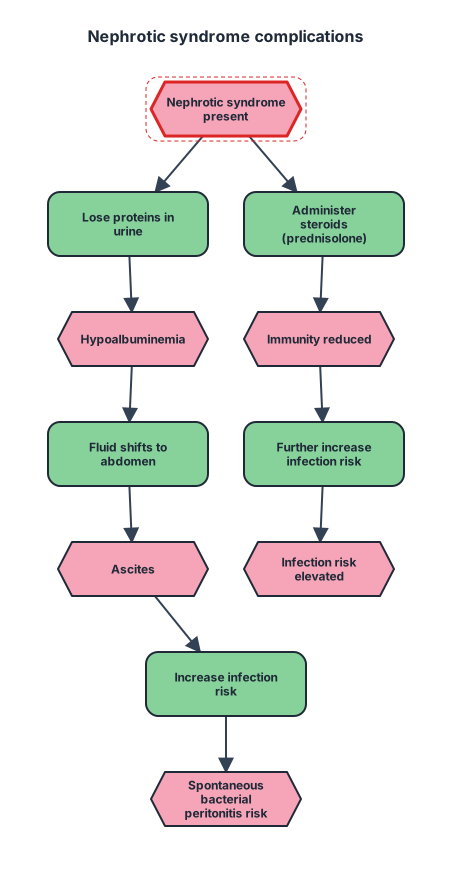
* في nephrotic syndrome يحدث: 1. فقدان بروتينات يؤدي إلى hypoalbuminemia 2. تجمع سوائل في البطن → ascites 3. وجود ascites يزيد خطر spontaneous bacterial peritonitis 4. استخدام steroids (prednisolone) قد يقلل المناعة ويزيد خطر العدوى
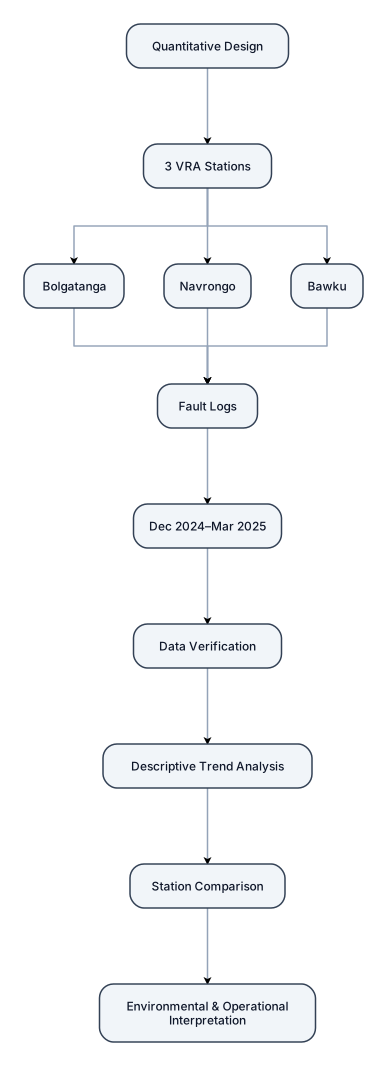
Quantitative Design → 3 VRA Stations (Bolgatanga, Navrongo, Bawku) → Fault Logs (Dec 2024–Mar 2025) → Data Verification → Descriptive Trend Analysis → Station Comparison → Environmental & Operational Interpretation
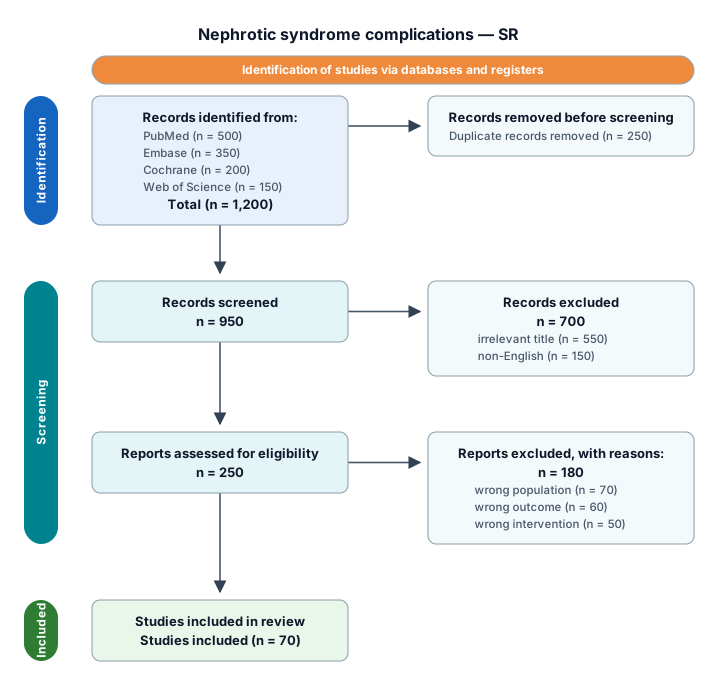
* في nephrotic syndrome يحدث: 1. فقدان بروتينات يؤدي إلى hypoalbuminemia 2. تجمع سوائل في البطن → ascites 3. وجود ascites يزيد خطر spontaneous bacterial peritonitis 4. استخدام steroids (prednisolone) قد يقلل المناعة ويزيد خطر العدوى
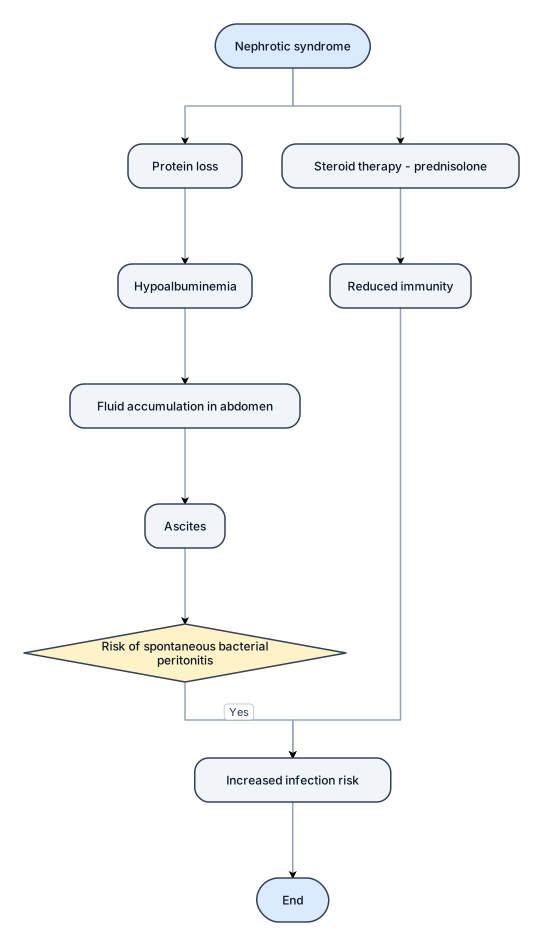
* في nephrotic syndrome يحدث: 1. فقدان بروتينات يؤدي إلى hypoalbuminemia 2. تجمع سوائل في البطن → ascites 3. وجود ascites يزيد خطر spontaneous bacterial peritonitis 4. استخدام steroids (prednisolone) قد يقلل المناعة ويزيد خطر العدوى
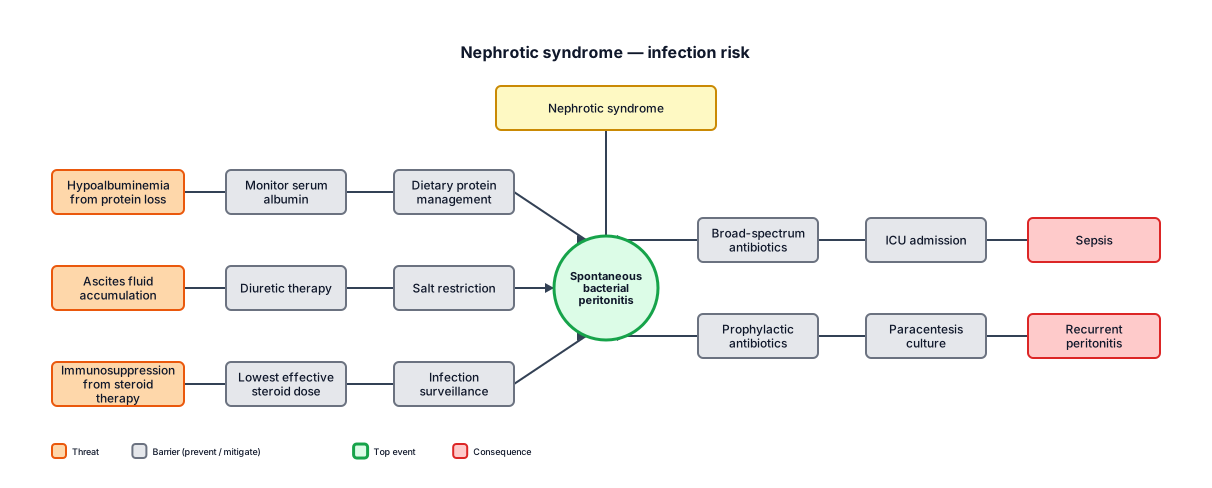
* في nephrotic syndrome يحدث: 1. فقدان بروتينات يؤدي إلى hypoalbuminemia 2. تجمع سوائل في البطن → ascites 3. وجود ascites يزيد خطر spontaneous bacterial peritonitis 4. استخدام steroids (prednisolone) قد يقلل المناعة ويزيد خطر العدوى
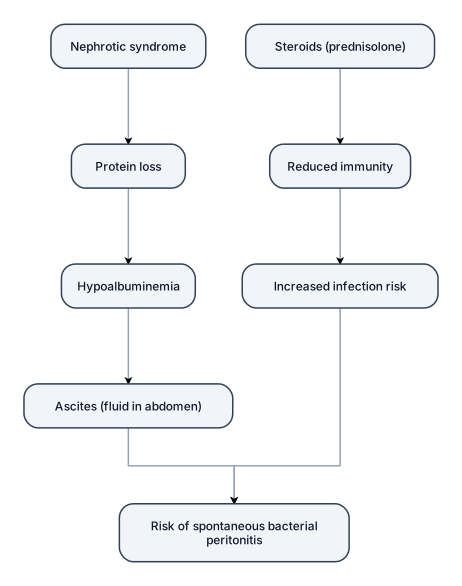
* في nephrotic syndrome يحدث: 1. فقدان بروتينات يؤدي إلى hypoalbuminemia 2. تجمع سوائل في البطن → ascites 3. وجود ascites يزيد خطر spontaneous bacterial peritonitis 4. استخدام steroids (prednisolone) قد يقلل المناعة ويزيد خطر العدوى

make me a fish bone diagram
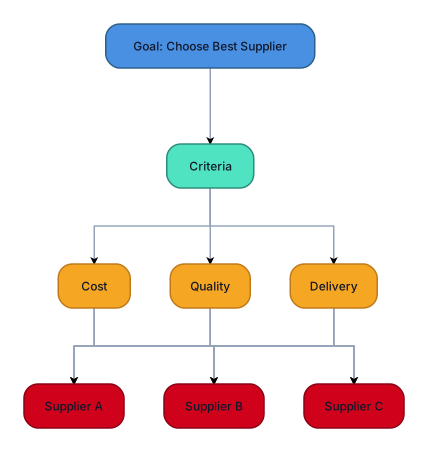
Create a coloured AHP diagram.
Focused examples and prompt ideas
Start with the complete visitor wall above, then use these focused collections when you want a narrower subject and more prompt context.
The first curated collection is being prepared.